[Retracted] Application of Wireless Sensor Network Model Based on Big Data Ecosystem in Intelligent Health Monitoring System
Abstract
With the continuous enhancement of people’s health awareness, the awareness of disease prevention began to improve, and the demand for intelligent health status monitoring is also increasing. At present, the health status monitoring mostly depends on hospital equipment, which has high cost and cannot realize remote analysis. Based on this, this paper studies and analyzes the application of wireless sensor network model based on big data ecosystem in intelligent health monitoring. ZigBee protocol is used to realize data transmission, wireless sensor is used to monitor human body temperature, heart rate, blood oxygen saturation, and other physiological indicators, human posture monitoring algorithm is used to monitor posture changes, which is combined with human physiological parameter information, and the long-term and short-term memory model is used to effectively use the time sequence information of data to realize the functions of physiological parameter measurement, wireless positioning, and information fusion. An experiment was designed to test the accuracy of the health monitoring system. The results show that the wireless sensor retention model can meet the design requirements in terms of the monitoring accuracy of body temperature, heart rate, and blood oxygen saturation index in intelligent health monitoring, with low cost and can be combined with human dynamic information.
1. Introduction
Modern medical models and medical concepts are gradually changing, from hospital centered to patient and family centered, from treatment centered to prevention and health care centered. The precise portable home monitoring system includes cholesterol, blood, blood pressure monitoring, and other portable health monitoring terminals. Users can take care of themselves at home and monitor their health status without completely relying on medical staff or being admitted to the hospital. However, the current level of medical informatization is still relatively low. Although families have electronic diagnostic apparatus, the doctors cannot obtain the first-hand data of blood pressure and blood glucose measured by themselves in time. Patients are still unable to get timely assistance. With the development of Internet of Things, cloud computing, sensor technology, and wireless communication technology, home health monitoring technology has been greatly developed in recent years. These health monitoring terminals allow patients to easily complete various health indicators at home. The traditional health monitoring system mainly includes two kinds: one is the Holter system, which records ECG data for 4 hours. It can be carried by patients, but it cannot carry out real-time diagnosis. The other is the bedside monitoring system used in the ward, which can carry out real-time diagnosis, but can only be used in fixed places in the hospital. With the development of computer technology, sensor technology, and medical device technology, using micro sensors to monitor human health has become the focus of research in the field of medical instruments. With the improvement of people’s living standards, people’s attention to health is also gradually increasing. The World Health Organization survey shows that the proportion of healthy people in the world is only 5%, and most people are in subhealth state [1]. At present, people have changed the concept of going to the hospital only when they are ill, and began to pay attention to the maintenance of the body in their daily life. Therefore, health monitoring has become a daily demand [2]. In the current health monitoring system, some countries have begun to establish telemedicine system to realize health monitoring through long-distance transmission and analysis of data [3]. Human life monitor also began to enter people’s daily life. The indicators that can be monitored include important physiological indicators such as body temperature, blood pressure, and heart rate [4]. However, these technologies are basically based on wired transmission, and the data obtained is only physiological data in a specific state, which cannot realize the dynamic analysis of data. The instrument is inconvenient to carry, and the supervision is very inconvenient [5].
Based on this background, this paper studies the application of wireless sensor network model based on big data ecosystem in intelligent health monitoring system, which is mainly divided into four chapters. Section 1 briefly introduces the research of health monitoring system and summarizes the chapter arrangement of this study. Section 2 introduces the application status of health monitoring and wireless sensors at home and abroad and summarizes the shortcomings of the current research. In Section 3, the wireless sensor network model based on big data ecosystem is constructed and applied to the intelligent health monitoring system. The wireless communication technology and ZigBee communication principle are used to realize the long-distance transmission of data. The important physiological indexes in human medical monitoring, such as temperature, heart rate and blood oxygen saturation, were selected as the research objects. A wireless sensor network of physiological parameters is designed to monitor physiological indicators. In Section 4, the health monitoring wireless sensor network constructed in this paper is simulated and tested, and the application effect of wireless sensor network is determined by analyzing the measurement accuracy of temperature, heart rate, blood oxygen saturation, and other indicators. The experimental results show that the algorithm proposed in this paper can effectively process information with high accuracy. In the monitoring of temperature, heart rate, and blood oxygen saturation, the relative error is relatively small and can obtain accurate physiological data. The classification and analysis of physiological parameters of different behaviors can provide more scientific data for human health monitoring.
The innovation of this paper is to establish a wireless sensor network for health monitoring. These sensors can not only monitor the daily physiological indexes of the human body but also detect the changes of physiological parameters in different states of the human body and can locate them accurately in real time. The data obtained by the system can use ZigBee technology to send information to personal terminals to remind people to know the health status in time.
2. State of the Art
In human intelligent health monitoring, great research progress has been made from the previous hospital physical examination to the current real-time monitoring. With the development of big data mining technology, all kinds of cluster analysis technology can be applied to data monitoring. For example, Orimoloye et al. used remote sensing technology to analyze the impact of surface temperature and radiation on human body temperature [6]. In the research and analysis, Chu et al. developed an active pulse sensing system using flexible sandwich piezoelectric electret film, which is similar to the pulse palpation of the trained traditional Chinese medicine doctors [7]. Guo et al. designed a simple and low-cost optical strategy of a stretchable strain sensor in the research and analysis. The sensor can measure 100% large strain, has low detection limit (±0.09%), fast response (12 ms), and high reproducibility (more than 6000 times), and can be assembled into clothes or installed on the skin surface [8]. In the research and analysis, Yoon et al. proposed a sensitive and selective sweat sensor based on flexible NICU (ooh)/polystyrene (PS) electrode for the detection of urea biomarkers [9]. Al-Temeemy proposed a descriptor for home health care monitoring system in research and analysis, which is generated by a color method to extract robust features from the image of the monitoring system and is robust to events that usually interfere with the monitoring system [10]. Luo et al. used paper substrate and spray deposited metal electrodes and traces to achieve low manufacturing cost. They used the capacitive sensing scheme of deformable triangular PDMS sensing film to study the trade-offs between different sensor array designs to achieve the best design. The fabricated sensor array can be comfortably attached to the individual’s temporal and ankle areas [11]. In the research and analysis, Li et al. used porous graphdiyne (GDY) material to build a printed respiratory sensor suitable for life and health monitoring, which showed ultrasensitive response and rapid recovery performance under real-time respiratory conditions, and realized 40 cm long-distance noncontact detection [12]. Parrilla et al. introduced a wearable paper-based chemical resistor for monitoring sweating dynamics (sweating rate and sweating volume), which realizes in vivo detection of biological fluid based on single-layer carbon nanotubes and surfactant (sodium dodecylbenzene sulfonate) nanocomposites integrated in cellulose fibers of traditional filter paper [13]. Dai et al. prepared a self-healing hydrogel with a variety of shape memory characteristics through one-step polymerization in the study, which is used to manufacture resistance strain sensors and capacitive pressure sensors and can detect various types of human motion [14, 15].
To sum up, we can see that there are many researches on health status monitoring at home and abroad, most of which use sensor technology. At present, the research of this technology has gradually matured, but most of them use wired technology, which has great limitations in application. Although many scholars have analyzed wearable technology, the cost of such equipment is generally high, and the monitored indicators are also very limited. There are some research results in human posture detection algorithms, but these are only monitoring human posture and cannot get real-time physiological data changes, and it is difficult to meet people’s needs for health monitoring. Therefore, it is of great practical significance to carry out the application research of wireless sensor networks based on big data ecosystem in intelligent health monitoring.
3. Methodology
3.1. Design of Wireless Sensor Network Model
At present, people pay more and more attention to health. There are many kinds of human health sensor monitoring equipment on the market, but the existing equipment can only monitor one index, and most of them adopt a wired transmission mode, which cannot realize real-time data acquisition and analysis. In this paper, the wireless sensor network junction is used to design and realize intelligent health monitoring. See Figure 1 for details. In the design of the system, the wireless sensor installed on the terminal node is used to monitor the human physiological indexes in real time, covering the important physiological parameters of temperature, heart rate, and blood oxygen saturation. The transmission is realized by ZigBee wireless sensor network, and the microprocessor processes the data and displays the results in real time [16].
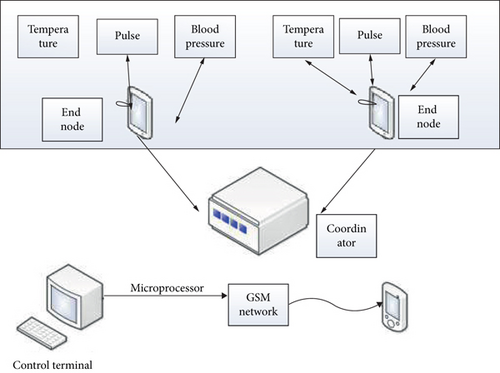
Considering that the system needs to monitor different human physiological indicators, each node needs to be miniaturized and does not affect people’s daily life, the cost is as low as possible and can meet the economic requirements of most people, and the sensor can continuously stimulate human information, so it needs a low-power consumption, simple operation, and reliable results. In this paper, ZigBee technology is selected in wireless sensor networks. The system is divided into three parts: front-end acquisition part, information acquisition part, and information transmission part [17]. The front-end acquisition is realized by wireless sensors, and the information is received by the upper computer at the computer end. The transmission between the lower computer and the upper computer is realized by ZigBee communication protocol, and these collected data are stored at the same time.
The wireless sensor network used in this paper adopts the simplest star network topology, which mainly covers two parts: terminal node and network coordinator [18]. The terminal node mainly collects human body temperature data, including data acquisition module and wireless receiving module. The terminal node sends the collected data to the coordinator. The coordinator is the core of the whole structure. It can initialize data, open physical channels, allocate addresses, and add or delete individual terminal nodes.
If the working frequency is 2.45 G, the length is about 2.9 cm. The design of the antenna can meet the requirement that the RF input/output impedance is 50 Ω.
3.2. Collection of Health Data
In the monitoring indicators of human health, heart rate cannot be ignored. At present, there are great differences in the action mechanism of wireless sensors that care about heart rate. The PPG monitoring method used in this study uses infrared light to pass through the tissue and emit infrared light, and the heart beat produces contraction, which affects the refractive index of light. The amount of blood in the tissue also affects the amount of light detected by the detector [21]. The infrared diode transmits the infrared light to the human body, and part of the light is reflected. Therefore, each heart beat will cause the change of the amount of infrared light. At the same time, a high gain amplifier is added to increase this change, and the heart rate can be obtained through the change of the amount of red light.
Based on the analysis of the channel characteristics with human body as the communication channel, in order to complete the transmission of sensor signal in human body channel stably and reliably, we need to choose a reasonable signal coupling mode. Unlike wireless communication, which transmits data through air, human communication channel is a human tissue structure with complex electromagnetic characteristics. How to take an effective way to couple the signal into the human body channel and realize the efficient transmission of the signal in the human body channel is the most critical problem to realize human body communication. Considering the motion state of human body, it is necessary to adopt wireless positioning method in human body positioning, consider the factor of saving components, and use the signal strength RSS of ZigBee protocol to realize positioning analysis. The distance between the two stages measures the received signal energy. This technology needs to combine multiple reference nodes. At present, there are three positioning methods based on RSS, among which there are some differences in approximate calculation methods, which need to be used by multiple routers at the same time, with insufficient accuracy, sensitive to noise data, and insufficient use [24]. Fingerprint location method is the most widely used, with an accuracy of 2~3 M and strong anti-interference ability. However, considering the indoor dynamic multipath effect, the accuracy will be reduced. Therefore, this location method needs to be improved. Multiple multichannel location can reduce the instability caused by the measurement of a single frequency band.
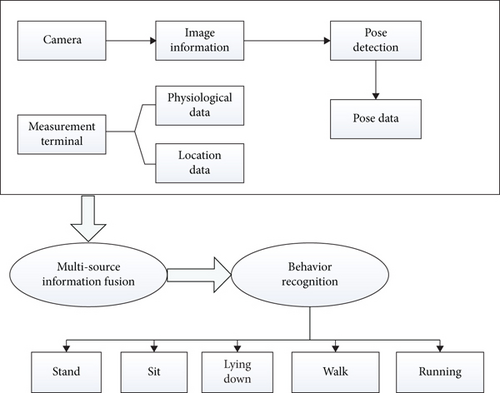
In the fusion analysis of human physiological indexes, it is necessary to collect human image information first, then combine the simulation data of human motion state, and fuse the data with physiological indexes after obtaining the data, as shown in Figure 2. The motion state of human body is divided into dynamic state and static state, and the most representative state is selected for analysis. Considering that human posture is not easy to obtain directly and changes at any time, it is necessary to extract human image data. In this paper, convolutional neural network is used. The convolution neural network inputs a picture with three channels. With the calculation, the feature size is gradually reduced and the number of channels is increased. With the deepening of the network, the obtained eigenvalues are also increasing [25]. It is difficult to recognize actions only by human posture, which also needs to be combined with human physiological indexes and position changes. It is difficult to analyze directly by using data [26]. Therefore, the long-term and short-term memory model is used for analysis, and the changes of human physiological indexes are tracked for a long time after recognition. Obtain the changes of physiological indexes in different states to realize the long-term monitoring of health status.
4. Result Analysis and Discussion
4.1. Simulation Experiment Analysis
This paper collects the medical information of the ward through the distributed wearable sensor device through the health monitoring system platform. Data transmission through the public network can realize uninterrupted real-time health monitoring for anyone at anytime, anywhere. There are great differences in the unit and range of collected data, which cannot be analyzed directly. Therefore, it is necessary to standardize the data first. Using the zero mean standardized processing method, 80% of the obtained data are used as the training sample set, and the others are used as the test sample set to test the application effect of different algorithms. In the analysis of physiological index and position change data, because classification is very important, the long-term and short-term memory algorithm (LSTM) used in this paper is compared with other classification algorithms. Support vector machine and multilayer sensing algorithm cannot directly use the data, so the data are spliced together. These data include body temperature, heart rate, blood oxygen saturation, and human posture data. In the test, different algorithms adopt the same training strategy, the learning rate is set to 0.001, 500 iterations, and the time sliding window length is 5. The accuracy test results of different algorithms are shown in Figure 3.
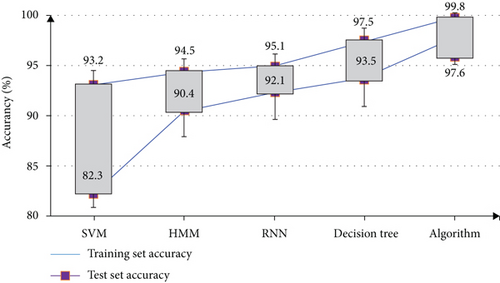
It can be seen from the data in the figure that in data processing, machine learning algorithm and multilayer perception algorithm cannot effectively extract data, and the accuracy is lower than LSTM algorithm. Neural network algorithm and RNN algorithm will over fit, and the accuracy of multilayer sensing algorithm in the test set is too low. LSTM algorithm can effectively process information with high accuracy, which is because this algorithm can deal with the problem of gradient disappearance and improve the accuracy.
In the system design, the indicators of power consumption and cost cannot be ignored. The power consumption reflects the performance of the system design. The wireless sensor network used in this design system uses battery power supply, so it is necessary to reduce the power consumption as much as possible. In this group, low-power equipment is selected, and two dry batteries can provide voltage for the system. In terms of cost, the cost is also relatively low, meeting the requirements of low design cost.
4.2. Health Monitoring and Evaluation
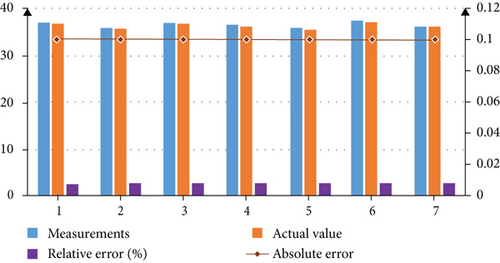
The maximum transmission distance of a single wireless sensor node is 300 m in an open environment. If a larger distance is required, an attack and release module needs to be added to cover a wider range. The wireless sensor is used to monitor the body temperature. Under normal conditions, it is tested for 5 times, and the measurement results are compared with the household electronic thermometer. The test results are shown in Figure 4. From the data in the figure, it can be seen that the wireless sensor network used in this paper has higher accuracy, more stability, and less absolute error.
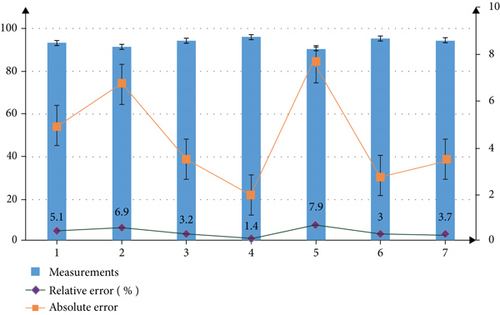
After the ratio of red light to infrared light is obtained, the test results can be obtained according to the calculation formula of blood oxygen saturation. After the red light and infrared light output by the sensor pass through the method, the collected red light voltage value is 0.151 V and the infrared light voltage value is 0.157 V, and the measured current value and blood oxygen saturation value are calculated. The blood oxygen saturation test is carried out under normal conditions. Each person tests 10 groups of data to calculate the average value. The test results are shown in Figure 5. Compared with the normal value, the absolute error is small and meets the design requirements.
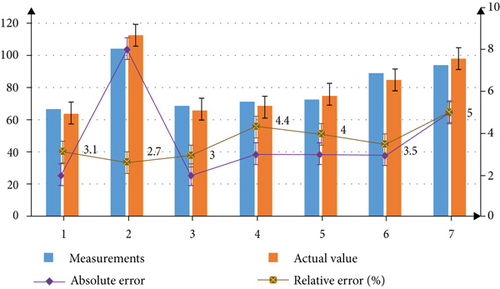
When measuring human heart rate, the signal output by the sensor is transformed into pulse signal after processing, and the heart rate value is obtained by counting. Under normal circumstances, the test object is tested, and each person tests 10 groups of data to calculate the average value. The test results are shown in Figure 6. The absolute error does not exceed 6%, and the measurement accuracy is high.
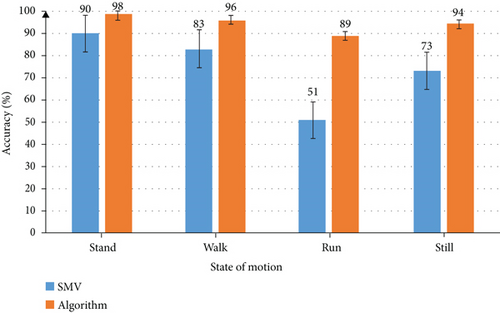
In human posture monitoring, based on tiny OS platform, node sensors are used to collect simulated fall data, with a sampling rate of 10 times per second, simulate the condition of human body in walking state, and process the collected data. At the moment of falling, the acceleration of the three axes will change, so the falling behavior of the monitoring object can be judged. The algorithm in this paper is combined with other algorithms to collect 10 groups of falling data in different states, take the average value, and conduct simulation analysis. The results are shown in Figure 7. From the data change in the figure, it can be seen that several algorithms can monitor the dumping in a calm state, but in a moving state, only the algorithm used in this paper is ideal. This is because the algorithm introduces the inclination eigenvalue as the reference object on the basis of SMV algorithm, so the accuracy can be improved.
4.3. Monitoring and Analysis of Human Health Data in Different States
After completing the monitoring of various indicators of health status, it is necessary to conduct a comprehensive analysis combined with behavior to analyze the changes of various physiological indicators under different behaviors. Select a test to test human physiological indexes and remove abnormal data values. Criteria for judging abnormal values of health evaluation of physical examination items are as follows: in the physical examination of residents, the abnormal values are judged according to the following criteria, and the corresponding health suggestions and health evaluation of abnormal values can be given in the general physical examination. If there are no symptoms, it may be physiological data changes, which do not need special treatment. Generally, it does not affect health. Take temperature change and heart rate change as examples for data analysis. The test results are shown in Figures 8 and 9.

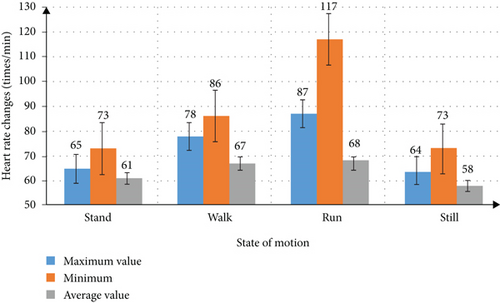
From the data changes in the figure, we can see that under different behavior modes, physiological index parameters will change differently. For example, the heart rate in the static state is lower than that during running. The classification and analysis of physiological parameter indexes of different behaviors can provide more scientific data for human health monitoring.
5. Conclusion
This paper studies the application of wireless sensor network model based on big data ecosystem in intelligent health monitoring and designs ZigBee protocol architecture. The front-end nodes of wireless sensor networks mainly collect physiological index data and send it to microprocessors. The control terminal collects and analyzes data and displays abnormal data changes. In human posture monitoring, through the comprehensive analysis of physiological indicators, we can obtain the physiological data changes under different exercise states. The functional test results show that the accuracy of the posture monitoring algorithm used in this paper is higher than the traditional algorithm, and the monitoring accuracy of each physiological index is relatively high. It should be pointed out that in the monitoring of physiological indicators, this paper selects more typical indicators. In addition to these indicators, physiological indicators such as pulse, blood pressure, blood glucose, and electrocardiogram also need routine monitoring, and more monitoring modules need to be added to the sensor node. At the same time, wireless cashier is used to monitor human body temperature, heart rate, and blood oxygen saturation, and common wireless sensors in the market are used to save costs. There are some limitations in the research. Although the fingerprint location method used in this paper has high accuracy, it takes a certain amount of time. Future research needs more superior location and monitoring algorithms.
Conflicts of Interest
The author declares that there are no known competing financial interests or personal relationships that could have appeared to influence the work reported in this paper.
Open Research
Data Availability
The data used to support the findings of this study are available from the corresponding author upon request.


