Exploration on Signal Processing Performance of Wireless Sensor in Electromagnetic Interference Environment
Abstract
In order to deeply analyze the performance of Electromagnetic Field (EMF) on wireless sensor Signal Processing (SP), this paper first examines the influencing factors of wireless sensor SP performance based on the relevant theories of EMF and wireless sensor. Then, it discusses the influence of EMF on wireless sensor information Transmission and Reception (T & R) time, Package Reception Rate (PRR), and communication throughput. Furthermore, the Packet Loss Rate (PLR) and Bit Error Rate (BER) of the sensor are described, and finally, a conclusion is drawn. The research findings are as follows. This paper makes a statistical study on whether the wireless sensor is disturbed by EMI from three aspects (wireless sensor’s information T & R time, PLR, and communication throughput). In any case, EMF will prolong the wireless sensor’s information T & R time and reduce the PRR and communication throughput. When the distance between the transmitter and the receiver is set to 5 m, the change of field intensity at the transmitter significantly impacts the BER but has little impact on the PLR. However, when the field intensity of the transmitter and the receiver is the same, PLR and BER show no evident difference. Therefore, this paper studies the SP performance of the wireless sensor in the EMI environment, which provides an excellent reference significance for the rapid development of wireless sensors in the future.
1. Introduction
With Science and Technology (S & T) advancement, Wireless Sensor Technology (WST) is seeing a more important role in production and life. At the same time, the wireless sensors are always interfered with by the Electromagnetic (EM) Field (EMF) [1]. Therefore, how to reduce the impact of EMF on wireless sensors’ Signal Processing (SP) performance has become one of the major problems [2, 3]. Mehran et al. optimized the concept of EM Compatibility (EMC) and proposed three necessary conditions for EM compatible systems: (1) The system would not affect or interfere with other systems. (2) The system would not be affected by other systems’ radiation. (3) The system would not interfere with breeding. EMC can solve EM Interference (EMI) in wireless sensor signals [4]. Yu et al. optimized the wireless sensor-oriented SP method using the additive equivalence principle. They concluded that the farther the EMF was, the smaller its impact on the wireless sensors’ SP performance. Additionally, the researchers calculated the EMF wires’ specifications. They found that 8×LGJ-300/40 wires had relatively little impact on the wireless sensor signal, providing a sure basis for selecting the EMF wire model [5]. Abdel et al. proposed to analyze the EMF influence on wireless sensors’ SP performance by a boundary element method. The experiment had chosen a single-circuit transmission line, suitable for traditional power grids and inconsistent with real-life applications. Consequently, the proposed scheme was not applied in practice [6]. Li et al. optimized the strategy of Abdel et al. and introduced multicircuit and multisplit transmission lines instead of the single-circuit transmission line and discovered that the ground EMF Intensity (INT) would increase with the increase of the number of split transmission lines and the distance between the EMF [7].
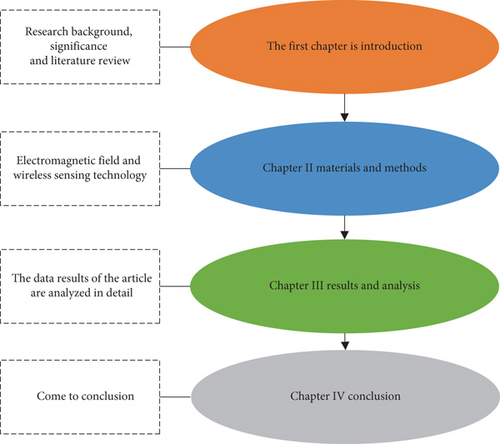
In this context, the present work starts with the wireless sensors’ SP performance expounds on the influence of EMF on wireless sensors from information Transmission and Reception time, information reception rate, and communication throughput. Then, it deeply analyzes wireless sensors’ Bit Error Rate (BER) and Packet Loss Rate (PLR) variation in different fields of view. The above experts and scholars have studied the SP performance of WST in the EMI environment from different angles. Still, they have not analyzed it from all aspects, which has a certain-sidedness. According to a particular theoretical logical order, the present work comprehensively analyzes the research on wireless sensor SP performance in an EMI environment using comparative analysis and other methods. It attempts to provide a methodological reference for the research on wireless sensor SP performance in the EMI environment. Figure 1 unfolds the specific structure of this paper.
2. EMF and Wireless Sensor Theory
2.1. Basic Principle of EMF
EMW is a movement form of EMF, but in high-frequency electric oscillation, magnetoelectric interaction is swift, and all energy cannot return to the original oscillation circuit. As a result, Electric Energy (EEIX) and magnetic energy propagate to space through EMW with the periodic transformation of EF and MF [8–10]. The EMW is a shear wave, and the MF, EF, and traveling direction of the EMW are perpendicular to one another [11–13]. The propagation of EMW includes ground waves propagating and airwaves propagating. The longer the Wavelength (WL) of the ground wave is, the less its attenuation is [14–16]. The longer the WL is, the easier it is to bypass obstacles and propagate farther [17, 18].
MWE is one of the core methods to study EMF, mainly composed of four theorems: Ampere’s Circuital Law (ACL), EM induction law, Gauss’s law of electric flux, and Gauss’s law of magnetic flux [19].
2.1.1. ACL
Equation (1) represents the loop integral of the magnetic field INT in the magnetic field along any closed directed curve, equal to the sum of the currents passing through the curved surface determined by the closed integral path. μ0 denotes the permeability in a vacuum. I indicates the wire current. dl stands for the line element on l. B is the magnetic field.
2.1.2. EM Induction Law
In Equation (3), Δt represents the time cost for the change, and Δϕ indicates the magnetic flux change.
2.1.3. Gauss’s Law of Magnetic Flux
In Equation (5), s represents a closed surface. da denotes a small area fraction. The remaining letters share the same meaning as those in the above equations. Gauss’s law of magnetic flux states that the vector line of magnetic induction INT is a continuous and uninterrupted closed vector line, showing that the magnetic field is passive.
2.1.4. Gauss’s Law of Electric Flux
In Equation (6), D and q represent the electric flux and the amount of charge, respectively, and the remaining letters share the same meaning as those in the above equations.
2.2. EMF Differential Equations
Equation (7) calculates the differential forms of ampere loop law, EM induction law, Gauss’s law of magnetic flux, and Gauss’s law of electric flux, respectively. R, L, F, T, and ρ represent magnetic field INT, current density, electric field INT, potential shift vector, and the charge density, respectively. ∂ϕ/∂t signifies the partial derivative of induced electromotive Potential Energy, and the remaining letters share the same meaning as those in the above equations.
In Equation (8), ε, μ, and σ represent the dielectric constant, magnetic permeability, and conductivity, respectively. The remaining letters share the same meaning as those in the above equations.
The EF and MF can be analyzed separately to simplify the EMF calculation and analysis. Firstly, two different variables need to be introduced: Vector Magnetic Potential (VMP) and Electric Scalar Potential (ESP) [21]. Equation (9) displays the specific calculation form.
In Equation (9), A represents VMP, and the remaining letters share the same meaning as those in the above equations.
In Equation (10), ∅ represents ESP, and the remaining letters share the same meaning as those in the above equations.
Equations (9) and (10) suggest that the VMP and ESP are related to the four theorems in Section 2.1 and, thus, can be applied to them. The specific forms are shown in Equations (11) and (12).
In Equation (11), ∇2 represents Laplacian, and the remaining letters share the same meaning as those in the above equations.
In Equation (12), the letters share the same meaning as those in the above equations.
In Equation (13), the letters share the same meaning as those in the above equations.
In Equation (14), the letters share the same meaning as those in the above equations.
2.3. Boundary Conditions (BCs) in EMF Interference Environment
The real solution of EMF must be constrained by the given BCs and Initial Conditions (ICs) to get a practical solution. BCs mainly involve (1) Dirichlet BC, (2) Neumann BC, and (3) mixed BC [22].
Equations (17) and (18) calculate the Dirichlet BC.
In Equations (17) and (18), φ represents the Dirichlet BC, and the remaining letters share the same meaning as those in the above equations.
In Equation (19), ri is the surface potential of any conductor, and Ci is a known constant.
The Neumann BC is calculated by Equations (23) and (24).
In Equation (25), σi represents a known function.
In Equation (26), qi is a known value, and the conductor is an allele.
The mixed BC is calculated by Equations (27) and (28).
2.4. Wireless Sensor Network (WSN) System Architecture
WSN mainly comprises data acquisition, data promulgation network, and control management center. Its operation principle integrates the sensor nodes with processing units and communication modules. Then, a distributed network composed of nodes is formed through preset protocols. Finally, the collected data are transmitted to the Information Processing Center (IPC) through radio waves after optimization [23]. Figure 2 depicts the specific system structure.
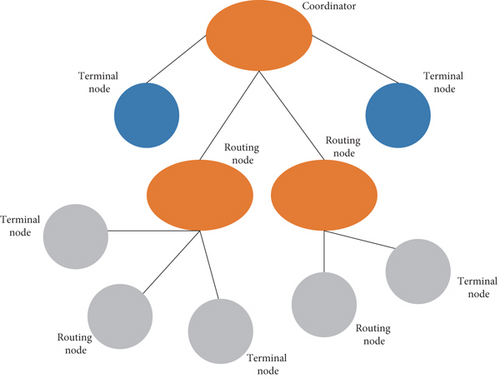
Figure 3 Outline of the characteristics of wireless sensors.
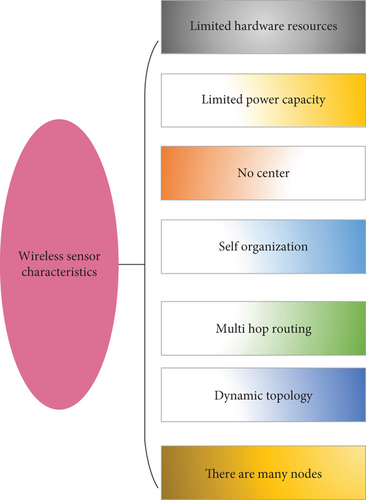
Figure 3 unfolds the wireless sensor features: limited hardware resources, limited power capacity, centerless self-organization, multihop routing, dynamic topology, a large number of nodes, limited transmission capacity, and security problems.
Figure 4 divides the threats to WSN into four categories.
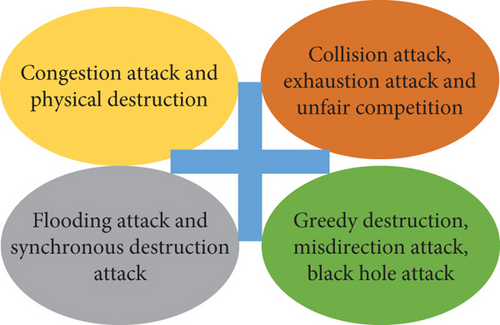
Figure 4 classifies the threats to wireless sensor networks into four types: Type I (congestion attack and physical destruction), Type II (collision attack, depletion attack, and unfair competition), Type II (discarding, greedy destruction, and misguided directional attack, and Type IV (flooding attack and synchronous destruction attack).
2.5. Influencing Factor Analysis of Wireless Sensor
An active EMF will produce EMW and trigger interferences to wireless sensors. Wireless sensors receive one kind of interference through the antenna; the other generates coupling on the line inside the wireless sensor, directly affecting the internal circuits [24].
2.5.1. Analysis of Influence on Wireless Sensor Antenna
Then, this section chooses the dipole antenna for the wireless sensor, as drawn in Figure 5.
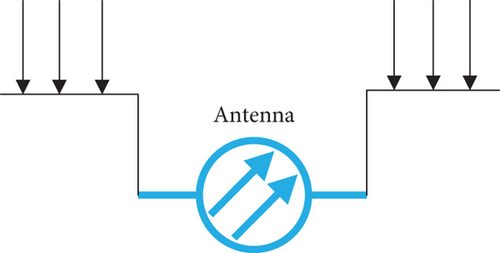
In Equation (30), Y, H, and V represent the induced voltage OMT, the antenna length, and the horizontal INT, respectively.
Figure 6 can be obtained by replacing the antenna model with a typical circuit.
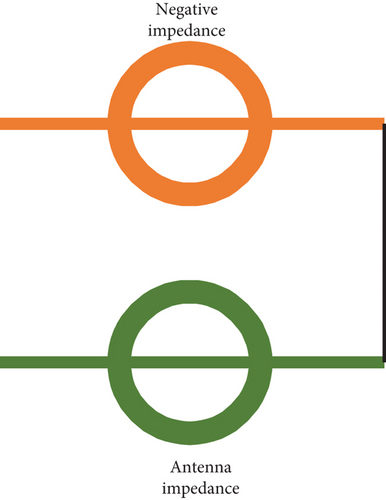
In Equation (31), Z1, Z2, and Q indicate internal load impedance, antenna impedance, and interference current, and the remaining letters share the same meaning as those in the above equations.
2.5.2. Impact Analysis on the Internal Loop of Wireless Sensor
In real life, the antenna effect is jointly affected by the radiation field signal’s WL and the sensor’s internal circuit size. Figure 7 specifies the coil induction principle.
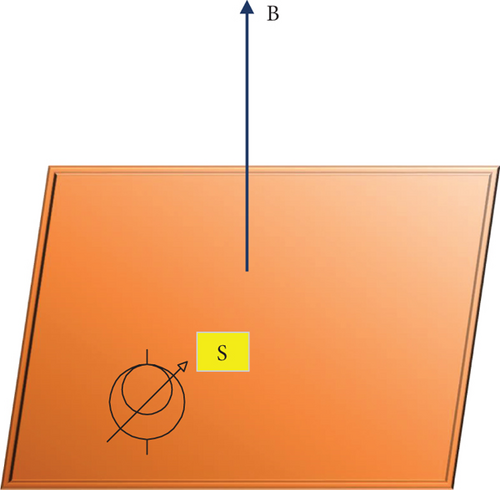
In Equation (32), B, s, and Y represent the magnetic field INT, the loop area, and the induced voltage INT, and the remaining letters share the same meaning as those in the above equations.
2.6. Adopted Research Methods
- (1)
Literature review method: it refers to the comprehensive introduction and elaboration of articles through reading, analysis, induction, and sorting out the latest progress, academic opinions, or suggestions of current topics, problems, or research topics [25].
- (2)
Quantitative and qualitative analysis: it refers to a standard method to analyze, study, and summarize quantity characteristics, the logical relationship between quantities, and the changing trend of quantity by collecting relevant research data. Specifically, qualitative analysis refers to how the forecaster analyzes the future development trend, change, and nature according to relevant data changes over the years, government policy releases, and influential major social events [26, 27].
- (3)
Simulated charge method: the principle is to equivalently replace the spatially continuously distributed charges with a limited number of discrete charges arranged at a specific geometric position. Then, it calculates the potential distribution and EF INT from these discrete charges according to the superposition principle [28, 29].
- (4)
Boundary element method: the boundary is discretized into a series of elements. The boundary value problem is equivalent to the boundary integral equation problem. Then, the finite element discretization technology is used to solve the field problem [30–33].
3. Analysis of EMF Interference on Wireless Sensor SP Performance
3.1. Influence of EMF on the Wireless Sensor from Different Perspectives
This section starts from the following points to study and analyze the influence of EMF on wireless sensor’s SP performance:
3.1.1. Sending and Receiving Time of Wireless Sensor Signal
Firstly, the computer is used to set the signal sending interval to one second. It counts the time when the other party receives 35 pieces of information, and finally, it measures the results in the environment with or without EMI. Figure 8 shows the specific experimental results.
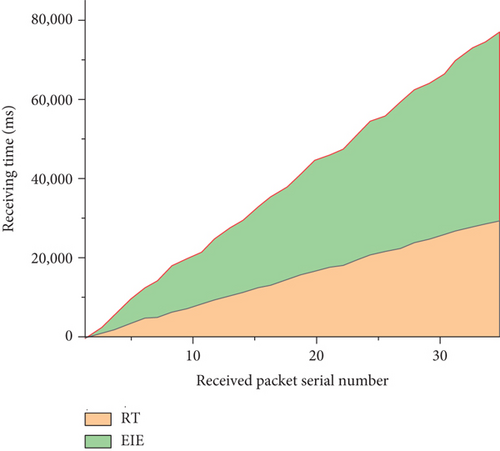
As illustrated in Figure 8, the signal receiving time of wireless sensors in the environment with or without EMI shows an increasing trend. The maximum signal receiving time without EMI is 30,000 ms, and the received packet Serial Number (SN) is 35. The maximum signal receiving time under EMI is about 72,000 ms, and the received packet SN is also 35. This data group suggests that the EMF can prolong the wireless sensor’s signal receiving time by about 42,000 ms.
Additionally, Figure 9 shows the influence of EMF on the wireless sensor in different environments.
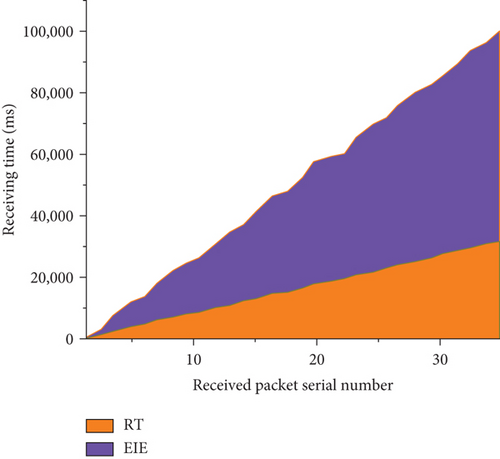
Figure 9 is similar to Figure 7 in data changes. The wireless sensor’s signal receiving interval shows an increasing trend regardless of EMI. In different environments, the wireless sensor’s maximum signal receiving time without EMI is 30,000 ms, and the received package SN is 35. Meanwhile, the wireless sensor’s maximum signal receiving time under EMI is about 96,000 ms. At this time, the received packet SN is also 35. Apparently, under EMI, the wireless sensor’s signal receiving time is extended by about 66,000 ms.
3.1.2. Wireless Sensor’s Package Reception Rate (PRR)
Firstly, the computer is used to set the signal sending interval of the wireless sensor to 100 ms. It counts the time when the other party receives 35 pieces of information, and finally, it counts the results in the environment with or without EMI. Figure 10 specifies the experimental results.
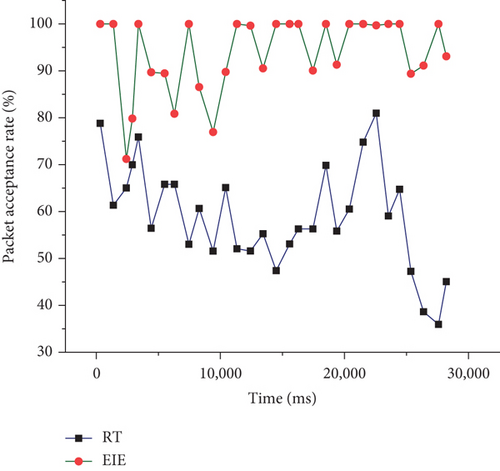
Figure 10 proves that the PRR of the wireless sensor in the environment with and without EMI is constantly fluctuating. In the same environment, the PRR of the wireless sensor without EMI fluctuates between 72% and 100%, with 16 times 100% and once 70%. Under the EMI, the PRR of wireless sensor fluctuates between 35% and 81%, with one time 81% and 35% PRR each.
Figure 11 reflects the influence of EMI on the wireless sensor in different environments.
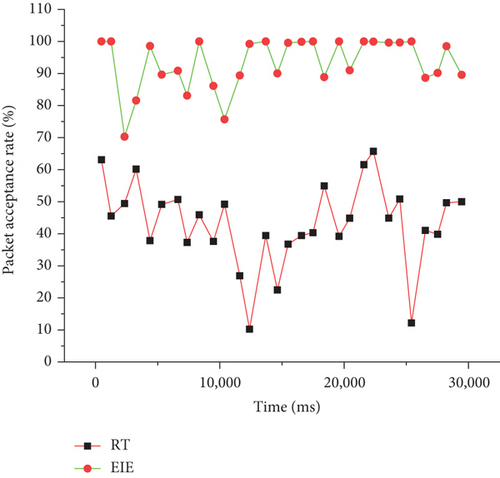
The data change in Figure 11 is similar to that in Figure 9, constantly fluctuating. The PRR of the wireless sensor without EMI in different environments is basically the same as that in the same environment. Under EMI, the wireless sensor’s PR fluctuates between 10% and 68%, with one time 68% PRR and twice 10% PRR.
3.1.3. Wireless Sensor’s Communication Throughput
Figure 12 first fixes the signal sending interval of the wireless sensor at 5 ms, counts the information received by the system within one second, and finally calculates the communication throughput in the environment with or without EMI.
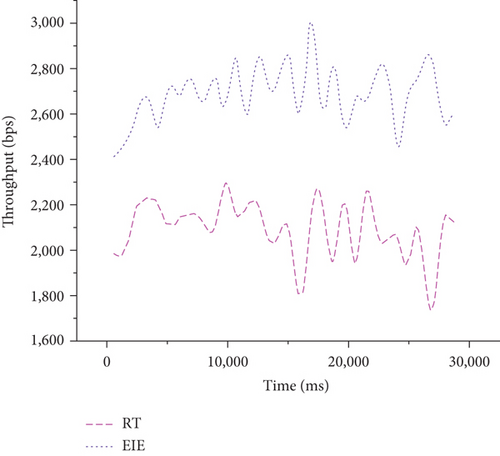
As described in Figure 12, the wireless sensor communication throughput in the same environment constantly fluctuates. The communication throughput in the environment without EMI is between 2,400 and 3,100, and the highest point is between 1,500 ms and 20,000 ms. The communication throughput under the EMI environment is 1,700~2,300, the highest point is between 5,000 ms and 10,000 ms, and the lowest point is between 25,000 ms and 30,000 ms.
Figure 13 details the influence of EMI on wireless sensor communication throughput in different environments.
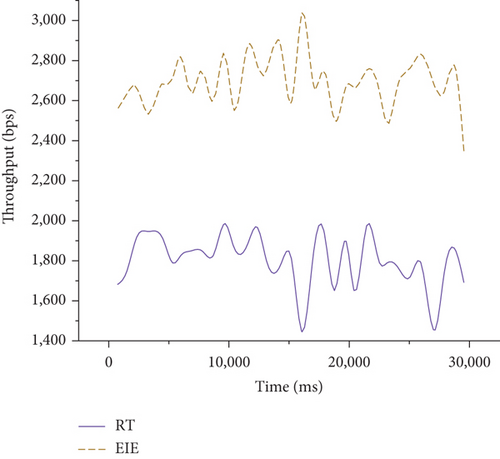
The wireless sensor’s communication throughput without EMI in different environments is similar to Figure 12. The wireless sensor’s communication throughput with EMI is between 1,400 and 2,100, the lowest point is between 15,000 ms and 20,000 ms, and the highest point is near 18,000 ms and 21,000 ms.
To sum up, the experiment statistically studies whether the wireless sensor is disturbed by EMI from three aspects: wireless sensor’s Transmission and Reception (T & R) time, PRR, and communication throughput. The findings show that EMI will more or less prolong the wireless sensor’s signal receiving time under any circumstances. The PRR and communication throughput are reduced.
3.2. SP Performance of the Wireless Sensor
The above experiments study the wireless sensor’s T & R time, PRR, and communication throughput information. Next, it is necessary to check wireless sensors’ SP performance, as drawn in Figure 14.
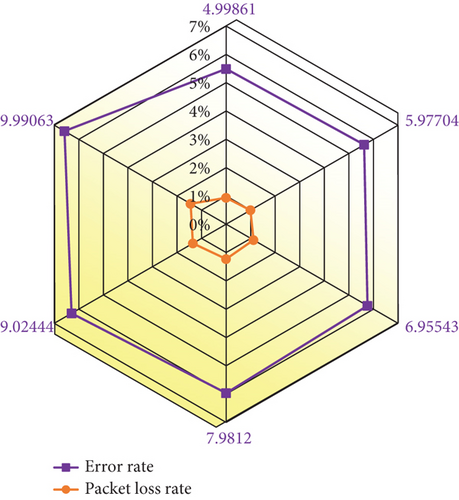
Figure 14 implies that when the transmitting and receiving EMF INT are consistent, there is a linear relationship between the EMF span [denoted by the distance between the signal Transmitter and Receiver of the wireless sensor] and the wireless sensor’s PLR and BER. With the increase of the ENF span, the PLR and BER show a rising trend. When the EMF span is 10 m, the BER is about 6.55%, increasing by about 1%. At this time, the PLR is about 1.72%, increased by about 0.8%. Hence, the difference between PLR and BER is not apparent when the EMF INT is consistent.
Figure 15 plots the relationship between the PLR and BER when the EMF span is 5 m.
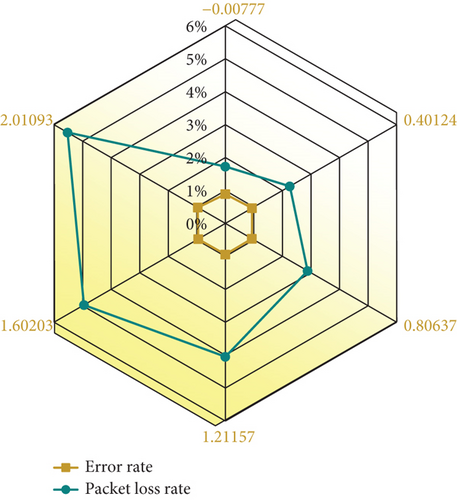
Figure 15 corroborates that when the EMF span of the wireless sensor signal is set to 5 meters, the BER continues to change and shows an upward trend with the increase of the EMF INT at the transmitting end. In contrast, the PLR has been between 0.9% and 1%, and the data change is not obvious. Therefore, the evolution of field INT at the transmitting end of the wireless sensor signal significantly impacts the BER but has little impact on the PLR. The reason may be the influence of wireless sensors’ internal circuits.
The above experimental analysis concludes that EMF will have varying degrees of impact on wireless sensor SP performance to a certain extent. It is necessary to study the anti-EM performance of wireless sensor SP to reduce interference. At present, the physics community agrees to use a high polymer epoxy resin to wrap the signal T & R of the wireless sensor to reduce EMI. The method is simple and easy to handle. Still, due to the characteristics of the wireless sensor itself, there can be no inclusions on the surface when transmitting and receiving signals, so it is still difficult to fundamentally solve the problem of EMI of the wireless sensor. Therefore, it is necessary to study the EMI from multiple angles.
4. Conclusion
With the continuous improvement of social S & T, WST gets ever more close to daily human life, but sometimes, EMI disrupts its normal operations. Accordingly, this paper studies and analyzes the interference of EMF on wireless sensor SP performance using the comparative analysis method and literature method and mainly draws the following conclusions. (i) This paper mainly studies the influence of EMF on wireless sensor information T & R time, PRR, and communication throughput. In the information T & R time, in the same environment, the receiving time is prolonged by about 42,000 ms compared with the wireless sensor not affected by EMI. Under different environments, the interference of EMF will extend the receiving time of wireless sensor information by about 66,000 ms. (ii) In the same environment, the PRR of wireless sensors disturbed by EMF fluctuate between 35% and 81%. The PRR of wireless sensor packets disturbed by EMF fluctuates between 10% ~68% in different environments. (iii) In the same environment, the communication throughput disturbed by EMF is between 1,700 and 2,300. In different environments, the wireless sensor communication throughput affected by EMF is between 1,400 and 2,100. (iv) When the transmitting and receiving field INTs are consistent, there is a linear relationship between the EMF span and the PLR and BER of the wireless sensor signal. Still, the difference between the final PLR and BER is not apparent. When the distance between the transmitter and receiver of the wireless sensor signal is set to 5 m, the change of field INT at the transmitter significantly impacts the BER but has little impact on the PLR. This paper analyzes the SP performance of the wireless sensor in the EMI environment, which provides specific method guidance for the relevant research in this field.
Still, this paper has some limitations in data acquisition, resulting in deviations in data inspection. Additionally, the research on wireless sensor SP performance in the EMI environment has not been discussed regarding economic investment. In the future, the benefit can be evaluated according to the specific situation to reduce the influence of EMF on the wireless sensor SP performance.
Conflicts of Interest
The authors declare that they have no conflicts of interest.
Open Research
Data Availability
The data used to support the findings of this study are included within the article.


