Application of the Slope Coefficient of the Equivalent M–C Criterion in Layered Rock Mass Engineering
Abstract
The slope coefficient ω is defined based on the insufficiency of the area equivalent method, the slope of the equivalent M–C criterion obtained from the instantaneous equivalent, and the optimal first-order approximation to reduce the error between the simulated value and the measured value of the surrounding rock and ensure the safety of the project. Different ω conditions are set to obtain multiple equivalent M–C strength parameter combinations. The above combinations are input to the ubiquitous joint model of FLAC3D, and the surrounding rock strength of layered tunnels with different inclination angles (0°, 30°, 45°, 60°, and 90°) is corrected. The results show that (1) after the tunnel excavation is completed, the displacement of key points (e.g., the vault and waist) increases when the slope coefficient is increased and the deviator stress decreases when the slope coefficient is increased. (2) After the area equivalent method is revised, the displacement and the deviator stress are more significantly affected by the inclination of the rock strata than the uncorrected ones, suggesting that the equivalent area can more effectively highlight the anisotropy characteristics of the layered surrounding rock. (3) After the simulation results of the displacement and the deviator stress at the respective key point are comprehensively modified, the optimal slope coefficient corresponding to each rock layer inclination is obtained, and the area is optimized by ensuring reasonableness to reduce the error between the simulated value and the measured value. (4) The layered surrounding rock at a dip angle of 30° is studied. The development of the plastic zone is promoted when the slope coefficient is increased, and the rock shear failure and the joint shear failure occur simultaneously on both sides of its axis.
1. Introduction
The rock mass strength parameter is a vital factor for the stability of the surrounding rock, the numerical simulation calculation, and the support design of the tunnel [1–4]. The strength of the layered rock mass is lower than that of the intact rock mass due to the existence of weak structural planes. The surrounding rock is usually reinforced by various techniques to ensure the safety of construction [5, 6]. The Mohr–Coulomb (M–C) strength criterion has been the most widely used strength criterion in rock mass engineering thus far, and most numerical simulation software uses the M–C constitutive model for calculation. However, a considerable number of the layered rock mass test data have indicated that the strength characteristics of the layered rock mass are nonlinear, and the rock mass strength is also affected by the dip angle, hydrostatic pressure, and intermediate principal stress [7–11]. Accordingly, it is effective in analyzing the stability of layered surrounding rocks to reasonably apply the rock mass strength parameters to the software model under the three factors.
Strength criterion takes on a critical significance in indicating the failure characteristics of rock mass [12–14]. A simple M–C linear criterion cannot truly characterize the characteristics of rock mass. This disadvantage can be made up for by the Hoek–Brown (H–B) nonlinear criterion. To combine the H–B criterion with finite difference software and achieve the effect of analyzing rock mass failure by using a computer, domestic and foreign scholars have conducted some research on the equivalent strength parameters of the H–B criterion. Hoek [15] suggested that the tangent at any point of the H–B criterion is consistent with the M–C criterion on the σ1 − σ3 plane, and the instantaneous equivalent strength parameters are obtained. Hoek [16] proposed a method of best fitting H–B in a certain σ3 range with the M–C criterion to obtain equivalent strength parameters. Wu Shunchuan [17] proposed a method of instantaneous equivalence between the H–B criterion and M–C in a three-dimensional plane ( plane). However, the above equivalent methods are based on complete rock mass, and the equivalent strength parameters of the layered rock mass have been rarely studied. In the optimal equivalent method proposed by Hoek, the slope of the M–C linear criterion is one of the factors for the equivalent strength results, whereas it does not give a specific reasoning process, so this equivalent method has low feasibility in practical applications.
In numerical simulation calculation of surrounding rock stability, domestic scholars have made a series of attempts and achieved effective results [18, 19]. Guo [20] took Yangjiaping Tunnel of Chengdu–Lanzhou railway as the background and investigated the characteristics of plastic failure after tunnel excavation using FLAC3D finite difference software. They suggested that the tunnel deformation largely occurs in the side wall. Lei [21] simulated the large deformation of the steep layered soft rock in Yangjiaping Tunnel using UDEC discrete element software. They found that the horizontal internal extrusion of the surrounding rock was greater than the settlement of the vault, and the lateral wall was largely damaged by horizontal bending and layer separation. Ma [22] modeled the complex curved surface of the underground powerhouse of a hydropower station in western China and simulated it using finite difference software. They concluded that the deformation and stress of the surrounding rock of the underground powerhouse are small, and the plastic zone has a penetrating trend. As revealed by the above research, we can basically get a more accurate distribution law of stress and strain using finite difference software to study the stability of surrounding rock. Li [23] studied the failure characteristics of the layered surrounding rock by combining the on-site monitoring values and numerical simulation values of Gonghe Tunnel. They suggested that the failure of the layered surrounding rock primarily occurs in the direction perpendicular to the rock stratum, and the measured value of surrounding rock deformation is significantly higher than the simulation value. This is since FLAC3D still considers the damaged rock mass as a continuum in the process of simulating the surrounding rock, resulting in a small simulation result. As far as the ubiquitous joint model is concerned, it still regards the rock mass as isotropic in nature, thus making the rock mass strength inconsistent with the reality and resulting in a big error between the simulation results and the real values.
Thus, the slope formula of the equivalent M–C criterion is summarized according to different equivalence principles [24], and a slope coefficient ω (affecting the effect of correction) is defined so as to further increase the accuracy of numerical simulations. The H–B criterion is made equal to the M–C criterion in the area of the failure surface under different ω conditions, and the corresponding equivalent strength parameters of the layered rock mass are obtained. By drawing inferences from others, the equivalent strength parameters of dip angles of 0, 30, 45, and 60 are calculated and input into the ubiquitous joint model. Subsequently, the original parameters are modified, and the calculated displacement, deviant stress, and plastic zone of surrounding rocks are compared and analyzed. The effect of different slope coefficients on the correction of the rock mass area is studied using the equivalent method, and the optimal slope coefficient is selected according to the difference in the correction effect for the optimal correction combination.
2. Equivalent Strength Formula with Different Slope Coefficients
2.1. Strength Criteria
The above equation is also called the stress invariant form of the M–C criterion and the H–B criterion. The result of the observation suggests that the stress invariant form fully considers the hydrostatic pressure effect and the Lord angle effect, and it is more suitable for rock mass strength analysis under tunnel excavation conditions.
2.2. Slope Coefficient of the Equivalent M–C Criterion
As the H–B criterion is nonlinear, most of the auxiliary calculation software adopts the M–C linear criterion, thus causing its inability to be directly applied. Accordingly, it is considered that the H–B and the M–C criteria should be treated equivalently before the finite difference software calculation. Different equivalent methods are derived according to different equivalent principles, among which, the instantaneous equivalent method, the optimal first-order approximation method, and the best area equivalent method have been widely used. First, the first two equivalent methods are briefly introduced to explore the rules.
2.2.1. Instantaneous Equivalence
Based on the instantaneous equivalent method in the plane, the equivalent strength formula can be obtained if the tangent line at a certain point on the H–B criterion is equal to the M–C criterion passing through that point (Figure 1).

2.2.2. Optimal Approximation
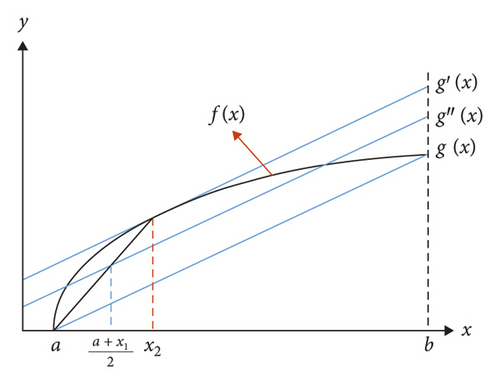
The theory of numerical analysis suggests that the quadratic curve can be equivalent using the optimal first-order approximation method. The principle of the above method is as follows: in the interval of [a,b], there is a quadratic curvef(x), which crosses f(a) and f(b) makes a straight line g(x), crosses the ordinate at a point (0,c), and moves g(x) up and down until it is tangent to the curve. The tangent point is x2, and the parallel line g(x) made by (a + x2/2, 0) is the equivalent straight line g″(x) (Figure 2). As the H–B criterion applicable to the layered rock mass can also be considered as a quadratic curve to a certain extent, this method can be used to perform the best first-order approximation equivalent treatment of the H–B criterion.
2.2.3. Proposing the Slope Coefficient
The equivalent strength expressions of equations (5) and (8) obtained using the above two methods suggest that although they obtain different equivalent cohesive force formulas, the equivalent internal friction angle formulas are the same, with only the difference of coefficients. The reason for the above result is the different principles of the two equivalent methods.
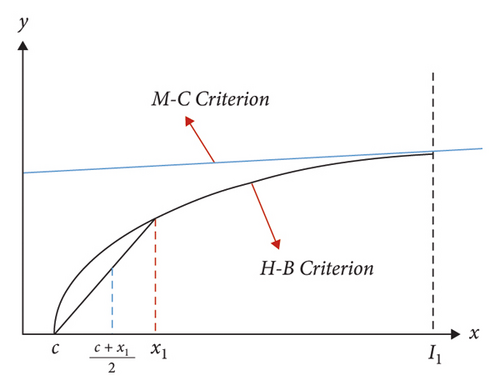
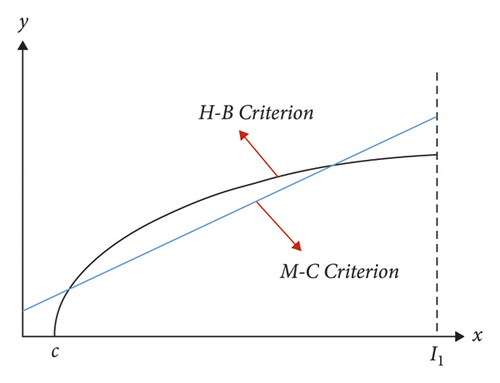
Equation (11) suggests that the φ correction parameter tends to decrease with the increase in ω, which is consistent with the change in the slope shown in Figures 3 and 4.
2.3. Optimization of the Area Equivalent Method
In 2002, Hoek proposed to make the areas covered by the H–B criterion and the M–C criterion equal in a certain minimum principal stress interval to obtain the equivalent M–C parameter. This method has been often used in engineering rock strength estimation [25], field stress evaluation [26], tunnel plastic zone calculation [27], rock foundation bearing capacity [28], etc. Likewise, the H–B criterion can be best fitted in the plane (Figure 5).
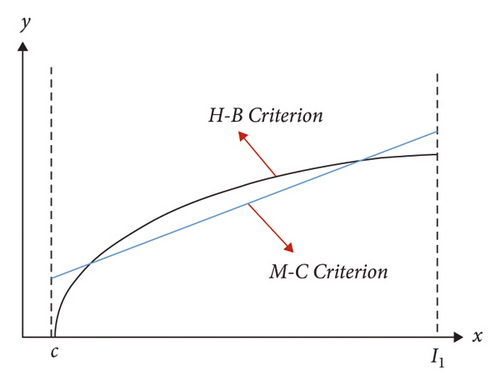
However, the above equivalent method does not give a specific derivation process. The analysis of its principle suggests that when the areas covered by the H–B criterion and the M–C criterion are equal, there may be an infinite number of equivalent M-C criterion straight lines for the same H–B criterion (Figure 6) since the slope of the equivalent M–C criterion has not yet been obtained. In addition, at the time of x = I1, if the ordinate of the equivalent M–C criterion is less than , the equivalent error tends to increase, so the equivalent M–C criterion slope of the crossing point (I1,) becomes the minimum slope value. At the time of y = 0, if the ordinate of the equivalent M–C criterion is higher than , it will also lead to the rapid expansion of the equivalent error. Thus, the equivalent M–C criterion slope of the crossing point (C,0) becomes the maximum slope value. The above analysis reveals that the equivalent M–C criterion with a smaller error and the most reasonable one must exist in the above interval.
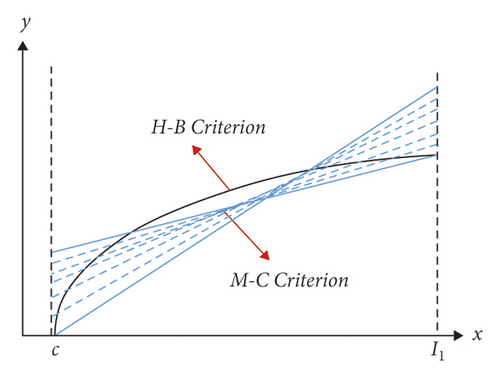
As depicted in the above figure, only when the slope of the equivalent M–C criterion is known, the unique equivalent M–C criterion can be obtained. Subsequently, the unique combination of equivalent strength parameters (c,φ) can be obtained. According to the analysis in Section 2.2.3, equation (11) expresses the equivalent M–C criterion slope formula, and the obtained slope is obtained by ω. Accordingly, if the value of ω is obtained, the equivalent internal friction angle φcan be calculated, so the unique combination of equivalent strength parameters (c,φ) can be calculated by introducing ω into the area equivalent method.
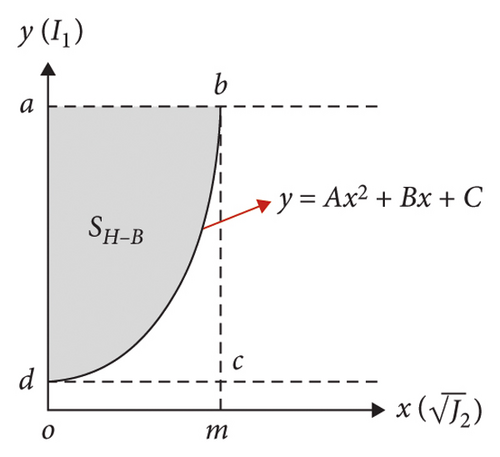
When the rock material is known, because , its value is only related toφ and its value is only related to ω. If its value is obtained, the corresponding equivalent cohesion can be obtained.
3. Case Simulation Preparation
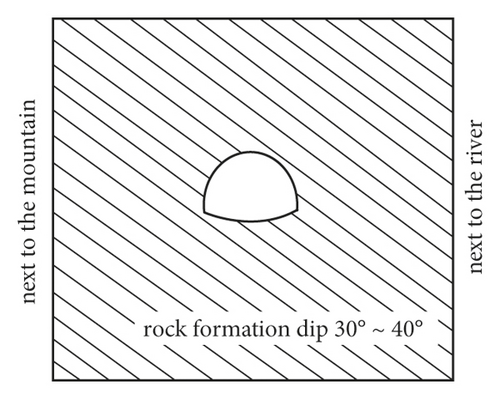
To explore the effect of different slope coefficients on the equivalent M–C criterion c and the φ value, the stability of the layered surrounding rock in the K41 + 567 section of the tunnel is studied based on Gonghe Tunnel of the Chongqing–Sha Expressway. Gonghe Tunnel is a double-hole tunnel with left and right repair, located in Gonghe Township, Pengshui County. The attitude of the tunnel strata is 300°∼325° ∠ 20°∼40°(Figure 8), and the terrain is on the left side of the mountain, and the right side is adjacent to the Wujiang River. Its maximum buried depth is 1000 m, which is a typical deep-buried tunnel.
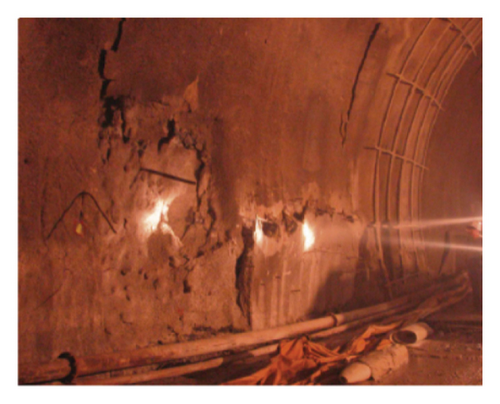
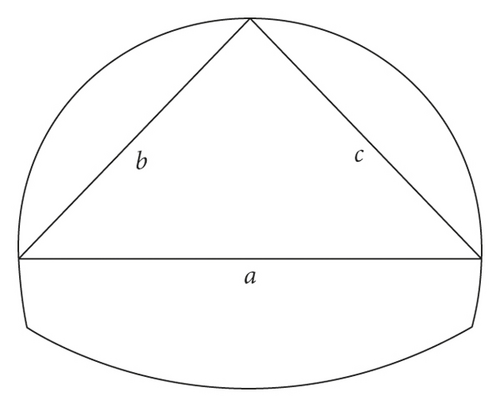
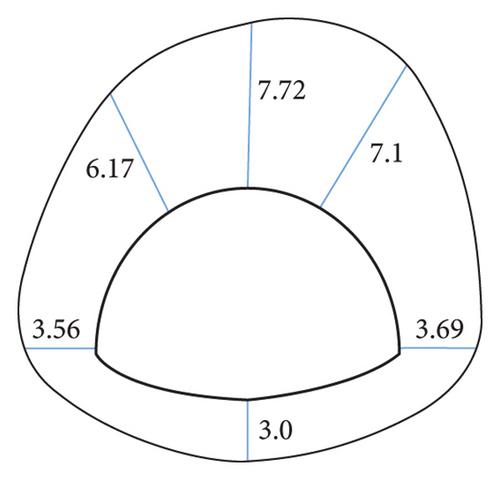
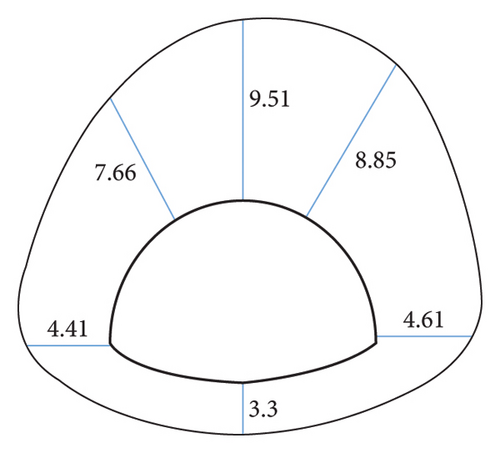
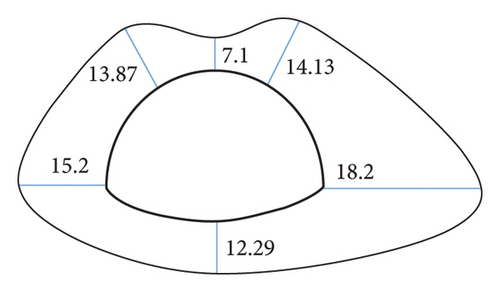
The maximum buried depth of Gonghe Tunnel is from K40 + 430 to K42 + 230. It pertains to Class III surrounding rock, which exhibits good interlayer bonding, flat and smooth joints, numerous closed shapes, no filling or calcium film filling, and the spacing of 1∼2 m. Since K40 + 830, the phenomenon of shotcrete cracking, falling blocks, and arch deformation has appeared in the initial branch of the tunnel from the vault to the right arch shoulder and the left arch foot (Figure 9). To characterize the deformation characteristics of surrounding rocks in time, the measuring points are arranged as presented in Figure 10, and the convergence values of the displacement of different sections are obtained (Table 1).

| Monitoring sections | Line a (mm) | Line b (mm) | Line c (mm) | Vault subsidence value (mm) |
|---|---|---|---|---|
| K41 + 450 | 70.06 | 50.86 | 40.52 | 30.06 |
| K41 + 480 | 134.34 | 115.78 | 81.95 | 72.62 |
| K41 + 500 | 139.20 | 95.21 | 65.18 | 45.71 |
| K41 + 540 | 112.90 | 102.21 | 76.06 | 69.06 |
| K41 + 570 | 107.26 | 93.61 | 66.13 | 59.22 |
3.1. Model Establishment
The buried depth of the K41 + 567 section of Gonghe Tunnel is 700 m, and the initial stress state is σx = −16.33 MPa,σy = −12.28 MPa, σz = −15.69 MPa, τxy = −0.133 MPa, τxz = −1.095 MPa, and τyz = 1.945 MPa. With this as the research object, the slope coefficient ω is an integer of 3∼8, and the H–B equivalent strength parameters are obtained under different ω conditions. The ubiquitous joint model is adopted to modify the strength parameters of the rock strata at the internal dip angles of 0°, 30°, 45°, 60°, and 90°, respectively. Furthermore, the results are simulated before modification.
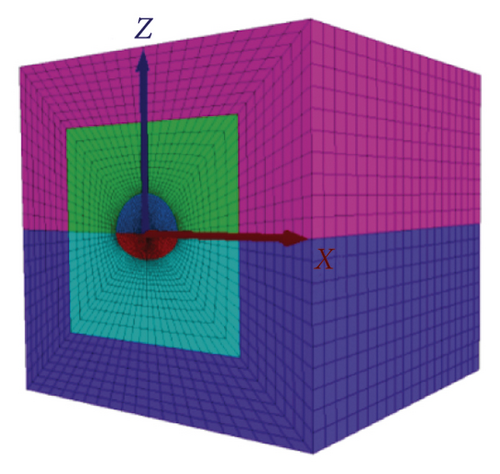
The tunnel model grid is divided as follows (Figure 11), and the model falls within a calculation range of 50 m × 50 m × 50 m. Since the research focuses on the stability characteristics of surrounding rocks of a certain section after tunnel excavation, the full-section excavation is unified, while the excavation form is not considered, and the initial support of shotcrete is conducted after excavation.
3.2. Parameter Calculation
In accordance with the elastic-plastic theory, , and θσ can be obtained by substituting σ1, σ2, σ3 measured when sandy shale is destroyed under triaxial stress. They are substituted into equation (12) to obtain the equivalent internal friction angle under different slope coefficients, and then, they are substituted into equation (22) to further obtain the equivalent cohesion. Table 2 lists the equivalent strength parameters of different strata dip angles under different slope coefficients, and the shear modulus in the simulation process is taken (Table 3).
| Dip angles | ω | 3 | 4 | 5 | 6 | 7 | 8 |
|---|---|---|---|---|---|---|---|
| 0° | c | 2.69 | 2.71 | 2.74 | 2.79 | 2.83 | 2.85 |
| φ | 41.3 | 36.87 | 33.09 | 30.00 | 27.52 | 25.40 | |
| 30° | c | 1.85 | 1.86 | 1.88 | 1.9 | 1.92 | 1.94 |
| φ | 35.20 | 30.33 | 26.74 | 23.89 | 21.65 | 19.76 | |
| 45° | c | 1.94 | 1.95 | 1.97 | 1.994 | 2.01 | 2.04 |
| φ | 37.59 | 32.68 | 29.08 | 26.17 | 23.76 | 21.78 | |
| 60° | c | 2.49 | 2.52 | 2.58 | 2.63 | 2.68 | 2.72 |
| φ | 36.00 | 31.13 | 27.52 | 24.65 | 22.33 | 20.43 | |
| 90° | c | 2.56 | 2.59 | 2.64 | 2.65 | 2.73 | 2.78 |
| φ | 42.84 | 38.17 | 34.10 | 31.33 | 28.68 | 26.55 | |
- Note: the cohesion unit in the table is MPa, and the internal friction angle unit is “°.”
| 0° | 30° | 60° | 90° | |
|---|---|---|---|---|
| G | 5.15 | 6.4 | 8.76 | 9.41 |
Furthermore, the conventional ubiquitous joint model simulation method is adopted for secondary simulation of layered surrounding rocks. In accordance with the test results obtained in reference [4], rock mass parameters and joint parameters are taken as the control c = 1.9MPa, φ = 33.7°, c = 0.1MPa, φ = 30°.
As depicted in Table 2, when the parameters of the layered rock mass are known, the greater the slope coefficient (value of ω), the greater the equivalent cohesion and the smaller the equivalent internal friction angle. Besides, the effect on the equivalent internal friction angle is more significant than that on the equivalent cohesion.
4. Analysis of Case Calculation Results
The H–B criterion is equivalent to the M–C criterion using different equivalent methods, and a unified slope expression is summarized. Subsequently, the slope coefficient ω is defined in accordance with the slope expression, and six groups of different equivalent c, φ combinations are obtained at the same inclination angle by changing the ωvalues. Next, the parameters of layered surrounding rocks are modified and simulated by substituting them into the FLAC3D omnipresent joint model. Lastly, the calculated displacement and stress values of the surrounding rock key points are output, and the effect of ω on the simulation results is investigated.
4.1. Simulation Results of the Displacement of the Respective Key Point
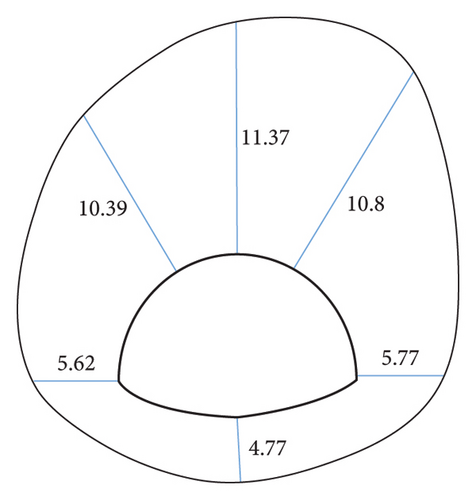
In combination with the engineering overview, the displacement data of a certain section obtained by simulations under the condition of different slope coefficients when the rock stratum dip angle is 30° are taken to achieve a more vivid and close simulation result. Figure 12 (the bottom of the arch in the figure) presents the displacement distribution of a key point. The direction of the displacement is upward, which is the uplift value), and it is compared with the distribution of displacement before correction. The result of the observation suggests that the displacement of the respective key point of the section is asymmetrically distributed, and the overall performance is that the right side is greater than the left side, the upper part is greater than the lower part, and the deformation amount of each position increases as the slope coefficient increases. It shows that taking a greater slope coefficient to correct surrounding rock parameters can effectively increase the deformation and reduce the error with the actual value, whereas the specific value should comprehensively consider the surrounding rock stress.
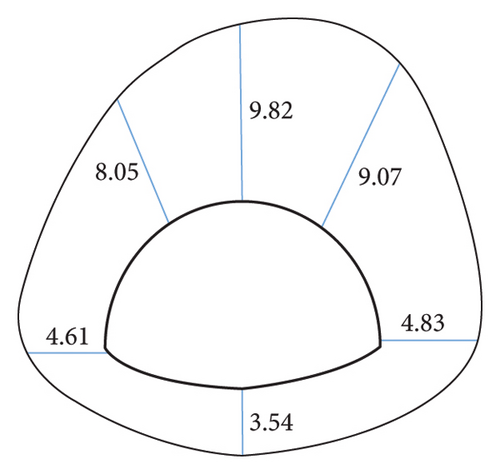
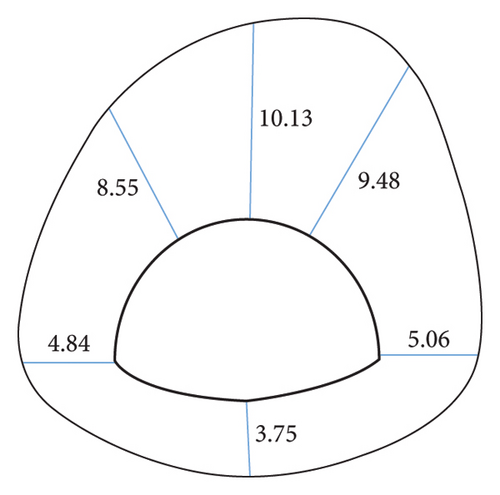
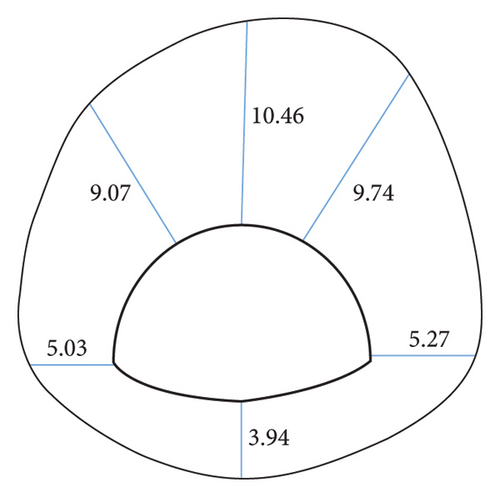
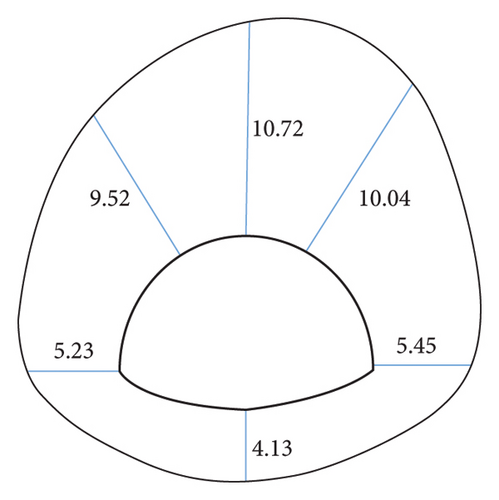
To further investigate the effect of slope coefficients on the simulation results of surrounding rocks with different dip angles and coefficients, the simulation results of key points are made into line charts, as presented in Figures 13(a)∼13(f). As revealed by the observation of Figure 14, the area equivalent method is capable of effectively increasing the simulation value of the displacement at the vault, and the change trend of the displacement with the dip angle after correction is basically the same as that before correction. Taking the vault as an example, the displacement before and after correction tends to decrease with the inclination angle. When the dip angle of the rock stratum is higher than 60°, the correction effect under different ω conditions decreases. This result is achieved since at this time, the rock mass primarily suffers from tensile failure and the rock mass strength is largely dependent on the joint plane. Modifying the rock mass strength parameters by the area equivalent method slightly affects the rock mass damage. Lastly, the displacement obtained by simulations is slightly increased or even lower in some parts than before correction. Even so, taking 30° as an example, the comparison of the precorrection and horizontal convergence values with the field measured values suggests that the precorrection value is 13.27 mm, and the postcorrection values under different ω conditions are obtained 16.41 mm, 17.12 mm, 18.03 mm, 18.81 mm, 19.56 mm, and 21.19 mm, respectively, and the field measured horizontal convergence value is 107.26 mm (the simulated section is K41 + 567, so the data of K41 + 570 are taken as reference, as presented in Table 1). The area equivalent method is capable of increasing the displacement simulation value to a certain extent and reducing the error between the measured value and the simulated value.
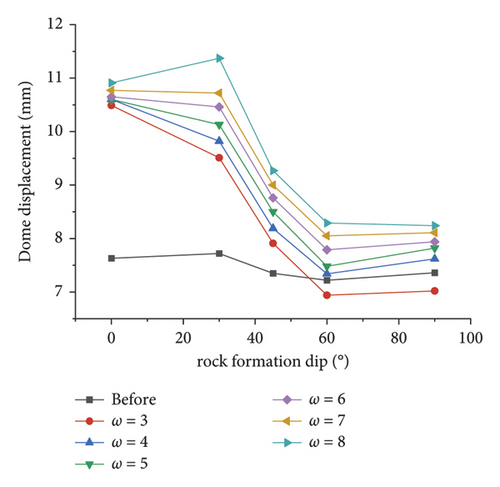
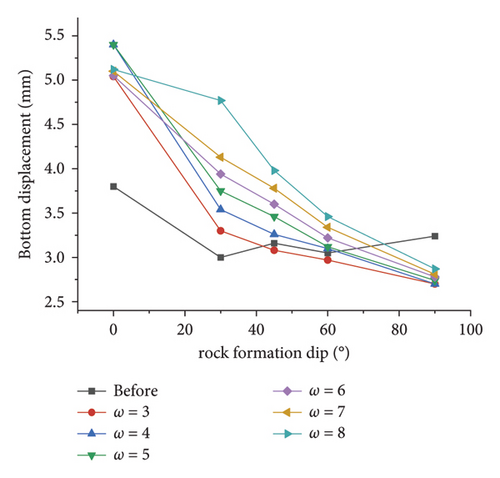
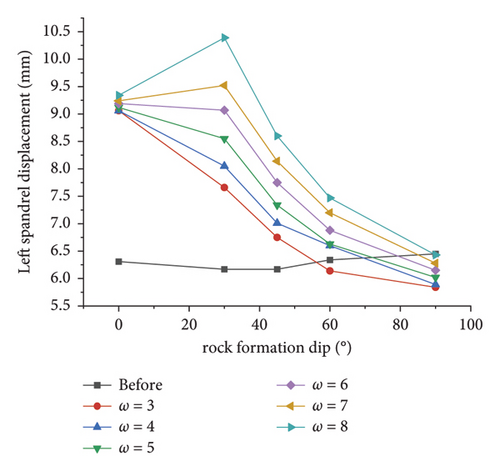
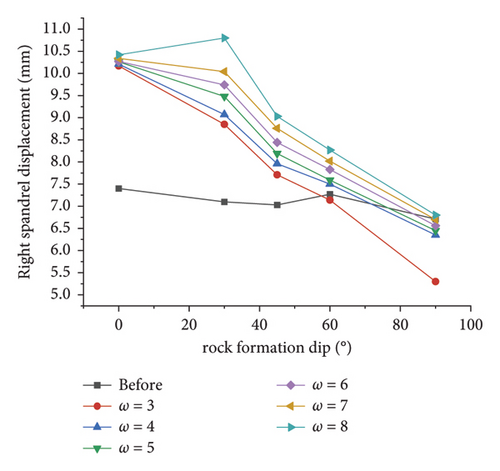
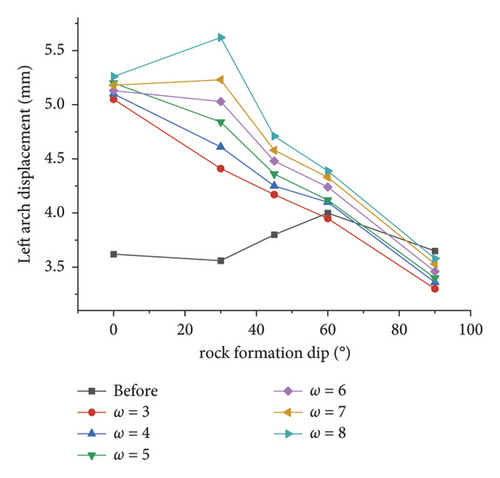
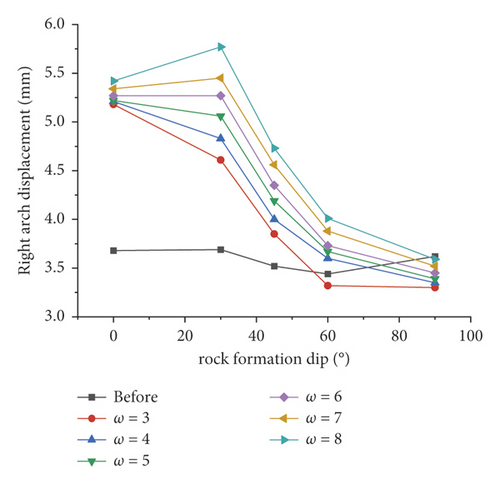
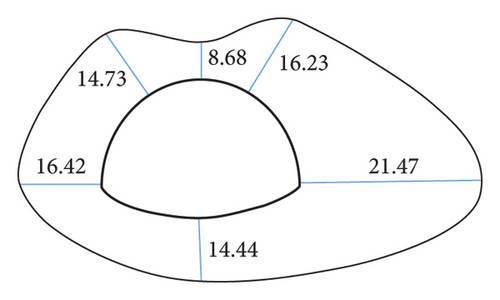
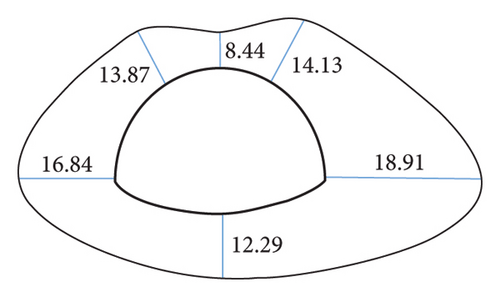
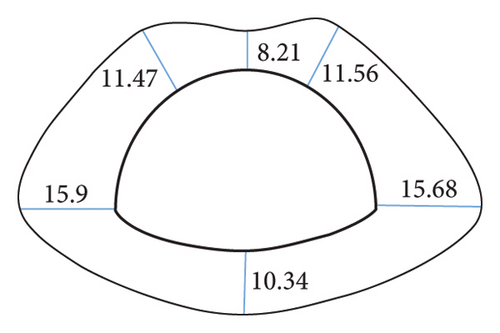
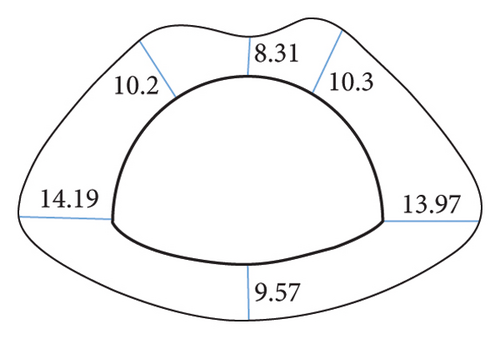
In addition, the comparison of the degree of the effect of the inclination angle on the displacement of the key points before and after the correction suggests that the displacement of the key points before the correction is not significantly affected by the inclination angle, and the fluctuation of the broken line is small. It is therefore indicated that the area equivalent method is more protruding to the anisotropic characteristics of the layered surrounding rock to a certain extent, and the simulation of the stability of the layered surrounding rock is more reasonable. As revealed by the displacement data, regardless of the value of ω, at the inclination angle of 30°, the area equivalent method improves the displacement compared with that before the correction. The greater the value of ω, the better the correction effect. However, for the stability of the surrounding rock, the surrounding rock stress is the key to the deformation, and it is insufficient to judge the correction method only by the displacement, so the surrounding rock stress should be analyzed.
4.2. Simulation Results of the Deviatoric Stress at Key Points
Figure 14 illustrates the distribution of the deviatoric stress at key points of tunnel sections at an inclination angle of 30. As depicted in this figure, when a smaller ω value is taken, the deviatoric stress at each point after correction by the area equivalent method is greater than that before correction, and the deviatoric stress at the right arch shoulder and right arch foot is greater. When ω> 4, the deviatoric stress decreases rapidly after the correction. Since the deviatoric stress is a factor for the subsequent deformation of surrounding rocks, the right arch foot is more likely to be damaged and deformed.
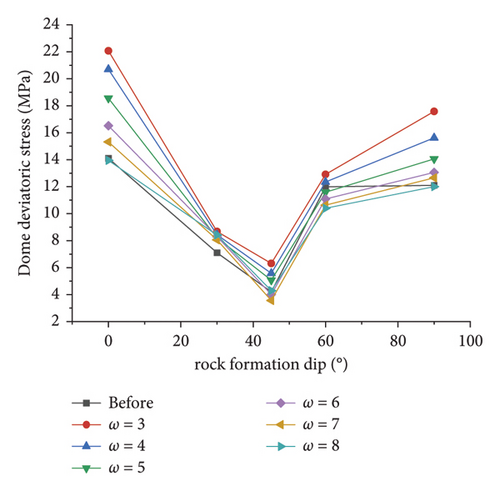
The deviant stress of the respective key point of tunnel sections is obtained by modifying the strength parameters of rock masses at different inclinations, as presented in Figure 15. As the deviator stress is a vital factor for the subsequent deformation of surrounding rocks, the greater the deviator stress, the greater the possibility of subsequent deformation. This finding reveals no matter whether it is corrected or not, the deviatoric stress of the vault reaches the minimum value at a dip angle of 45 and the maximum value at a dip angle of 90. The simulated value of the deviatoric stress at the vault shows a trend of first decreasing and then increasing with the dip angle of the rock stratum, that is, a U-shaped change. The simulated value of the eccentric stress of the revised vault is basically greater after the revision than before the revision, suggesting that the possibility of subsequent deformation of the surrounding rock is greater after the revision. Using this simulation result to guide the tunnel construction can effectively ensure its safety. However, unlike the simulation value of the displacement, the simulation value of the deviatoric stress decreases as ω increases; at the time of ω > 4, the correction effect decreases rapidly, suggesting that the area equivalent method is no longer applicable to increase the safety of the project.
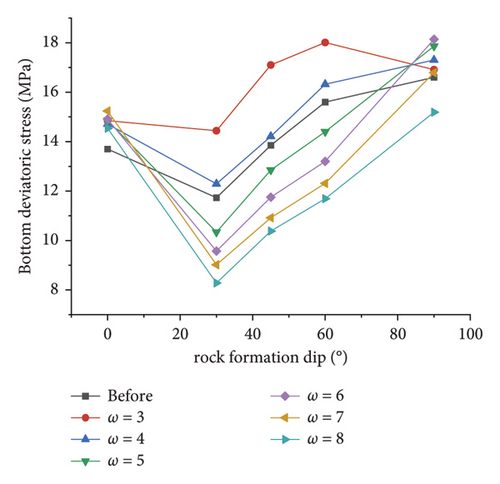
As depicted in Figure 15(b), consistent with that before the correction, the deviatoric stress at the bottom of the arch after the correction first decreases and then increases with the increase in the dip angle of the rock formation. At an inclination angle of 0°, the simulated values of the deviatoric stress are greater after different ω corrections than before the correction, but with the increase in the inclination angle, the correction effect is obviously different. The simulated value of the deviatoric stress of the surrounding rock can be increased, and the method fails under other slope coefficients.
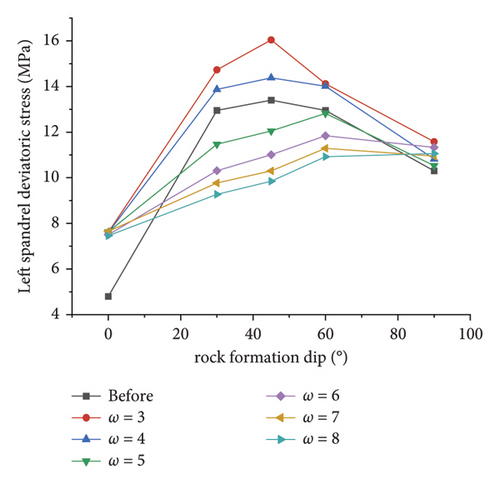
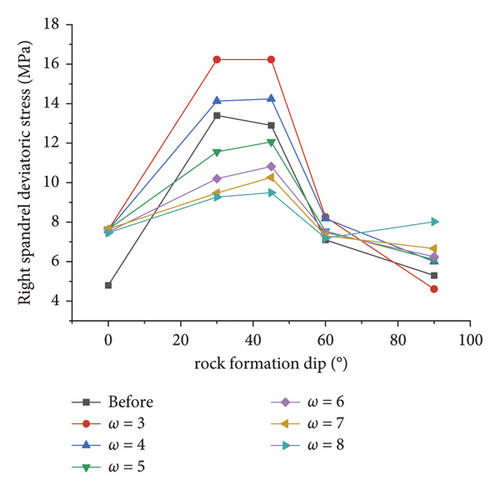
Figures 15(c) and 15(d) illustrate the variation law of the simulated deviatoric stress with the inclination angle under different ω at the left and right spandrels, respectively. As depicted in these figures, since the left and right spandrels are located at the symmetrical positions of the tunnel section, the line graphs of the deviatoric stress with the inclination angle are also similar, both of which are arch-shaped and significantly affected by the inclination angle. Compared with before the correction, the deviatoric stress after the correction by the area equivalent method is more affected by the dip angle and is consistent with the simulation value of the displacement, which further reveals that the method highlights the anisotropy of the layered rock mass.
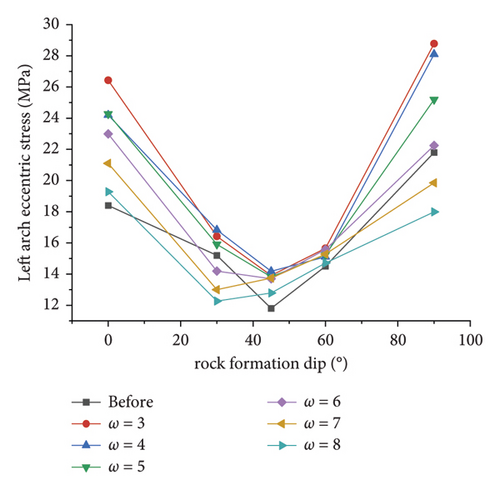
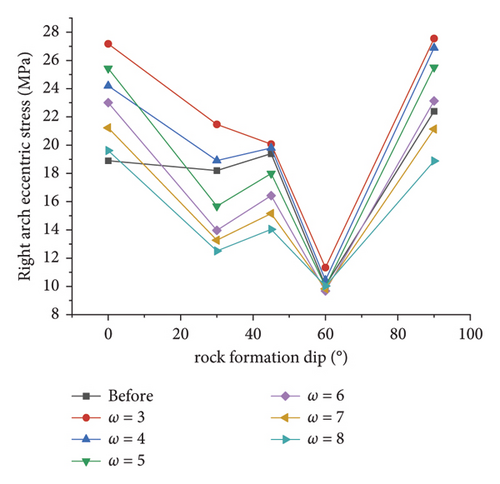
Figures 15(e) and 15(f) illustrate the variation law of the simulated deviator stress at different ω with the inclination angle at the left and right arches, respectively. As depicted in the figures, similar to the spandrel, the simulated value of the deviatoric stress at the arch foot is more affected by the inclination angle after the correction than before the correction. Furthermore, the deviatoric stress of the left and right arches reaches the maximum value at an inclination angle of 0° and 90°, thus suggesting that the subsequent deformation is more likely at this time.
The broken line chart of the respective key point in Figure 15 indicates that when the dip angle of the rock formation is a certain value, the greater the ω, the smaller the deviatoric stress simulation value. When ω is higher than a certain value, the corrected deviatoric stress simulation value at the key point is lower than before; i.e., the area equivalent method cannot increase engineering reliability. It is further explained that the applicability of the correction method is closely related to the value of ω. Only by obtaining a suitable value of ω, the simulated value of the displacement and deviatoric stress after correction can be greater than those before correction, and then, the optimal correction effect can be achieved.
4.3. The Simulation of Surrounding Rocks at Different Dip Angles is Optimal
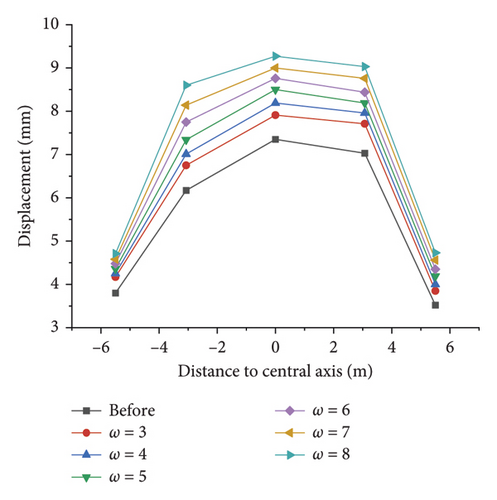
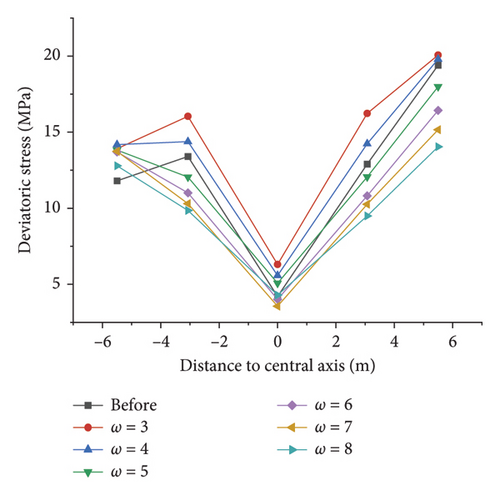
Based on the above data of the displacement and deviatoric stress, a new line chart (Figure 16) is drawn at the distance from the respective key point to the axis as the abscissa and the displacement (absolute value) and the deviatoric stress as the ordinate. The correction effect of the dip angle of each rock stratum is investigated, and the optimal equivalent M–C slope coefficient is selected to obtain the optimal strength parameter combination and discuss the optimal application of the area equivalent method.
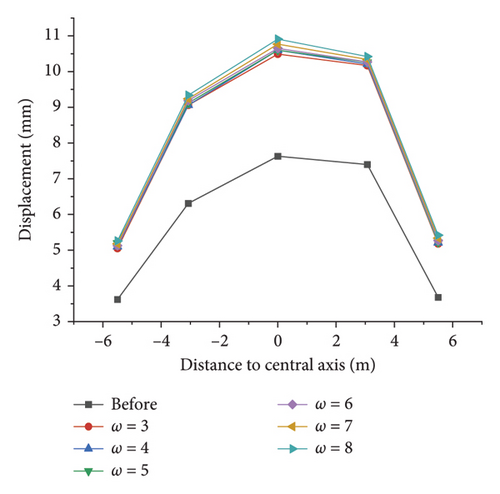
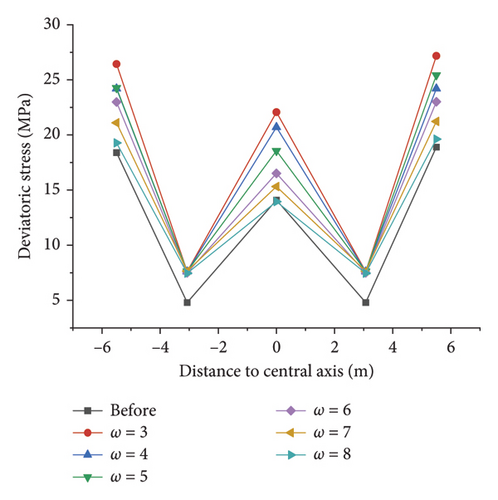
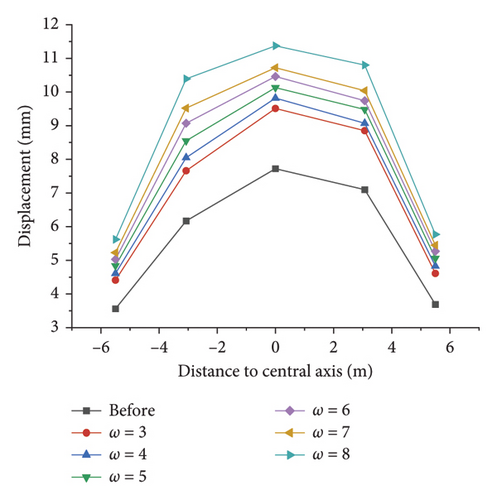
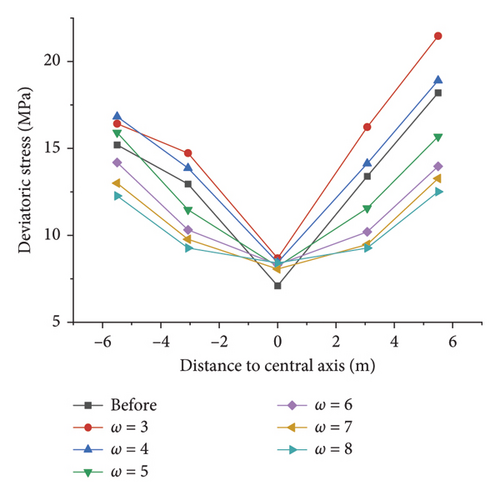
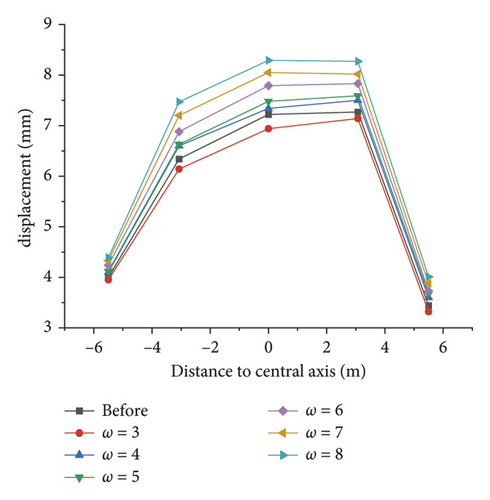
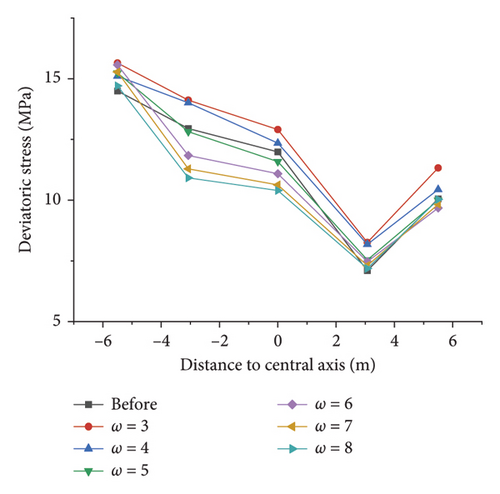
As depicted in Figures 16(a) and 16(b), regardless of the value of ω, the simulation results of the displacement of the respective key point are greater than those before the correction at an inclination angle of 0°, suggesting that this method is feasible to reduce the error between the simulated value and the measured value. After the excavation, the area equivalent method can increase the deviatoric stress simulation value of the respective key point of the tunnel to ensure the safety of construction. Based on the above simulation results, considering the displacement error and construction safety, the equivalent strength parameter when ω=4 can be considered the best correction combination, and its correction effect is better than others. Thus, the equivalent cohesion force is 2.71 MPa, and the internal friction angle is 36.87°.
The observation of Figures 16(c) and 16(d) reveals that similar to a dip angle of 0°, regardless of the value of ω, the area equivalent method can improve the displacement of the key points of the surrounding rock, and with the increase in ω, the improvement effect is better. The area equivalent method under the condition of different slope coefficients has different improvement effects on the deviatoric stress simulation value of the respective key point. When ω = 3 and ω = 4, the deviatoric stress after the correction is greater than before the correction, which is beneficial to construction safety guidance. It can be considered that the equivalent strength parameter of the rock mass when ω = 4 is the optimal modified combination. Thus, the equivalent cohesion force is 1.86 MPa, and the internal friction angle is 30.33°.
As depicted in Figures 16(e) and 16(f), the simulation results of the displacement after the correction are basically greater than those before the correction, and under the same slope coefficient, the improvement of the left spandrel and the right arch foot is the largest and the improvement of the arch bottom is the smallest; when ω = 3 and ω = 4, the analog value is greater after the correction than before the correction, which contributes to engineering safety assurance. Thus, ω = 4 is also taken as the optimal correction combination of the area equivalent method. At this time, the equivalent cohesion force can be taken 1.95 MPa, and the internal friction angle can be taken 32.68°.
Likewise, as depicted in Figures 16(g) and 16(h), based on the analysis of the displacement and deviatoric stress values of the respective key point before and after the correction when the dip angle of the rock formation is 60°, ω = 4 is considered to be the optimal slope of the area equivalent correction method. The equivalent rock mass strength parameters obtained under this coefficient are the optimal equivalent combination, i.e., c = 2.52, φ = 31.13.
In brief, when the optimized area equivalent method is adopted to modify rock mass parameters, the simulation results are significantly affected by the slope coefficient. Thus, the slope coefficient ω should be taken 4 and substituted into the formula for calculation. Taking 30° as an example, comparing the before correction and the horizontal convergence value with the field measured value, it is found that the horizontal convergence before the correction is 13.27 mm; when ω = 4, the corrected horizontal convergence value of the area equivalent method is 18.03 mm, while the field measured horizontal convergence of the modified area equivalent method is 107.26 mm. The above result suggests that the modified method can effectively reduce the error (the simulated section is K41 + 567, so the data of K41 + 570 are taken as a reference, as shown in Table 1).
4.4. Plastic Zone of Surrounding Rocks
To analyze the effect of ω on the surrounding rock of Gonghe Tunnel more intuitively, taking the inclination angle of 30° as an example, the different equivalent strength combinations corresponding to the slope coefficients are used to simulate the tunnel excavation, and a certain plastic zone is taken and filled in Table 4. In the purple area, the rock mass and joints have shear failure simultaneously. In the green area, only the rock mass has shear failure and tension failure. In the blue area, the rock mass has shear failure, and the joints have tension failure.
| Plastic zone of surrounding rocks at a dip angle of 30° | |
|---|---|
| Before |  |
| ω = 3 |  |
| ω = 4 |  |
| ω = 5 |  |
| ω = 6 |  |
| ω = 7 |  |
| ω = 8 |  |
As depicted in Table 4, the plastic zone of the surrounding rock before the correction develops after the normal direction of the joint plane. Taking the normal direction as the axis, the rock shear failure and the joint shear failure coexist on both sides of the axis. Only the rock shear failure occurs at the boundary of the section far from the axis. The plastic zone under different ω conditions is identified after the area equivalent method is adopted to correct the rock mass strength parameters. When ω = 3, the plastic zone of the surrounding rock is slightly smaller than that before the correction. With the increase in ω, the plastic zone area decreases. The plastic zone area tends to increase till ω = 8 when it the maximum. From the perspective of failure characteristics, the higher the ω is, the more deep rock shear failure will occur in the surrounding rock and the joint shear failure of rock and joints will decrease slightly. Moreover, with the increase in ω, the axis of the plastic zone of the surrounding rock gradually blurs. When ω > 6, the axis disappears; i.e., the dip angle of the plastic zone disappears. Accordingly, combined with the failure characteristics of the layered rock mass, it is further proved that the equivalent strength parameter of the rock mass, when ω = 4, is the optimal modified combination at a dip angle of 30°.
4.5. Comparison of Three Equivalent Methods
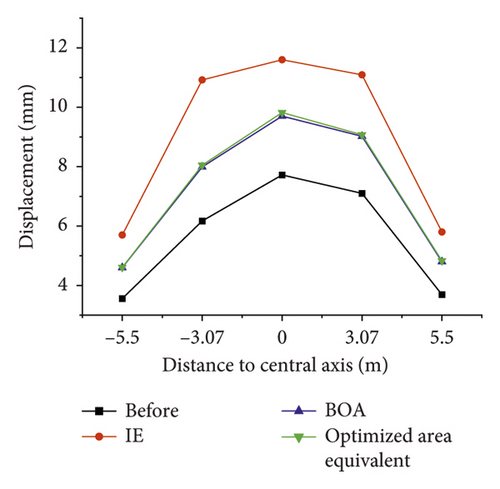
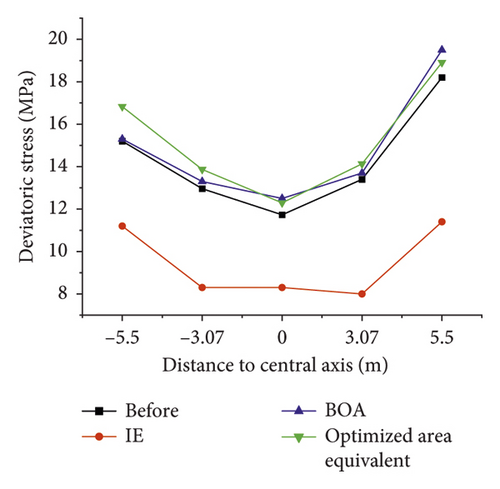
Based on the simulation results when the inclination angle of the rock formation is 30°, the optimized area equivalent method is compared with the instantaneous equivalent and the best first approximation mentioned above, and the effect of the three equivalent methods in reducing the error is studied. The displacement and deviatoric stress values at each key point are drawn as a broken line diagram as follows (the equivalent strength parameters of the rock mass are obtained using the area equivalent method).
The results of the displacement and deviatoric stress at each key point under the conditions of different equivalent methods are shown in Figure 17. These results show that in terms of the displacement, the IE equivalent method has the best performance, the displacement is improved the most compared with that before the correction, and the BOA method and the area equivalent method have the same correction effect. In terms of the deviatoric stress, the IE method has poor performance, and its deviatoric stress is smaller than that before the correction. Thus, the IE method has poor performance in predicting subsequent projects. Although the results of the BOA method and the area equivalent method are close, the area equivalent method is generally better. The above analysis suggests that the area equivalent method is the best equivalent method.
5. Conclusions
- (1)
After the correction, the simulated value of the displacement at the key points of the surrounding rock is higher than that before the correction, whereas the correction effect also changes with the change in the dip angle of the rock formation. At an inclination angle of higher than 60°, the correction effect of the area equivalent method tends to decrease till it disappears at 90°. The above result may be correlated with the failure characteristics of surrounding rocks at a dip angle of 90°. As ω is increased, the displacement of the key points obtained through the simulation is also increased and reaches the maximum value when ω = 8. In addition, the displacement of the respective key point after the correction is more affected by the dip angle than before the correction, and the anisotropic characteristics of the layered rock mass are more prominent, suggesting that the area equivalent method after the introduction of the slope coefficient is effective.
- (2)
The simulated value of the deviatoric stress at the respective key point of the surrounding rock is greater than that before correction, whereas it is also affected by ω. As ω is increased, the correction effect tends to decrease, and the simulated value of the deviatoric stress is gradually lower than that before correction. At this time, subsequent deformation is not ensured. Similar to the displacement, the deviatoric stress value after the correction is more affected by the dip angle of the rock formation than before the correction.
- (3)
The displacements and deviatoric stress values at different distances from the section axis under different rock formation dips are analyzed. Based on the displacement results of key points, the analysis result suggests that it is concluded that the optimal ω for the respective dip is 4, and it is the equivalent strength at this time. The parameter combination is the optimal equivalent combination, which can maximize the correction effect of the area equivalent method to a certain extent.
- (4)
Taking the plastic zone of a section of Gonghe Tunnel at an inclination angle of 30° as an example, it is suggested that rock shear failure and joint shear failure mainly occur on both sides of the plastic zone axis, while rock failure usually occurs only farther away from the axis. In addition, with the increase in ω, the area of the plastic zone is increased, and its axis gradually blurs till it disappears. This finding suggests that when ω is too large, the correction method can no longer effectively indicate the failure characteristics of the layered surrounding rock, which further confirms that the method should be used under suitable ω conditions.
Conflicts of Interest
The authors declare that they have no conflicts of interest.
Acknowledgments
This research was supported by the National Natural Science Foundation of China [Grant No. 51979100].
Open Research
Data Availability
Some of the experimental test data used to support the findings of this study are included within the article. The other data used to support the findings of this study are available from the corresponding author upon request.


