Coverage Blind Area Repair Based on Perceived Multimedia Data Driven in Mobile Wireless Sensor Networks
Abstract
Wireless sensor networks deploy a large number of wireless sensor nodes in the monitoring area to complete the target monitoring task. The coverage effect is an important index to evaluate wireless sensor networks. The effect of network coverage is realized by the wireless sensor nodes deployed in the monitoring area, because the reasonable deployment of sensor nodes can affect the accuracy, reliability, real time, and integrity of monitoring target data collection. The main purpose of network coverage is to use the least number of wireless sensor nodes to complete the monitoring task of targets in the monitoring area and to avoid the emergence of coverage blind areas. Random node deployment, electronic equipment failure, software error, fire spread, flood, and other phenomena may lead to large-scale failure of wireless sensor nodes. For the failure of some nodes, the phenomenon of coverage blind area appears in the network. In order to repair the coverage blind area in the network, a coverage blind area repair algorithm for wireless sensor networks is proposed in this article. The coverage blind area attracts the nodes, makes the nodes move, and repairs the coverage blind area in the network.
1. Introduction
With the rapid development of science and technology, there are micro devices with sensing and wireless communication functions, which are called wireless sensors [1]. Wireless sensors are usually deployed in harsh environments such as high temperature, cold, high humidity, volcanos, desert, swamp, forest, deep sea, and battlefields [2]. Ordinary nodes collect the data around them, and the sink node sends the data in the network to the remote server [3]. Users can query the information they need on the server. For example, they can monitor the enemy's movements on the battlefield, monitor the leakage of chemical substances around the chemical plant, and monitor the occurrence of fire in the forest [4]. The limited resources of wireless sensor nodes hinder the development and application of wireless sensor networks [5]. A large number of scholars have conducted a lot of research on these problems and put forward a variety of solutions, which have been further developed in the use of wireless sensor networks and are more widely used in various application fields [1–3].
Wireless sensor nodes can sense specific environmental phenomena, monitor specific physical phenomena, and collect various data sent by monitoring targets [6]. Wireless sensor networks were initially used in large-scale military systems [7]. After the deployment, the nodes form a network automatically [8]. There is no need to deploy any fixed equipment in advance [9]. It has many characteristics, such as simple structure, fast networking, and strong survivability [10]. Wireless sensor nodes can cover the targets in the monitoring area and collect various physical data related to the targets [11]. These nodes collect various types of physical data sent by the targets in the monitoring area and convert these data into electronic signals [12]. In order to achieve the desired effect in the process of target monitoring in wireless sensor networks, each target point in the monitoring area needs to be monitored by at least one sensor node, so that the physical data generated by each target can be collected [13].
Now, the research hotspots for wireless sensor networks mainly include node management, energy-saving optimization, node positioning, coverage optimization, and time synchronization. How to optimize various parameters of the whole network, improve the network coverage, and reduce the energy consumption of nodes has become very important [14].
Wireless sensor network coverage is to complete the target monitoring task by deploying a large number of wireless sensor nodes in the monitoring area [15]. The coverage effect is an important index to evaluate wireless sensor networks [16]. The effect of network coverage is realized by the wireless sensor nodes deployed in the monitoring area, because the reasonable deployment of sensor nodes is related to the accuracy, reliability, real time, and integrity of monitoring target data collection [17]. The main purpose of network coverage is to use the least number of wireless sensor nodes to complete the monitoring task of targets in the monitoring area, and to avoid the emergence of coverage blind areas [18].
The purpose of node deployment is to make the node as close to the monitoring target as possible, so that the distance between the node and the monitoring target is less than the maximum effective perceived distance of the node [19]. At this time, the target is within the sensing range of the node, and the node can complete the data collection of the monitoring target [20]. An effective node deployment algorithm can reasonably adjust the location of nodes to avoid the situation that nodes are too dense and nodes are too sparse [21]. When one or some nodes cannot work normally due to energy depletion or other reasons, a reasonable node deployment algorithm can adjust the position of normal working nodes [22].
The coverage algorithm is used to complete the data acquisition of monitoring targets by adjusting the position of wireless sensor nodes in the monitoring area. The evaluation indexes of network coverage effect mainly include the following points.
1.1. Number of Nodes Used
Wireless sensor nodes have small volume, a simple structure, and low cost. Whether the number of nodes can be reduced as much as possible when completing the minimum demand of monitoring tasks is a research direction of wireless sensor networks.
1.2. Network Coverage Effect
The network coverage effect is expressed through the network coverage rate, which is a ratio.
1.3. Algorithm Complexity
More and more algorithms consider more use effects and ignore the consideration of algorithm complexity. Therefore, it is necessary to design algorithms with low power consumption and low complexity, which can optimize the calculation process of nodes.
Aiming at solving the problem of coverage blind area caused by the failure of some nodes in wireless sensor networks, a network coverage blind area repair algorithm based on the perceived environment around nodes is proposed in this article. According to the perceived environment around the nodes in the monitoring area, the algorithm finds the small grids that are not monitored by the sensor nodes. It is assumed that these small grids generate gravity on the nodes, make the nodes move to the coverage blind area, and complete the repair of the coverage blind area. In the process of node movement, taking into account the energy consumption of nodes, we reduce the moving distance of nodes with less residual energy and avoid failure due to node energy depletion. Simulation results show that the proposed network coverage blind area repair algorithm based on the perceived environment around nodes can quickly and effectively improve the network coverage and reduce the energy consumption of nodes.
- (1)
The research background is introduced in Section 1
- (2)
The existing related work is analyzed in Section 2
- (3)
This article algorithm is described in Section 3
- (4)
The calculation process is presented in Section 4
- (5)
The node movement is provided in Section 5
- (6)
The simulation analysis is given in Section 6
- (7)
This article is summarized in Section 7
2. Related Work
After the coverage blind area is found, in order to reduce the energy consumption in the network and improve the network service effect, coverage blind area repair is an important task [23].
Das Smita proposed an improved coverage blind area repair method based on the concept of tree center. Coverage blind area detection based on triangle and circle characteristics is the premise of coverage blind area repair. Using the nature of the circle, the area of the blind area is estimated. The coverage blind area boundary is determined, a subtree is constructed, and the coverage blind area is repaired by deploying additional wireless sensor nodes. In order to accurately repair the coverage blind area, the coverage blind area is represented by a tree. Based on the nodes of the tree, the coverage blind area boundary is established, and different subtrees are constructed from the main tree. The coverage blind area is divided into several parts to obtain the optimal coverage blind area repair method [24].
Hao et al. proposed a coverage blind area repair algorithm for a 3D stereo monitoring area. The algorithm meshed the 3D stereo monitoring area and found the coverage blind area in the grid. The wireless sensor nodes around the coverage blind area are found, and the virtual force is used to adjust the position of the wireless sensor nodes to repair the coverage blind area [25].
Robinson et al. proposed a coverage blind area detection algorithm based on fuzzy theory. The algorithm can find the coverage blind areas in the network and has a good detection effect on the coverage blind areas in the monitoring areas of wireless sensor networks with different parameters [26].
Wu et al. proposed an unobstructed coverage scheme according to the geometric relationship between the directional sensor and the target, which automatically generates the sensor azimuth set with the largest coverage gain. They quantitatively measure the size of network coverage blind area and define effective directional coverage. The effective coverage problem is transformed into a constrained optimization problem, and the hierarchical collaborative optimization method is used to maximize the effective network coverage [27].
Aiming at solving the problems of long detection time, low precision, and high operation cost of traditional coverage blind area detection methods, Wang Feifei proposed a multifactor coverage blind area detection method based on LEACH algorithm. This method introduces node intrusion optimization factor and multipath transmission optimization factor. It interferes with the real data of a large number of malicious nodes, optimizes the detection method of coverage vulnerabilities, and improves the stability of network connectivity. Based on the analysis of the QoS architecture of wireless sensor networks, the representative network layer symmetric protocols are studied. According to the gateway performance parameters and gateway selection criterion function, a symmetric network model is established, and a symmetric criterion design and optimization strategy are given. The simulation results show that this method has the advantages of short detection time, high detection accuracy, and low operation cost [28].
Singh Parmod proposed a coverage blind area detection method to identify the coverage blind areas in the network. This method can effectively identify the closed coverage blind areas and open coverage blind areas in the monitoring area. In order to improve the service quality of sensor networks, it is also necessary to repair the network coverage blind area. Singh Parmod et al. proposed a network coverage blind area repair method. This method improves the coverage effect of the network by minimizing the overlap in the network coverage area and using the least number of sensor nodes. The sensor coverage blind area identification method can also identify the boundary of the sensor network. The simulation results show that the proposed coverage blind area identification method and coverage blind area repair method have good application effects in identifying and repairing network coverage blind areas, respectively [29].
Tarnaris Konstantinos designed two artificial intelligence algorithms to optimize the coverage of monitoring area and K coverage of monitoring area. The genetic algorithm and particle swarm optimization algorithm are analyzed and compared in different cases. In order to maximize the coverage effect of the monitoring area, it is necessary to disperse the wireless sensor nodes around the monitoring target to avoid the blind area of network coverage [30].
Using the game theory of learning algorithm, Hajjej Faten proposed a hybrid coverage blind area repair method for wireless sensor networks based on perceptual power control and node relocation. By learning the method of game theory, the distributed repair covering blind area is realized. For the coverage blind area, the sensor network can use only the existing nodes to repair it. In order to reduce the coverage gap, each sensor node selects the joint action of redeployment and sensing range adjustment. Simulation results show that, different from the previous methods, this method can maintain the full coverage of the network in the case of random node failure [31].
The coverage blind area detection algorithm is an iterative process composed of two parts. One is coverage blind area detection, and the other is coverage reduction. In the coverage blind area detection part, the boundary of the coverage blind area is found. In the coverage reduction part, some redundant nodes are set to sleep to reduce the coverage of the target area. The simulation results show that the algorithm can accurately detect more than 95% of the coverage blind areas [32].
Jain Jay Kumar proposed a blind spot detection and repair algorithm for routing and coverage based on dynamic clustering. K-means clustering method is used for clustering, and then cluster head (CH) is selected according to many important constraints of the network to improve the network lifetime and reduce energy consumption. Compared with hybrid network coverage blind area detection and blind area repair algorithms, this method has better accuracy [33].
Zaineldin et al. proposed a dynamic node deployment technology, which uses fewer nodes to obtain better coverage effect and reduce the coverage duplication area between adjacent nodes. Compared with the existing algorithms, this algorithm has a better application effect [34].
The wireless sensor node monitors the relevant environmental changes near it, and any detected events are sent to the sink node for further analysis. Due to the random initial deployment of sensor nodes, the coverage blind area can be repaired by using one or more movable sensor nodes. The coverage blind area may be scattered in the whole monitoring area, so an effective node mobility scheme is very important to maximize the coverage of the monitoring area in the shortest time [35].
Zhang et al. proposed a network coverage blind area repair algorithm, which defines the fault node, coverage vulnerability, coverage matrix, key location, and auxiliary node. Simulation results show that the algorithm is more effective than similar algorithms. While maintaining high network coverage and low network energy consumption, the algorithm can repair the coverage blind area in the network more effectively [36].
Farahzadi et al. proposed a two-stage algorithm to solve the coverage optimization problem. In the first stage of the algorithm, the working direction and angle of nodes are gradually adjusted. In the second stage of the algorithm, an adaptive differential evolution algorithm guided by virtual force is proposed [37].
In order to avoid the expansion of the coverage blind area, Koriem S. M. proposed an algorithm for detecting and calculating the coverage blind area in the monitoring area after the random distribution of wireless sensor nodes. The algorithm is developed to realize the quality of service. It can accurately detect and calculate the coverage blind area in wireless sensor networks, which is helpful to track the movement of people, animals, and vehicles and to find other phenomena such as fire spread or flooding [38].
Zhu Yaoming proposed a blind area repair model for underwater monitoring coverage under various constraints. A multiagent event coverage hole repair (MECHR) algorithm combining multiagent strategy and diversity archiving strategy is used to repair the blind area of underwater monitoring coverage. The algorithm completes the subtasks symmetrically through information exchange and interactive operation with other agents. Different from the existing repair strategies, MECHR algorithm can effectively repair a large number of blind areas of underwater monitoring coverage caused by changes in underwater monitoring scenes and requirements. The algorithm can adapt to a variety of harsh scenes and multiconstraint 3D underwater environment. The effect of MECHR algorithm is verified by underwater repair simulation experiment. The algorithm can adapt to the changing three-dimensional underwater monitoring environment [39].
Zhang et al. classify wireless sensor nodes and sleep redundant nodes by finding redundant nodes and reasonably simplify the rips algorithm. Compared with the existing coverage blind area repair algorithms, this algorithm has lower complexity and better repair effect [40].
3. Proposed Algorithm
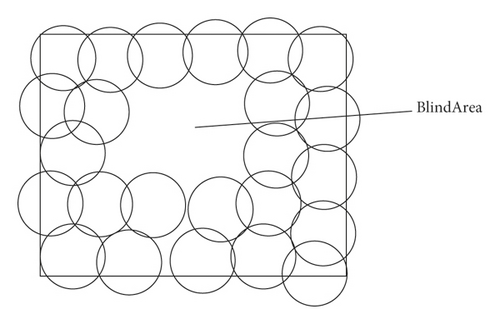
Due to the small volume, light weight, and limited carrying energy of the node, the node is prone to energy depletion after working for a long time, and there is a coverage blind area in the monitoring area, as shown in Figure 1.
There are two methods to repair the coverage blind area in the monitoring area. One is to reduce the area of repeated coverage in the monitoring area, reduce the area of coverage blind area in the monitoring area, and improve the coverage area of the whole network by adjusting the position of existing nodes in the monitoring area. Another method is to redeploy new nodes in the monitoring area and quickly deploy the newly added mobile nodes in the coverage blind area, so as to achieve the purpose of repairing the coverage blind area.
For repairing the coverage blind area, the first problem to be solved is how to find the coverage blind area. For this purpose, the monitoring area is gridded in this article.
As shown in Figure 2, this article considers that the length of the monitoring area is L and the width of the monitoring area is W, in which the length and width of the small grid are ΔLength and ΔWidth, and the plane space occupied by each small grid is ΔLength × ΔWidth. By calculating whether the number of small grids around the node is perceived by the sensor node, we can judge whether the sensor node is an edge node or an internal node.
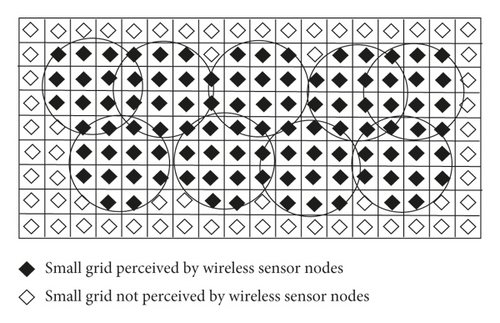
It is assumed that the coordinates of the i-th small grid Gi in the monitoring area are (xj, yj), the coordinates of the j-th sensor node are (xj, yj), the total number of small grids is mG = (Length × Width/ΔLength × ΔWidth), and the total number of sensor nodes is nS.
In (1), it represents the distance between the i-th small grid Gi and the j-th sensor node Sj, and RS represents the sensing radius of the sensor node.
As shown in Figure 3, the probability of perception effect around node s in a small grid whose distance from the center of node s is less than or equal to the perception radius RS is 1. The probability of perception effect around node s in a small grid whose distance from the center of node s is more than the perception radius RS is 0. If the number of small grids around the node is perceived to be more, it means that there are more other nodes around node s, and the node s is the internal node. If the number of small grids around the node is less, it means that the number of other nodes around node s is less, and this node s is an edge node.
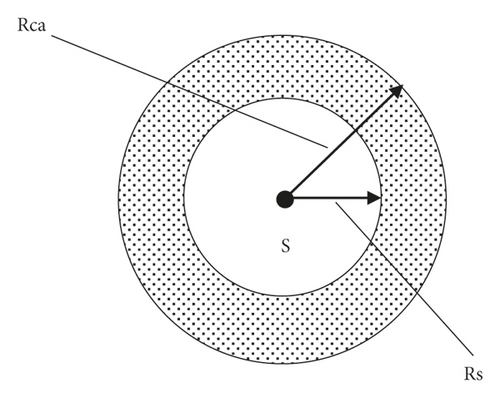
The specific calculation range is the shadow area shown in Figure 3, which is a ring area centered on node s and between radii RS and RCa, where 0 < RS < RCa.
In the ring area, the number of small grids perceived by other nodes is , the number of small grids not perceived by other nodes is , and the total number of small grids is nS.
In (4), when PS is greater than or equal to 1, it means that the total number of small grids within the calculation range of the node s perceived by other nodes reaches or exceeds half, and the node s is an internal node. When PS is less than 1, it means that the total number of small grids within the calculation range of this node s perceived by other nodes does not reach half, and this node s is an edge node.
Nodes in the monitoring area can be divided into two types: internal nodes and edge nodes. Before each node moves, first we determine which type the node belongs to. During the movement, the internal nodes do not move temporarily, but only the edge nodes move, which can reduce the unnecessary movement consumption. How the edge node should move needs to be obtained by mathematical calculation of the small grid around the edge node.
Since most of the small grids in the monitoring area have been sensed by the sensor nodes and a small number of small grids have not been sensed by the sensor nodes, if only the small grids that have not been sensed have a gravitational effect on the surrounding nodes, a large number of computing processes will be reduced.
4. Calculation Process
In (5) and (6), dC represents the relevant parameters that can control the moving distance of the node.
In (11) and (12), xnew(Sj) and ynew(Sj) represent the new position coordinates after the node Sj is moved, and xold(Sj) and yold(Sj) represent the original position coordinates before the node Sj is moved.
This article also considers the energy consumption of nodes in the process of moving. In order to prolong the service time of the network, the moving distance of nodes is determined according to the amount of residual energy of nodes, so as to objectively avoid the nodes with less energy remaining running out of energy due to moving.
It is assumed that the energy of the node Sj before moving is Eold(Sj) and after moving is Enew(Sj). When the energy of the node is lower than Elow(Sj), the node does not participate in the movement and only performs data collection and transmission.
In (15), β represents the energy consumed per unit distance during node movement.
5. Node Movement
-
Step 1: randomly scatter n sensor nodes in the monitoring area with length and width, and each node has the same parameters. Go to step 2.
-
Step 2: each sensor node uses the positioning function to obtain its own location and send its own location information to the sink node. Go to step 3.
-
Step 3: according to the node position in the monitoring area, the sink node calculates the probability that each small grid is perceived by at least one sensor node and the coverage of the monitoring area at this time by using (1) to (3). Go to step 4.
-
Step 4: according to the probability that the small grid around each sensor node is monitored, use (4) to calculate whether the sensor node is an edge node or an internal node. Go to step 5.
-
Step 5: for the internal node, do not move. For the edge node, use (5) to (15) to calculate the moving direction, moving distance, and energy consumption of the edge node. If the edge node is outside the monitoring area after moving, the edge node will not move. Go to step 6.
-
Step 6: after the movement is completed, if the preset number of cycles t is reached, the program ends. If the preset number of cycles is not reached, the number of cycles t = t + 1; enter step 2; and the algorithm process will cycle again.
6. Simulation Analysis
In this article, software is used for simulation verification, and the relevant parameters are as follows:
The monitoring area has length L = 200 m, width W = 200 m, node communication radius RC = 20m, node sensing radius RS = 10m, parameter α = 1, parameter β = 10, node initial energy Einitial(S) = 10000J, node movable minimum energy Elow(S) = 1000J, and cycle times t = 20.
Now we need to determine the parameter values of RCa and dC. The simulation is carried out when the number of nodes n = 20, 40, 60, 80, 100. The following simulation results are obtained according to different RCa and dC:
When RCa = 1.1 RS = 11m, the coverage effect of monitoring area with different numbers of nodes is obtained, as shown in Table 1.
| N | 20 | 40 | 60 | 80 | 100 | Average value |
|---|---|---|---|---|---|---|
| dC = 0.01 RS | 0.1554 | 0.3099 | 0.4379 | 0.5419 | 0.6281 | 0.4146 |
| dC = 0.02 RS | 0.1557 | 0.3048 | 0.4372 | 0.5525 | 0.6243 | 0.4149 |
| dC = 0.03 RS | 0.1559 | 0.3007 | 0.4309 | 0.5508 | 0.6404 | 0.4157 |
| dC = 0.04 RS | 0.1558 | 0.3005 | 0.4434 | 0.5559 | 0.6462 | 0.4204 |
| dC = 0.05 RS | 0.1555 | 0.3005 | 0.4355 | 0.5516 | 0.6611 | 0.4209 |
| dC = 0.06 RS | 0.1559 | 0.3097 | 0.4541 | 0.5546 | 0.6717 | 0.4292 |
- When dC = 0.06 and RS = 0.6 m, the coverage effect of monitoring area with different numbers of nodes is obtained, as shown in Table 2.
| N | 20 | 40 | 60 | 80 | 100 | Average value |
|---|---|---|---|---|---|---|
| RCa = 1.05 RS | 0.1554 | 0.3004 | 0.4306 | 0.5376 | 0.6023 | 0.4053 |
| RCa = 1.1 RS | 0.1556 | 0.3074 | 0.4404 | 0.5605 | 0.6576 | 0.4243 |
| RCa = 1.15 RS | 0.1534 | 0.3002 | 0.4166 | 0.5169 | 0.6098 | 0.3994 |
| RCa = 1.2 RS | 0.1551 | 0.2823 | 0.3841 | 0.4496 | 0.5418 | 0.3626 |
It can be concluded from Table 1 that when dC = 0.06 RS, the coverage effect of the monitoring area is the best.
It can be concluded from Table 2 that when RCa = 1.1RS, the coverage effect of the monitoring area is the best.
Therefore, this article selects RCa = 1.1RS and dC = 0.06RS as the main parameters for simulation verification.
In order to verify the effectiveness of this algorithm, after the node movement is completed, 20 nodes are randomly disabled and this algorithm is rerun to repair the coverage blind area.
Under the same parameter conditions, our algorithm is compared with CHPT algorithm [24] and CBHC algorithm [29]. In order to better observe the repair effect of coverage blind area repair stage, the number of nodes randomly scattered at this time is n = 100, 120, 140, 160, 180.
Before the failure node appears, the comparison of network coverage and node energy consumption is shown in Figures 4 and 5.
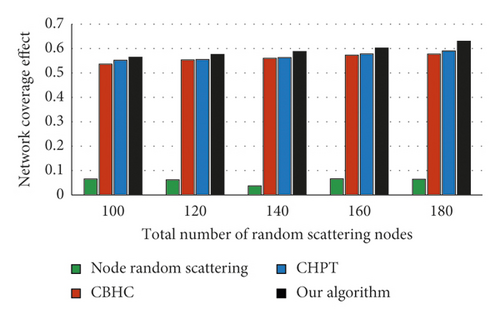
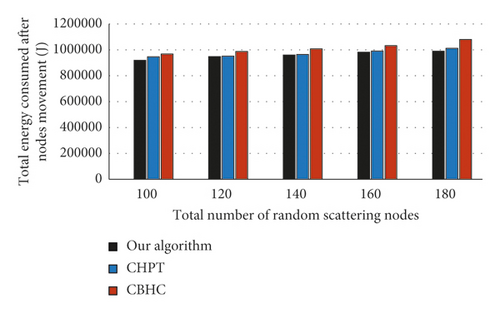
It can be seen from Figures 4 and 5 that in the node movement stage after the random node throwing is completed, with the increase of the total number of nodes, the coverage and the total energy consumption of nodes are also increasing. Compared with the existing two algorithms, our algorithm can effectively improve the network coverage and reduce the energy consumption of nodes.
After the node deployment is completed, 20 nodes will fail randomly and the coverage blind area will be repaired. The comparison of network coverage and node energy consumption is shown in Figures 6 and 7.
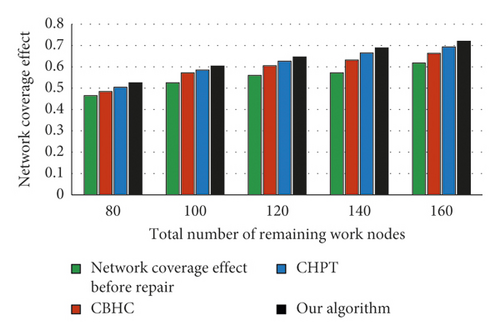
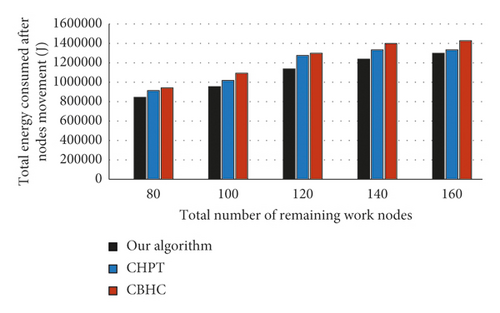
It can be seen from Figures 6 and 7 that after 20 nodes fail randomly, the network coverage decreases significantly. With the reasonable movement of nodes, the coverage rate and the sum of node energy consumption after coverage blind area repair are also increasing. Compared with the existing two algorithms, our algorithm can effectively improve the network coverage and reduce node energy consumption.
7. Conclusion
Aiming at solving the problem of coverage blind area caused by the failure of some nodes in wireless sensor networks, a network coverage blind area repair algorithm based on the perceived environment around nodes is proposed in this article. According to the perceived environment around the nodes in the monitoring area, the algorithm finds the small grids that are not monitored by the sensor nodes. It is assumed that these small grids generate gravity on the nodes, make the nodes move to the coverage blind area, and complete the repair of the coverage blind area. In the process of node movement, taking into account the energy consumption of nodes, we reduce the moving distance of nodes with less residual energy and avoid failure due to node energy depletion. Simulation results show that the proposed network coverage blind area repair algorithm based on the perceived environment around nodes can quickly and effectively improve the network coverage and reduce the energy consumption of nodes.
Conflicts of Interest
The authors declare that they have no conflicts of interest.
Acknowledgments
This research was supported in part by National Natural Science Foundation of China (No. 61375021) and NUAA Fundamental Research Funds for the Central Universities (No. 3082020NZ2020017).
Open Research
Data Availability
The data used to support the findings of this research are available from the corresponding author upon request.


