Deep Learning and Detection Technique with Least Image-Capturing for Multiple Pill Dispensing Inspection
Abstract
In this study, we propose a method to effectively increase the performance of small-object detection using limited training data. We aimed at detecting multiple objects in an image using training data in which each image contains only a single object. Medical pills of various shapes and colors were used as the learning and detection targets. We propose a labeling automation process to easily create label files for learning and a three-dimensional (3D) augmentation technique that applies stereo vision and 3D photo inpainting (3DPI) to avoid overfitting caused by limited data. We also apply confidence-based nonmaximum suppression and voting to improve detection performance. The proposed 3D augmentation, 2D rotation, nonmaximum suppression, and voting algorithms were applied in experiments conducted with 20 and 40 types of pills. The precision, recall, individual accuracy, and combination accuracy of the experiment with 20 types of pills were 0.998, 1.000, 0.998, and 0.991, respectively, and those for the experiment with 40 types of pills were 0.986, 0.999, 0.985, and 0.940, respectively.
1. Introduction
Drug prescription and inventory management are important for ensuring safe drug dispensing and require promptness and accuracy. Hospitals handle 500–1000 types of pills, and various prescriptions are required depending on the conditions of the patients. The drug prescription and inventory management processes require a long time in many hospitals and pharmacies because the pills are manually sorted and packed by pharmacists based on the prescriptions. In addition, because performing simple tasks repetitively cause fatigue, mistakes may occur in pill classification, which may lead to medical accidents. Recently, automated equipment such as automatic drug dispensing machines [1–3] have gained popularity and are being used in pharmacies and hospitals to sort and package pills. An automatic drug-dispensing machine sorts and packs drugs based on prescriptions input from a computer program. However, because there is a risk of error in automatic dispensing machines, it is necessary to inspect the prepared products.
Visual inspection using digital cameras is widely used as a pill inspection method. Existing visual inspection methods include rule-based analysis in which the product features are compared and analyzed, and template matching methods in which the similarity with a reference image is analyzed [4–7]. Deep-learning object-detection algorithms have been actively studied recently [8–11]. In a rule-based algorithm, the characteristics of the objects such as their colors, sizes, shapes, and identification marks are compared. An image processing method is used to extract the features of the object in the algorithm, and a binary threshold is applied to classify the background and object. The morphology is then used to remove the blob noise generated after the binary thresholding process and histogram equalization, gamma transform, and retinex filtering were performed to make the brightness of the captured image uniform [12–14].
Template matching is another type of rule-based algorithm in which a template of the image to be classified is registered, and the input image is compared with the template. In general, objection detection in rule-based image-processing methods is hindered by reflected light and adjacent objects, whereas objects with similar shapes are difficult to classify using only rule-based methods. Furthermore, the template matching method suffers from the need for several templates to be made for each object because the object is affected by the templates. The increased number of templates reduces the processing speed.
Convolutional neural network (CNN)-based deep-learning algorithms have recently become the subjects of active studies because they enable the detection of various types of objects that cannot be easily detected using existing rule-based algorithms. CNNs overcome the problem of insufficiently expressed local information around the image pixels in early neural networks by introducing a convolution operation. The recognition rate in CNNs was subsequently increased with the emergence of VGG, RestNet, and GoogleNet, which change the layer depth or structure [15–17]. Object detection methods applying deep learning can be divided into two- and one-step structure algorithms. Two-step algorithms have a two-step structure in which the object candidate group is first identified and the identified candidate group is subsequently classified. Representative algorithms include R-CNN, Fast R-CNN, Faster R-CNN, and Mask R-CNN in the R-CNN series [18–21]. In contrast, one-step-structure algorithms simultaneously identify the location and type of objects from the feature maps generated from the CNN layer. You only look once (YOLO) is a representative one-step-structure algorithm [22]. YOLO can be trained faster than R-CNN using the same amount of training data. In addition, real-time detection with a detection rate of up to 65 fps is possible in YOLO.
A large amount of training data is required to ensure the performance of deep-learning algorithms. Overfitting occurs and the model becomes difficult to generalize if only a small amount of data is used. Various data augmentation methods have therefore been used to avoid overfitting [23]. Data augmentation is a method for supplementing insufficient training data by artificially transforming the training image. Representative data augmentation methods include rotation, brightness or saturation adjustment, enlargement, reduction, shearing transformation, noise addition, and image movement. In these methods, the data are multiplied by transforming the two-dimensional (2D) information of the photographed objects. However, when the image is captured from a training video, the variation of the object shape with its position at small distances from the camera may affect the depth of information acquired for the object. These changes are difficult to express in 2D and require three-dimensional (3D) image augmentation in consideration of the height and side of the object.
3D augmentation requires depth maps to be acquired. Existing techniques for acquiring depth information include structured light camera, laser scanning, time-of-flight (TOF) camera, and stereo camera methods [24]. In the structured light camera method, the depth information of an object is acquired by projecting structured light with various shapes, such as points or planes, onto an object and analyzing the structural light change information from the captured image [25]. This method requires a separate projector for structured light illumination and suffers from the disadvantage that it is significantly affected by external light. In the laser scanning method, the depth of an object is estimated by scanning it with a laser light source. Although ultra-precise depth information can be acquired with an accuracy of 1 mm, a mechanical device is required to move the laser light source and sensor, and a long time is needed for scanning. In the TOF camera method, the distance is estimated by emitting an infrared signal and measuring the time required for the signal to arrive after it is reflected from an object within the measurement range [26]. The depth information can be measured in a short time at a rate of approximately 30 fps. However, the sensor and object must be separated by at least 2 m, and the image resolution that can be acquired is low. In the stereo camera method, the depth information is predicted from the relative position information of an object in images captured using two or more cameras. The stereo camera method is affected by the performance of the camera and lens and the distance between the cameras but has the advantage of being relatively less affected by external light than the other methods.
- (i)
We propose a method to improve detection performance for training data with minimal captured images. The proposed capturing system can effectively generate training and test data using only four cameras
- (ii)
The operator intervention during the capturing of training data is reduced to three times for each pill. Three scenes are recorded for the front, rear, and side of a single pill
- (iii)
Image processing is used to detect the pill position in the training image to automatically generate the corresponding label file
- (iv)
3D augmentation based on stereo vision and 3DPI is used to increase the amount of training data. The proposed image rotation method can fill the empty region in the rotated image without distortion
- (v)
Confidence-based NMS and voting algorithms are used to improve the model performance in the decision stage.
2. Related Works
2.1. YOLOv4
YOLO is a model in which features are extracted from the entire image and used to predict the location of the object search area. In the YOLO model, the cells are displayed by dividing each object into an S × S grid in the image, and the position of the bounding box and class probability information for each grid cell are predicted. Four versions of YOLO denoted as v1, v2, v3, and v4 have been developed. The concept of a bounding box was used in YOLOv1 to directly solve the regression problem. Anchor boxes were subsequently introduced in later versions of YOLO to facilitate the solution of the regression problem.
YOLOv2 [27] achieves improved object detection by adopting batch normalization, anchor box, direct location prediction, and multiscale training methods. The object detection performance is further improved in YOLOv3 [28] through predictions across different scales and residual blocks. The bounding box is predicted across different scales in YOLOv3 by composing feature maps from three different scales into a structure similar to that of a feature pyramid network. This allows meaningful information to be extracted from the previous layer to obtain subdivided information from the current layer.
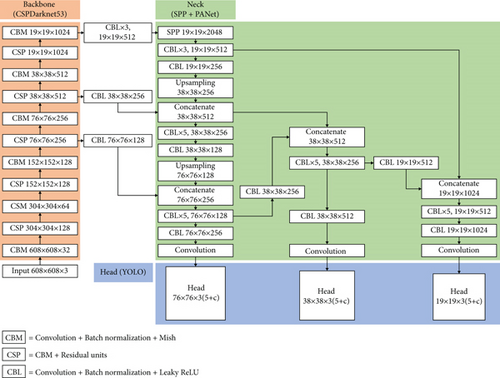
YOLOv4 [29] has a structure similar to that of YOLOv3. Its detection performance is improved by applying additional techniques such as cross-stage-partial-connection (CSP) [30], spatial pyramid pooling (SPP) [31], and a path aggregation network (PAN) [32]. The YOLOv4 structure consists of the backbone, neck, and head. The backbone, which is based on a CSPDarknet53 structure with batch normalization and Mish activation functions, generates feature maps from the input image. CSPDarknet53 improves object detection by slightly deepening the Darknet53 network used in YOLOv3. In addition, because only half of the feature map passes through the residual block in CSPDarknet53, a bottleneck layer is not required. The neck connects the backbone and head and plays a role in reconstructing and refining the feature map. The neck in YOLOv4 comprises SPP and a PAN. SPP contributes to the extraction of contextual features and effectively increases the receptive field by connecting the four layers into a max-pooling layer. The PAN is a network structure that improves the information flow in the granular framework structure by expanding the path information flow between the lower and uppermost feature layers. This improves the overall feature layers, and thereby the localization performance. The head in YOLOv4 is the same as that in the prediction structure of YOLOv3. It enables predictions across different scales by predicting boxes using feature maps from three different scales. Furthermore, YOLOv4 uses Mosiac and CutMix [33] to improve its ability to detect objects in the training data. Figure 1 shows the structure of YOLOv4.
2.2. Stereo Vision Disparity Map
In the stereo vision method, the three-dimensional coordinates of each point on an object are reconstructed to estimate its depth. Two cameras are placed horizontally and employed to capture two images simultaneously to generate a disparity map, which represents the number of horizontal shifts between the left and right images. Stereo-vision-based disparity map algorithms can be divided into global and local methods [34]. In local methods, the disparity is calculated using the brightness information of the pixels within a predefined window. Because a local method uses only information inside the window, its computational complexity is lower than that of a global method. A local method comprises the four steps of matching cost computation, cost aggregation, disparity selection, and disparity refinement [35]. The matching cost is defined as the disparity of a point in the stereo-pair image. Common matching cost functions include the sum of absolute or squared differences, normalized cross-correlations, and rank and census transform. The adjacent pixel information is used in cost aggregation to minimize the matching uncertainty. The disparity is calculated and optimized during disparity selection, and the noise in the disparity map is reduced during disparity refinement, which consists of regularization and occlusion filling. In the former, filtering is used to remove the overall noise and in the latter, regions with uncertain disparity values are interpolated using their adjacent values. In contrast, the cost of a global energy function for all the disparity values is minimized in global methods. Various methods to solve the global energy minimization problem using Markov random fields have been proposed [36, 37]. Although global methods provide good performance, they are not suitable for real-time processing owing to their high computational complexity.
2.3. 3D Photo Inpainting
3D image conversion is a technique for rendering a 2D image captured by a camera into a new view. It can be used to reproduce and record visual perceptions from various angles. Classical image-based rendering technology requires sophisticated image-capturing techniques and specialized hardware. 3D image conversion methods that use RGB-depth (RGB-D) images obtained from small digital cameras or mobile phones equipped with dual lenses in place of expensive specialized equipment have recently been developed. 3DPI provides a means to separate parallax and restore information that is lost when an image of a new view is rendered using an RGB-D image. 3DPI techniques can be divided into image-based and learning-based rendering techniques. In image-based rendering techniques, an image of a new view is synthesized using a collection of posed images. Image-based rendering has good performance when the multiview stereo algorithm works well or when the images are captured using a depth sensor. Several learning-based rendering techniques based on CNNs have recently been studied [38, 39]. These techniques have the advantage of not requiring expensive equipment because they can synthesize images from the new view using both single and stereo-pair images. Shih et al. [40] used layered depth images (LDIs) to reduce the complexity of arbitrary depth information. The input LDI image is divided into several local regions based on the connectivity between the pixels, and the images synthesized by the inpainting algorithm are fused into a new LDI image. The depth information is subsequently changed, and the process applied repeatedly. The algorithm comprises three subnetworks for color, depth, and edge inpainting. The edges of the regions that require restoration are preferentially restored by the inpainting network. After edge restoration, the color and depth information of the image boundary region are restored by the color and depth inpainting networks.
3. Proposed Methods
In this study, we propose a method to improve the detection performance for small-object detection based on limited training data during multiclass training. The proposed method consists of data augmentation to supplement insufficient data, an automated method to process training data into a suitable form for learning and a process to improve multiobject detection performance. Figure 2 shows a flowchart of the proposed method.

3.1. Pill Data Labeling
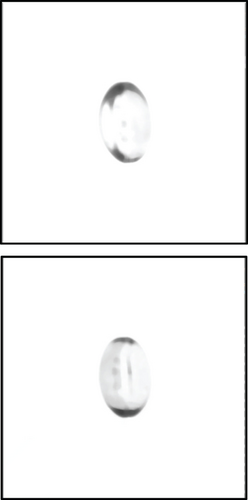
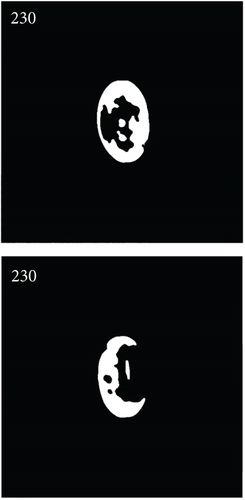
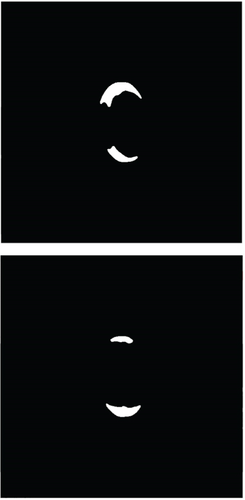
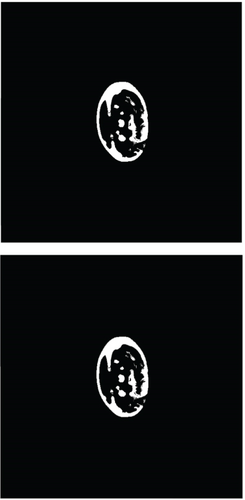
In the proposed method, pill position detection is performed during the pretraining stage to process the captured image into a suitable form for training and automatically generate a label file that records the location information of the object during training. As shown in Figure 3, the position of the pill is determined based on the edge component of the pill. In this example for a transparent pill, the blue channel, which had the largest standard deviation between the pixel values of the background and foreground among the RGB channels, was used for edge detection of the pill. Figure 4 shows the distribution and standard deviation of the pixel brightness for each RGB channel at the centerline of the transparent pill. It can be seen that the blue channel had the largest standard deviation. A median filter was applied in a preprocessing step to remove noise while preserving the edge of the image. Subsequently, an adaptive threshold algorithm was applied to obtain the edge region information of the pill. It was difficult to apply the global or Otsu threshold methods to transparent pills because the brightness distributions were not uniform and depended on the location of the pills.
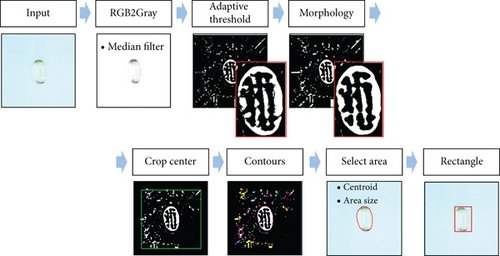
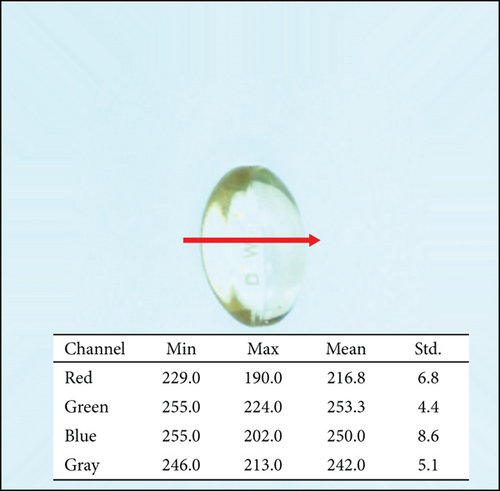
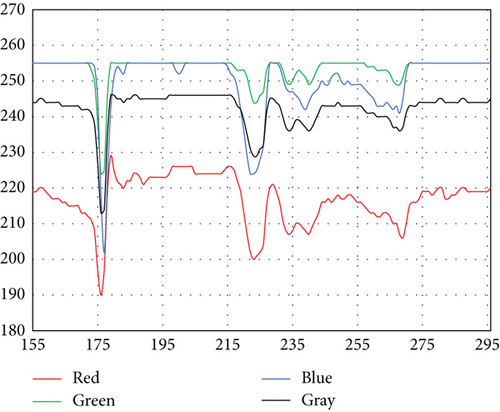
Figure 5 shows the results of applying the global, Otsu, and adaptive threshold methods. The shape of the pill was accurately detected by the adaptive threshold method. Some regions of the pill were also detected by the global threshold method; however, the method has a deficiency in that the threshold value needs to be adjusted according to the type of pill. After the threshold step, the morphology technique was used to combine the separated regions of the pill, and a partial region of the image was cropped to remove the large noise in the outermost part of the image. In the next step, a contouring algorithm was applied to detect the position of the pill. The contour algorithm generates the area and centroid of each blob in a binary image. To obtain the blob corresponding to the pill among the several blobs generated by the binary algorithm, the largest blob with its centroid located at less than 50 pixels from the image center was selected. Finally, the location information of the pill was obtained from the bounding rectangle of the selected blob. Table 1 lists the main process parameters for identifying the pill position.
| Process | Function (OpenCV) | Parameter | Value |
|---|---|---|---|
| Input | Image Size | 608 × 608 | |
| Median filter | medianBlur | kSize | 11, 11 |
| Adaptive threshold | adaptiveThreshold | maxValue | 255 |
| adaptiveMethod | ADAPTIVE_THRESH_GAUSSIAN_C | ||
| thresholdType | THRESH_BINARY_INV | ||
| blockSize | 33 | ||
| C | 1 | ||
| Morphology | getStructuringElement | shape | MORPH_ELLIPSE |
| kSize | 11, 11 | ||
| morphologyEx | op | MORPH_CLOSE | |
| Iteration | 2 | ||
| Contour | findContours | mode | RETR_EXTERNAL |
| method | CHAIN_APPROX_SIMPLE |
3.2. Data Augmentation
Deep-learning models require large amounts of data for effective training. However, it is not easy to obtain a large amount of suitable data for training, and the classes in the obtained data may be imbalanced. When a deep-learning model is trained with unbalanced class data, the model may be biased toward a specific class, which significantly affects its performance. Data augmentation is used to solve this problem. Data augmentation methods such as varying the brightness, color, and image ratio were not required in this study because the data were acquired in a fixed capturing environment. Instead, a 3D image augmentation method is proposed in which three-dimensional changes are applied according to the position of the object. RGB images and depth maps are used in this method. For each specimen, a depth map was generated in the up, down, left, and right directions using four cameras attached to the capturing system, and a 3DPI algorithm was applied based on the generated depth map and four RGB images to generate multiple training images.
3.2.1. 3D Data Augmentation
Because the brightness, color, and camera position were fixed in the proposed capturing, the sizes and colors of the objects in the training images were always the same as those in the testing images. Commonly used 2D augmentation methods such as resizing, flipping, shearing and changing the color, and exposure can distort the shape and color of the object and degrade the detection performance of the model. However, the actual changes in the appearance of a pill when the pill is located at various locations within the measurement range are three-dimensional. Therefore, capturing the pill form only at the center position does not capture the shapes that the pill can have at various positions. The proposed 3D augmentation method can create more realistic images by shifting the viewpoint of the object captured by the camera.
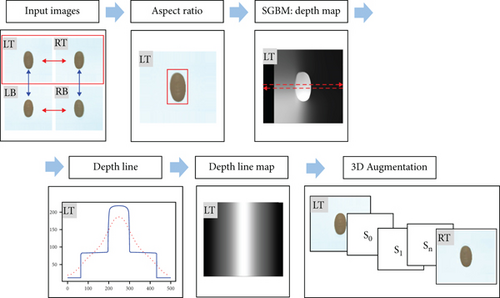
Figure 6 shows the process of generating a 3D-augmented image using the top-left and top-right images among the four captured images. Four refined images labeled as LT, RT, LB, and RB for left-top, right-top, left-bottom, and right-bottom were generated in the 3D image augmentation process by rotation for 0°, 90°, 180°, and 270°, respectively. Two image pairs comprising the top and bottom images and the left and right images were used for the 3D augmentation. The pill in the image was detected and its aspect ratio was calculated to generate a depth map. Because circular pills suffered from severe distortion during 3D augmentation, 3D augmentation was applied only for oval-shaped pills with an aspect ratio of at least 1.05. Multiple copies of pills with aspect ratios of less than 1.05 were used in place of 3D augmentation to match the amount of data for the 3D-augmented pills. Subsequently, a depth map was generated using a semiglobal block-matching algorithm. The depth map in Figure 6 was generated based on the LT image. A depth line map was generated from the depth map to reflect the changes at different camera viewpoints when the 3D image was augmented. After the depth line map was extracted from the centerline of the depth map, the value on each point of the depth line was copied along the vertical direction of the line. The horizontal line was calculated based on the average value along the left and right directions, such that the extracted lines were symmetrical. One-dimensional convolution was applied with a Gaussian kernel to remove the noise of each average line. Next, the horizontal depth line was repeated in the vertical direction to match the image size to create a new depth map. Finally, 3D image augmentation was performed using 3DPI based on the generated depth line map.
3.2.2. Image Rotational Augmentation
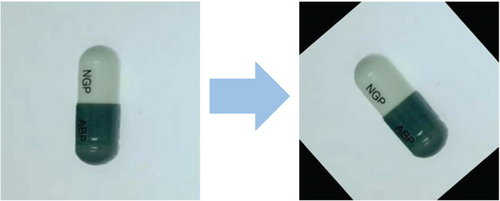
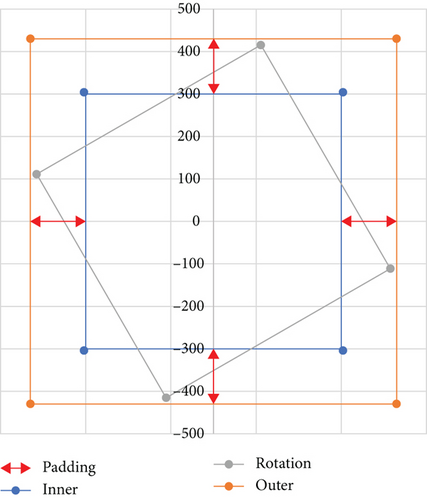
Figure 8 shows the overall process of the proposed image rotational augmentation. In the input image, the edge region was cropped before the padding process to remove the noise components at the outer edges of the image. In the experiments, the image was cropped to a width-to-height ratio of 0.95. Padding and rotational transformations were then applied to the image, and the image was cut to the same dimensions as the input image based on the center of the transformed image.

3.3. Data Labeling Automation
3.4. Data Training
Images containing only one pill each were used for the training data. To convert each captured image into training data, the position of the pill was detected and the image was cropped such that the pill was located at the center of the image. The cropped image was resized to 608 × 608 pixels for training. A label file was created from the 3D and rotationally augmented images using the proposed pill position detection algorithm before training. Label files and images with errors such as data omissions, class mismatches, and duplicates were excluded from the training data during the preprocessing review process for the generated label files. The data training was performed using the YOLOv4 model with the image shift and mosaic augmentation YOLOv4 data augmentation options applied but not the color, chroma, exposure, left and right inversions, and image ratio options. Figure 9 shows the training process.

3.5. Data Detection
Unlike training, which used images containing only a single pill each, test images containing multiple pills were used in the data detection process. Each detection image was cropped to only the area containing the pills and resized to 608 × 608 pixels. A confidence-based NMS algorithm was applied as a postprocessing method to exclude duplicate detections at the same location in the detection results. Subsequently, the scenes captured with four cameras were designated as one group, and the results were analyzed using a voting algorithm. Figure 10 shows the detection process.

3.5.1. Removal of Overlapping Data
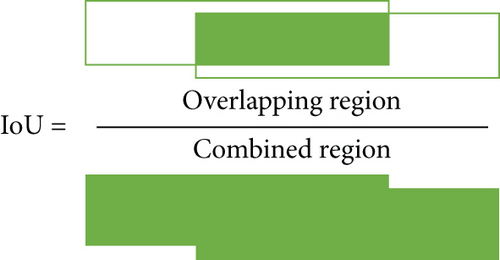
Because the numbers and shapes of the pills were not the same in the images used for training and detection, duplicate detection results may appear in the same areas in detection images containing multiple pills. The overlapping regions were removed using an NMS algorithm based on the intersection over union (IoU), as shown in Figure 11. The class of the overlapping region was not considered in the algorithm, and only the result with the highest confidence was selected. The IoU represents the ratio between the intersection and union of the overlapping regions, as shown in Figure 12. A larger IoU value represents a larger overlap between the areas of the two regions. The IoU value ranges from 0 to 1. An IoU value of 0.5 was used in the proposed method.


3.5.2. Final Detection Decision
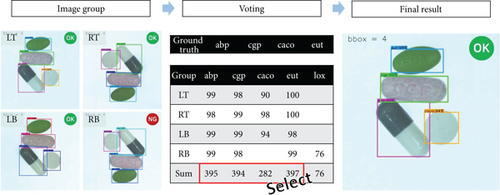
Because the capturing system comprised four cameras for two-axis stereo photography, four slightly different images were acquired for the same scene. In addition, the detection results may differ between the four images. Therefore, to improve detection performance, the four images of each scene were grouped and compared. Figure 13 shows the process for comparing the results of the image groups. If an NG occurs only for the RB image among the results of the image group, the sum of the confidences for each pill in the four images is calculated, and the four pills with the highest score are selected. In the LT, RT, and LB images, abp, cgp, caco, and eut pills were detected, while in the RB image, it was confirmed that lox was incorrectly detected instead of caco based on the large sums of 397, 395, 395, 282, and 76 for the detection values of eut, cgp, abp, caco, and lox, respectively, in decreasing order. The final detection results were verified to be consistent with the ground truth.
4. Experimental Environment
4.1. Data Capturing Environment and Development System
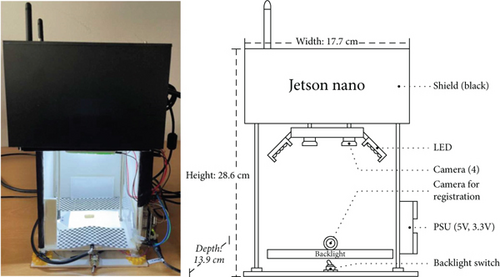
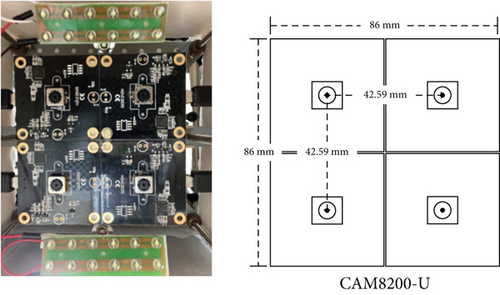
Four CAM8200-U (5 megapixel USB camera module) cameras were used to capture stereo vision images in the capturing system. In addition, an NVIDIA Jetson nanoembedded board with a Wi-Fi module was used for capturing control and data communication. Backlight lighting was used in the lighting environment to remove the shadow from the pill, and two LED lighting modules were installed in the direction of the pill next to the upper camera module. A blocking film was installed around the camera to reduce the influence of external light sources. Figure 14 shows photographs and illustrations of the interior and exterior of the image-capturing system.
The system for deep learning training comprised an NVIDIA 3090 GPU, i9-10980EX CPU, and 256 GB RAM. CUDA 11.0 and cuDNN 8.0.4 were used in the system. A C language-based dark-net framework was used for YOLOv4 and Pytorch 1.9.0, and Python 3.8.10 was used for 3DPI. Table 2 lists the YOLOv4 parameters used for training.
| Option | Description |
|---|---|
| Image size | 608 × 608 |
| Validation ratio | 20% |
| Learning rate | 0.001 |
| Momentum | 0.949 |
| Decays | 0.005 |
| Backbone | CSPDarkNet53 |
| Augmentation in YOLOv4 | Mosaic, image shift |
4.2. Data Communication
A Jetson Nano board was used for image capture and data transmission in the system. The images were captured by the capturing system, and the captured data was transmitted to the deep-learning PC through socket communication using the transmission control protocol (TCP). Data refinement and augmentation, label file creation, training, and detection were performed on the received images by the deep-learning PC.
4.3. Data Refinement
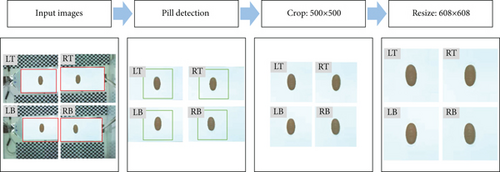
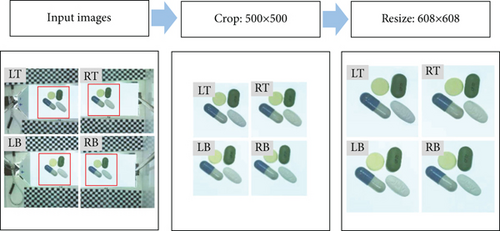
The pill in the training image should ideally be placed at the center of the image for 3D augmentation. However, the manually placed pills were not always centered on the image, which caused position errors. It was therefore necessary to find the center point of the pill in each image and to cut the image to a certain size. The fixed backlight region was first removed from the image and the center of the pill determined using the pill-position detection algorithm described in Section 3.1. After cropping the image to 400 × 400 pixels around the center of the pill, the padding algorithm was applied to expand the image to 500 × 500 pixels. If the image has been cropped to 500 × 500 pixels immediately, the area outside the backlight could have been included depending on the position of the pill. Finally, the image was resized to 608 × 608 pixels for YOLO training. The images used for detection contained multiple pills. In this case, the capturing position was fixed such that multiple pills were included in the image. The area containing the multiple pills was cropped to 500 × 500 pixels based on the fixed location of the captured image and then resized to 608 × 608 pixels for training. Figures 15(a) and 15(b) show the processes for refining the training and detection data, respectively.
4.4. Data Set for Training and Detection
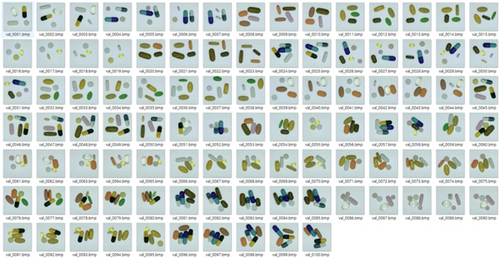
The images used for training and detection contained pills with hard and soft materials; circular, ovoid, or square shapes; and various colors including white and transparent. The training images contained only one pill each, whereas the detection images contained multiple pills.
4.4.1. Pill Data for Single-Axis 3D Augmentation
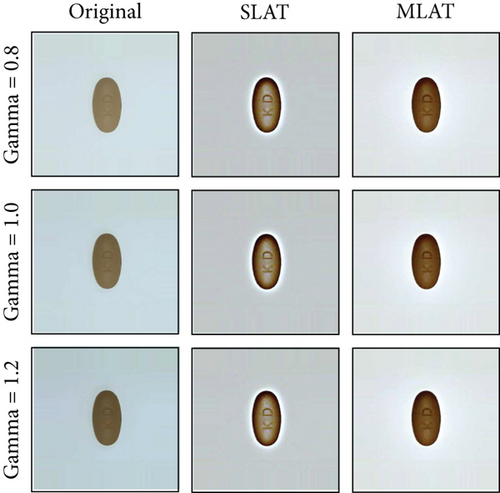
20 types of pills were used for primary pill detection training. Figure 16(a) shows an example of the images used for primary pill detection training. The training images were acquired using two pairs of stereo cameras. The pill in the video was captured at the angles of 0° and 90° with respect to its front, rear, and side. Figure 16(b) shows the images augmented by applying the gamma transformation and luminance adaptation transform (LAT) for comparison with the proposed augmentation method. The image brightness was nonlinearly adjusted to different levels in the gamma transformation while the local image brightness was adjusted to improve the image contrast and detail in LAT. LAT comes in the two versions of single-scale (SLAT) and multiscale LAT (MLAT) according to the number of applied Gaussian blur kernels [13]. Figure 16(b) shows that the excessive local adaptation in SLAT led to halo artifacts, whereas both the contrast and detail were improved in MLAT. Figure 16(c) shows the images used for the detection test.

4.4.2. Pill Data for Dual-Axis 3D Augmentation
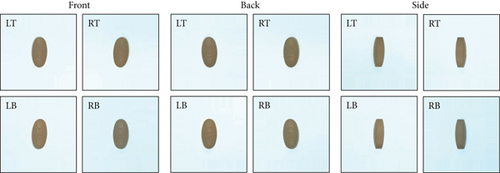
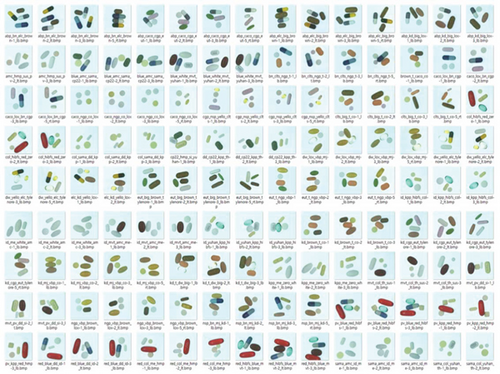
Figure 17 shows the images used for the secondary training and detection test. Figure 17(a) shows the LT, LB, RT, and RB images acquired from the four cameras for the front, rear, and side of each pill without rotational arrangement. The captured images were expanded using the 3D image and rotational augmentations. Figure 17(b) shows the images used for the detection test. Four pills were randomly selected from 40 types of pills and placed in their front, rear, or side views in each detection test image.
5. Experimental Results
5.1. Evaluation Index
5.2. Pill Detection Training with Single-Axis 3D Augmentation
In the first test, the effects of different augmentation methods were compared using 20 types of pills. These augmentation methods comprise the original photographed images, 2D image augmentation based on gamma transformation and LAT, and single-axis 3D augmentation using stereo left and right pairs. The original photographs were captured in the vertical and horizontal directions in the front, rear, and side views with the pill at the center of the image. 100 images containing four to six random pills with various shapes chosen from 20 types of pills were used for the detection test. A total of 468 individual pills were included in the 100 test images. The NMS algorithm was applied as a postprocessing algorithm to remove duplicate detection areas. Table 3 lists the capturing conditions, training settings, and test settings; Table 4 lists the types of augmentation used in each experiment.
| Environment | Option | Description |
|---|---|---|
| Capturing conditions | Number of captured images | 480 (24 per pill) |
| Pill position | Center | |
| Pill direction | Front, rear, side | |
| Pill angle | 0°, 90° | |
| Number of cameras | 2 | |
| Test setting | Test set size | 100 |
| Postprocessing | Nonmaximum suppression |
| Test | Augmentation | |||
|---|---|---|---|---|
| Gamma | LAT | Rotation (0°, ±20°, ±45°) | 3D (left-right and top-bottom pairs, 0°, 90°, 180° 270°) and 10 images per angle | |
| Basic image capture | ||||
| 2-dimension augmentation | ✓ | ✓ | ||
| 3-dimension single-axis augmentation | ✓ | ✓ | ||
5.2.1. Original Captured Images
Four hundred and eighty images of 20 types of pills were used without additional augmentation for training using only the original captured images. The detection results are presented in Table 5. The highest precision of 0.917 and recall of 0.948 were achieved at 4000 iterations and the combination accuracy was 0.55, indicating that accurate detection was achieved in 55 out of 100 test images.
| Iterations | TP | FP | FN | Precision | Recall | Individual accuracy | OK | NG | Combination accuracy |
|---|---|---|---|---|---|---|---|---|---|
| 1000 | 215 | 252 | 117 | 0.460 | 0.647 | 0.368 | 0 | 100 | 0 |
| 2000 | 382 | 49 | 42 | 0.890 | 0.900 | 0.808 | 44 | 56 | 0.44 |
| 3000 | 393 | 44 | 32 | 0.899 | 0.924 | 0.838 | 47 | 53 | 0.47 |
| 4000 | 409 | 37 | 22 | 0.917 | 0.948 | 0.874 | 55 | 45 | 0.55 |
| 5000 | 406 | 38 | 24 | 0.914 | 0.944 | 0.868 | 54 | 46 | 0.54 |
| 6000 | 407 | 38 | 23 | 0.914 | 0.946 | 0.870 | 54 | 46 | 0.54 |
| 7000 | 408 | 37 | 23 | 0.916 | 0.946 | 0.872 | 54 | 46 | 0.54 |
5.2.2. 2D Image Augmentation
The gamma transformation and LAT were used for 2D image augmentation. Three gamma transforms and two LAT transforms comprising SLAT and MLAT were applied. The detection results are presented in Table 6. The highest detection performance was achieved at 3000 iterations; however, the accuracy did not improve significantly, and the combination accuracy was only 0.59. Although both transformation models in the secondary augmentation led to changes in brightness, the results confirmed that changing the brightness was not very helpful for training because the images were captured under a fixed lighting environment.
| Iterations | TP | FP | FN | Precision | Recall | Individual accuracy | OK | NG | Combination accuracy |
|---|---|---|---|---|---|---|---|---|---|
| 1000 | 420 | 101 | 258 | 0.542 | 0.317 | 0.539 | 0 | 100 | 0 |
| 2000 | 400 | 53 | 17 | 0.883 | 0.959 | 0.851 | 51 | 49 | 0.51 |
| 3000 | 416 | 47 | 7 | 0.898 | 0.983 | 0.885 | 59 | 41 | 0.59 |
| 4000 | 416 | 48 | 5 | 0.896 | 0.988 | 0.887 | 58 | 42 | 0.58 |
| 5000 | 414 | 51 | 5 | 0.890 | 0.988 | 0.881 | 57 | 43 | 0.57 |
| 6000 | 415 | 50 | 5 | 0.892 | 0.988 | 0.883 | 57 | 43 | 0.57 |
| 7000 | 414 | 50 | 5 | 0.892 | 0.988 | 0.883 | 58 | 42 | 0.58 |
5.2.3. 3D Single-Axis Image Augmentation
In 3D single-axis augmentation, the depth map of the augmented image was extracted from only the stereo left- and right-pair images. The 3DPI algorithm was used for 3D augmentation and applied in both the left and right directions. Fourteen images were generated after augmentation along the left and right directions each. In addition, rotational augmentation was applied at the angles of ±20° and ±45° on the 3D-augmented images. Table 7 presents the results for the trained model. The detection performance was the highest at 4000 iterations, and the precision, recall, and individual and combination accuracies are all higher than those of the previous two models. In particular, the combination accuracy index for the whole pill image was significantly improved from 0.59 to 0.94. These results confirm that the proposed 3D and rotational augmentations are effective in improving detection performance.
| Iterations | TP | FP | FN | Precision | Recall | Individual accuracy | OK | NG | Combination accuracy |
|---|---|---|---|---|---|---|---|---|---|
| 1000 | 254 | 211 | 89 | 0.546 | 0.740 | 0.458 | 0 | 100 | 0 |
| 2000 | 439 | 36 | 9 | 0.924 | 0.979 | 0.907 | 65 | 35 | 0.65 |
| 3000 | 459 | 7 | 2 | 0.984 | 0.995 | 0.981 | 93 | 7 | 0.93 |
| 4000 | 460 | 5 | 3 | 0.989 | 0.993 | 0.983 | 94 | 6 | 0.94 |
| 5000 | 459 | 6 | 3 | 0.987 | 0.993 | 0.981 | 93 | 7 | 0.93 |
| 6000 | 459 | 5 | 4 | 0.989 | 0.991 | 0.981 | 93 | 7 | 0.93 |
| 7000 | 459 | 6 | 3 | 0.987 | 0.993 | 0.981 | 93 | 7 | 0.93 |
5.3. Pill Detection Training with Dual-Axis 3D Augmentation
In the secondary pill detection training, the direction of the pill was additionally restricted to only the vertical direction to reduce the need for operator intervention in capturing the training images. Dual-axis 3D augmentation was performed in which a combination of left, right, top, and bottom stereo pairs was formed using images captured by the four cameras, and 3D augmentation was performed using each pair of images. Additionally, rotational augmentation was applied at the angles of ±20° and ±45° to the 3D-augmented images. Detection training was conducted for 20 and 40 types of pills. In the detection test, 430 images were used in the detection experiments with 20 types of pills, and 862 images for the detection experiments with 40 types of pills. The NMS algorithm was applied as a postprocessing algorithm to remove overlapping regions. To improve the detection performance, images of the same pill taken by four cameras were processed as one group, and the pills with high cumulative scores were selected in the detection decision.
5.3.1. Detection for 20 Types of Pills with Dual-Axis 3D Image Augmentation
Table 8 lists the test conditions for the detection of 20 types of pills to which dual-axis 3D image augmentation was applied. The results are presented in Tables 9 and 10, which, respectively, show the results of applying only the NSM algorithm and applying both the NMS and voting algorithms. The number of original images used in the secondary pill detection training was 240, which is approximately half of the 480 original images used in the primary pill detection training. Nevertheless, it can be observed from Table 9 that the results are similar to those in the primary detection test. However, as shown in Table 10, the combination accuracy increased from 0.923 to 0.991 after applying the voting algorithm.
| Environment | Option | Description |
|---|---|---|
| Capturing conditions | Number of captured images | 240 (12 per pill) |
| Pill position | Center | |
| Pill direction | Front, rear, side | |
| Pill angle | 90° | |
| Number of cameras | 4 | |
| Training setting | Augmentation | 3D (left-right and top-bottom pairs, 0°, 90°, 180°, 270°) and 10 images per angle, rotation (0°, ±20°, ± 45°) |
| Test setting | Test set size | 430 |
| Postprocessing | Nonmaximum suppression, voting |
| Iterations | TP | FP | FN | Precision | Recall | Individual accuracy |
OK | NG | Combination accuracy |
|---|---|---|---|---|---|---|---|---|---|
| 1000 | 918 | 1010 | 282 | 0.476 | 0.765 | 0.415 | 1 | 429 | 0.002 |
| 2000 | 1628 | 96 | 2 | 0.944 | 0.999 | 0.943 | 340 | 90 | 0.791 |
| 3000 | 1651 | 68 | 1 | 0.960 | 0.999 | 0.960 | 365 | 65 | 0.849 |
| 4000 | 1681 | 38 | 1 | 0.978 | 0.999 | 0.977 | 393 | 37 | 0.914 |
| 5000 | 1683 | 36 | 1 | 0.979 | 0.999 | 0.978 | 394 | 36 | 0.916 |
| 6000 | 1685 | 34 | 1 | 0.980 | 0.999 | 0.980 | 397 | 33 | 0.923 |
| 7000 | 1683 | 37 | 1 | 0.978 | 0.999 | 0.978 | 394 | 36 | 0.916 |
| Iterations | TP | FP | FN | Precision | Recall | Individual accuracy |
OK | NG | Combination accuracy |
|---|---|---|---|---|---|---|---|---|---|
| 1000 | 296 | 70 | 66 | 0.809 | 0.818 | 0.685 | 15 | 93 | 0.139 |
| 2000 | 420 | 9 | 3 | 0.979 | 0.993 | 0.972 | 96 | 12 | 0.889 |
| 3000 | 428 | 3 | 1 | 0.993 | 0.998 | 0.991 | 104 | 4 | 0.963 |
| 4000 | 431 | 1 | 0 | 0.998 | 1.000 | 0.998 | 107 | 1 | 0.991 |
| 5000 | 431 | 1 | 0 | 0.998 | 1.000 | 0.998 | 107 | 1 | 0.991 |
| 6000 | 431 | 1 | 0 | 0.998 | 1.000 | 0.998 | 107 | 1 | 0.991 |
| 7000 | 431 | 1 | 0 | 0.998 | 1.000 | 0.998 | 107 | 1 | 0.991 |
5.3.2. Detection for 40 Types of Pills with Dual-Axis 3D Image Augmentation
Twenty types of pills with diverse combinations were photographed for pill detection. Table 11 lists the experimental conditions, and Tables 12 and 13 list the experimental results. Table 12 shows that the combination accuracy was 0.833 without the voting algorithm, which is lower than the accuracy of 0.923 for the 20-type case, but it increased to 0.940 after applying the voting algorithm, as shown in Table 13. This demonstrates the effectiveness of the combination determination method using four output images.
| Environment | Option | Description |
|---|---|---|
| Capturing conditions | Number of captured images | 480 (12 per pill) |
| Pill position | Center | |
| Pill direction | Front, rear, side | |
| Pill angle | 90° | |
| Number of cameras | 4 | |
| Training setting | Augmentation | 3D (left-right and top-bottom pairs, 0°, 90°, 180°, 270°) and 10 images per angle, rotation (0°, ±20°, ±45°) |
| Test setting | Test set | 862 |
| Postprocessing | Nonmaximum suppression, voting |
| Iterations | TP | FP | FN | Precision | Recall | Individual accuracy |
OK | NG | Combination accuracy |
|---|---|---|---|---|---|---|---|---|---|
| 1000 | 495 | 614 | 2414 | 0.446 | 0.170 | 0.141 | 1 | 861 | 0.001 |
| 2000 | 3,233 | 548 | 45 | 0.855 | 0.986 | 0.845 | 421 | 441 | 0.488 |
| 3000 | 3,278 | 266 | 41 | 0.925 | 0.988 | 0.914 | 587 | 275 | 0.681 |
| 4000 | 3,277 | 148 | 23 | 0.957 | 0.993 | 0.950 | 706 | 156 | 0.819 |
| 5000 | 3,292 | 135 | 21 | 0.961 | 0.994 | 0.955 | 718 | 144 | 0.833 |
| 6000 | 3,286 | 136 | 26 | 0.960 | 0.992 | 0.953 | 712 | 150 | 0.826 |
| 7000 | 3,283 | 138 | 27 | 0.960 | 0.992 | 0.952 | 709 | 153 | 0.823 |
| Iterations | TP | FP | FN | Precision | Recall | Individual accuracy |
OK | NG | Combination accuracy |
|---|---|---|---|---|---|---|---|---|---|
| 1000 | 233 | 143 | 488 | 0.620 | 0.323 | 0.270 | 1 | 215 | 0.005 |
| 2000 | 838 | 24 | 2 | 0.972 | 0.998 | 0.970 | 192 | 24 | 0.889 |
| 3000 | 850 | 14 | 0 | 0.984 | 1.000 | 0.984 | 202 | 14 | 0.935 |
| 4000 | 849 | 15 | 0 | 0.983 | 1.000 | 0.983 | 201 | 15 | 0.931 |
| 5000 | 851 | 12 | 1 | 0.986 | 0.999 | 0.985 | 203 | 13 | 0.940 |
| 6000 | 849 | 14 | 1 | 0.984 | 0.999 | 0.983 | 201 | 15 | 0.931 |
| 7000 | 848 | 14 | 2 | 0.984 | 0.998 | 0.981 | 200 | 16 | 0.926 |
The results of the proposed method were compared with those obtained using the two-step approach of Kwon et al., which is based on Mask R-CNN [41]. In the first step, the area of each pill was detected in an image containing multiple pills, and virtual images containing only a single pill were generated using the detected area of the pill. In the second step, pill detection was performed using the generated virtual images. In the test with 27 classes of pills, the average accuracy for each pill was 0.916. However, if the accuracy is converted to the combination accuracy for multiple pills used in this study, the accuracy becomes 66%, which confirms the superiority of the proposed method.
6. Conclusions
In this study, we proposed a method to improve the small-object detection performance of a module trained using limited data. An image-capturing system was implemented for training and pill detection. In general, multiclass object detection algorithms require multiclass data for training. However, the number of images required for training containing the various possible combinations of classes as the number of object classes increases along with the difficulty of database management. A method to increase detection performance using minimal training data was therefore proposed in this study. Conventionally, the images of the objects to be detected need to be obtained under the same capturing conditions as those for the test images. A large number of training images are therefore required to account for variations in the positions and adjacent objects. Insufficient training images can result in detection problems for test images that contain several objects. The detection problems due to differences between multiobject test images and single-object training images were addressed in this study.
Pills of various shapes and colors were used for data training and detection tests. Four cameras were used to effectively capture 2-axis stereo images for training. A backlight and upper light were used simultaneously to remove the shadow of the pill during capture. An NVIDIA Jetson Nano board was used in the imaging system for standalone use and remote data communication based on a TCP socket communication protocol. The four cameras performed stereo vision capture along the two-axis directions. YOLOv4, which can detect objects in real time and has excellent detection performance, was used for data training. The data augmentation methods in YOLOv4 that distort the shape and color of the objects, such as left-right inversion and ratio, color, brightness, and saturation adjustments, were not used, and only the mosaic and image shift augmentations were applied. To automatically generate the necessary label data during training, a vision algorithm to detect the position of the pill in the training image was developed. An NMS algorithm was used to remove the overlapping regions during detection, and the final result was obtained by combining the detected results from the four test images, which were combined into a single group.
Primary (1-axis 3D augmentation) and secondary (2-axis 3D augmentation) pill detection training were conducted for the training tests. For the primary pill detection training experiment, the results of basic imaging without data augmentation, 2D image augmentation with brightness conversion, and 3D augmentation using the stereo vision method were compared for 20 types of pills. The proposed image augmentation and postprocessing method showed a combination accuracy of more than 99% in a fixed lighting environment. In the second experiment, to reduce the need for operator intervention to three times per pill during capturing of the training data, only one pill was placed at 90°, and its front, rear, and side scene images recorded using four cameras. During training, the 3D and rotational augmentations were applied along the two axes of the up and down directions and the left and right directions. Training tests were conducted using 20 and 40 types of pills. The proposed method achieved a combination accuracy of 94% in the latter test.
The proposed training and detection methods, including the capturing system, are not limited to pill detection and can be used in various image-based object detection applications. In particular, it is expected that the method can be applied to the training and detection of various objects in training environment conditions where there is insufficient training data.
Conflicts of Interest
The authors declare that there is no conflict of interest regarding the publication of this paper.
Acknowledgments
This research was supported by the Basic Science Research Program through the National Research Foundation of Korea (NRF), BK21 FOUR project funded by the Ministry of Education, Korea [NRF-2021R1I1A3049604, 4199990113966], and Electronics and Telecommunications Research Institute (ETRI) grant funded by the Korean government [21ZD1140, development of ICT convergence technology for Daegu-Gyeongbuk Regional Industry].
Open Research
Data Availability
All data used in the study (e.g., pill images) were taken and used with self-produced imaging equipment.


