A New Method for the Calibration of Site-Related Response Spectra
Abstract
The calibration of response spectra is an important issue that needs further research in engineering earthquake resistance. This paper proposes an improved calibration method for site-related response spectra. The seismic acceleration response spectra are statistically analyzed in the random period bands in the form of regression analysis, and the fitting indices in each frequency band under 11 different functions are given. Accordingly, the best fitting function for each period band is determined. Combined with a genetic algorithm, the control parameters of the seismic acceleration response spectrum are calibrated according to the determined new design spectral shape. After comparing the calibration results with the proposed piecewise results, a new calibration model of the three-section curve expression is proposed by improving the piecewise standard until the calibration results are identical to the proposed period point. The accuracy of the proposed calibration method is validated against the other four available methods using Qian’a earthquake records and actual engineering examples. The research results show that the site-related response spectrum calibration method given in this paper objectively reflects the spectrum characteristics of the site-related response spectrum. The proposed method may have a certain reference value for the calibration of the site-related response spectrum.
1. Introduction
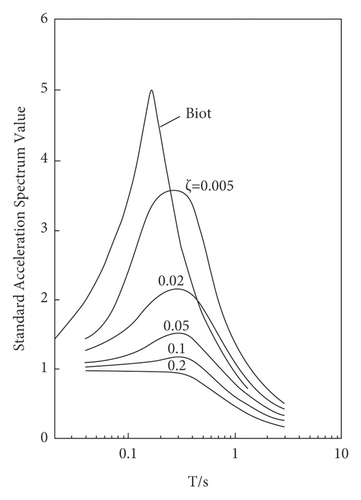
The calibration of the design response spectrum is a key issue in the seismic design of the building structure of the engineering site. The calibration results of the site-related design response spectrum should appropriately reflect the ground motion characteristics of the engineering site. For the calibration of the site-related seismic response spectrum, the critical issues are the expression of the design response spectrum and the selection of calibration methods. Any calibration of the site-related seismic response spectrum is based on the design response spectrum calibration model, i.e., the design response spectrum shape. The earliest seismic design spectrum calculated from ground motion records for engineering design was proposed by Housner. Eight horizontal component records of ground motion from four earthquakes (El Centro in 1934, Olympia in 1940, Washington in 1949, and Taft in 1952) were adopted, normalized by 0.2 g, and then averaged. The design spectrum is expressed in the form of a curve [1]. Later, Newmark described the design response spectrum in the form of a straight line and proposed a three-parameter calibration method [2]. Figure 1 shows a comparison between the Biot standard spectrum and the Housner design spectrum. At present, most calibration methods for the site-related response spectrum in China adopt the three-section expression given in the Code for Seismic Design of Buildings (GB50011-2010), and the mid-frequency band uses a horizontal line to reflect the spectral characteristics of the site-related response spectrum in this frequency band [3, 4]. It is not difficult to find that the shape of the actual site-related response spectrum is irregular. The spectrum variation characteristics of each frequency band vary with changes in the soil layer conditions, seismic wave propagation path, and seismic environment [5–15]. The expression of the design response spectrum given in the Code for Seismic Design of Buildings is based on a statistical analysis of a large number of seismic response spectra, which is an average result [16–19]. However, the average spectrum is smooth [20, 21], and the peak value is flattened at the same time [22–24]. Although the mid-frequency band satisfies the engineering seismic design requirements to a certain extent, it conceals the characteristics of the maximum amplification factor βmax, and it is difficult to reflect the real ground motion response characteristics of the engineering site [25, 26]. Therefore, this paper abandons the linear form design response spectrum expression to calibrate the site-related response spectrum. Instead, it performs statistical analysis on the shape of the actual site-related response spectrum and then performs segmental fitting using regression analysis to give a curve expression that can truly reflect the spectrum characteristics of each frequency band. Based on the new design response spectrum expression form, a new site-related response spectrum calibration method is proposed with the help of the genetic algorithm.
2. Determination of the Target Spectrum Shape
- (a)
Segment points for the site-related response spectrum are assumed, given segment control period points T1i and T2i parameter values (where i is the number of calculation cycles, i = 1∼n);
- (b)
Regression analysis is performed on the segmented site-related response spectrum curve, and the fitting index R2 is used to determine the expression form of each segmented function. R2 is the fitting index given by the regression analysis, which is used to judge the fitness of the function. The closer the R2 value is to 1, the better the fitting effect;
- (c)
The curve shape determined by regression analysis is used as the target spectrum; then, the genetic algorithm is introduced to calibrate the target spectrum.
3. Genetic Algorithm-Aided Calibration of Inflection Point Periods
3.1. Genetic Algorithm
The genetic algorithm was first proposed in 1975 by Holland in the monograph “Adaptability of Nature and Artificial Systems” [27, 28]. This is a self-adaptive global optimization probabilistic search algorithm that draws on the laws of natural genetics and natural selection in the biological world [29, 30]. In seismic design, the calibration of the response spectrum is essentially a global optimization problem of the multiparameter fitting. The global optimization problem is an important field in the application of the genetic algorithm.
The specific calculation process of the genetic algorithm is as follows:
Suppose the group wants to fit n individuals x1, x2, x3, …, xn;
3.1.1. Initialization
Design cycle counter t = 0; Design maximum cycle upper limit number T; Write n individuals in array form X = [x1,x2,x3,…, xn]. Specify the maximum and minimum values for n individuals: Xmax = [x1max,x2max, x3max,…, xnmax],Xmin = [x1min,x2min, x3min,…, xnmin]; Generate initial random values: According to the formula, s groups of “t-th generation” populations are randomly generated, and the initial value of t is 0.
3.1.2. Individual Evaluation
The fitness function is a criterion used to distinguish between good and bad individuals in a group. Set the population size as S and calculate the fitness function of each individual in the s group and the selection probability of each individual is proportional to its fitness. This fitness function is actually a criterion for calculating the error between the fitted value and the original record β, such as the variance.
3.1.3. Crossover Operation
Among them, b is a random number in the interval [0, 1].
3.1.4. Mutation Operation
Among them, Xmax is the upper bound of gene Xij, and Xmin is the lower bound of Xij; is a random number, t is the current iteration number, Tmax is the maximum evolution number, and r is a random number in the [0,1] interval [31].
3.1.5. Determine the Termination Calculation Conditions
If t (number of iteration cycles) <Tmax (maximum cycle algebra), go to Step 2. If t>Tmax (or objective function Q < 10−5), the optimal solution is the individual with the maximum fitness in the evolutionary iteration process, and the calculation ends at this point.
3.2. Genetic Algorithm Calibration Target Response Spectrum and Characteristic Parameters
In the formula, βi(T) is the calibrated seismic response spectrum.
In this paper, the genetic algorithm is used to find the optimal values of a1, a2, a3, a4, a5, a6, T0, Tg, γ and determine the target spectrum shape so that the value of the function formula (4) is the smallest.
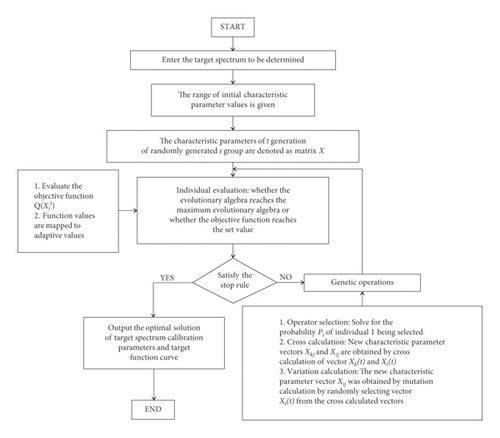
The specific process of genetic algorithm calibration target response spectrum calibration and inflection point period is as follows:
3.2.1. Initial Value
3.2.2. Individual Evaluation
When the maximum evolutionary generation reaches T or the objective function (variance) satisfies < 10−5, the calculation is terminated; otherwise, the calculation is continued.
3.2.3. Operator Selection
In the process of calibrating the target response spectrum by the genetic algorithm, the objective function is fitted with the minimum error of the whole frequency band, and the problem of the minimum value of the objective function is solved. For solving the maximum value problem, the genetic algorithm can directly convert the objective function into a fitness function for optimization calculation. Therefore, in the process of calibrating the response spectrum of the genetic algorithm, the objective function needs to be processed to form a mapping relationship when the value of the objective function is larger, and the value of the fitness function is smaller, and then the calculation can be performed. After completing the mapping conversion, the probability of individual i being selected is .
3.2.4. Crossover Operation
3.2.5. Mutation Operation
3.2.6. Judging Termination Conditions
Evaluate the fitness function of the optimal individual; if the fitness function calculated by the vector is less than the given threshold, the algorithm terminates; if not, turn to step (2) to repeat the calculation until the termination calculation conditions are met. Or preset the number of iterations, output the best fitting solution a1x, a2x, a3x, a4x, a5x, a6x, T0x, Tgx, γx.
The flow chart of genetic algorithm calibration target spectrum and characteristic parameters:
4. Determination of the Design Response Spectrum Shape and the Control Parameters
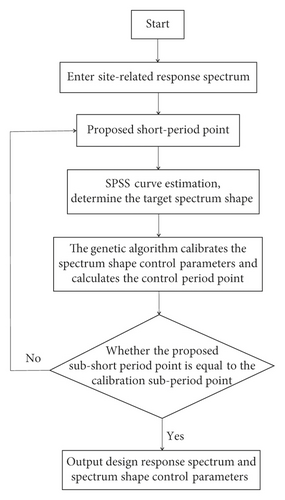
First, comparing the assumed control period points (T1i, T2i) with the characteristic period value calibrated by the genetic algorithm, if the periods are not equal, the control period points are set as the mean value of the genetic algorithm and the assumed control period points (T1i, T2i). The design response spectrum curve expression is determined until assuming that the piecewise control period value is consistent with the calibration period point value (T1i = T0; T2i = Tg; i = 1∼n). Then, the curve expression determined by regression analysis is the expression form of the final designed response spectrum, and the parameters calibrated by the genetic algorithm are the characteristic parameters. Figure 3 shows the calibration process of site-related design response spectra.
5. Applications
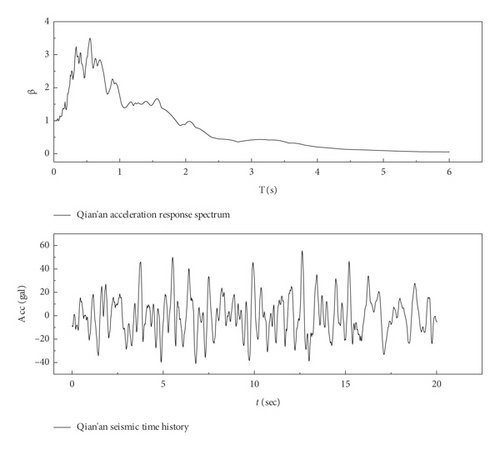
This paper takes the Qian’a earthquake time history obtained from the Tangshan earthquake as an example to carry out practical application research on the method proposed in this paper. Table 1 shows the Qian’a wave information table, and Figure 4 shows the response spectrum and acceleration time history of the Qian’a wave with a damping ratio of 5%.
| Earthquake name | Record name | Site conditions | Earthquake magnitude (M) | Epicenter distance (km) | Peak acceleration (gal) |
|---|---|---|---|---|---|
| Tangshan earthquake | Qian’a wave | II site | 7.8 | 154 | 55.49 |
5.1. Determination of the Shape of the Target Spectrum
According to the spectral shape characteristics of the seismic response spectrum, the values of T11 = 0.10 s and T21 = 1 s are assumed first. Based on the SPSS regression analysis, the piecewise seismic acceleration response spectrum curve is fitted, the mathematical expression of the calibration model of each piecewise is estimated, and the relevant determination coefficient R2 is obtained. Figure 5 shows the fitting diagrams of each segment of the Qian’a earthquake acceleration response spectrum under 11 different functions.
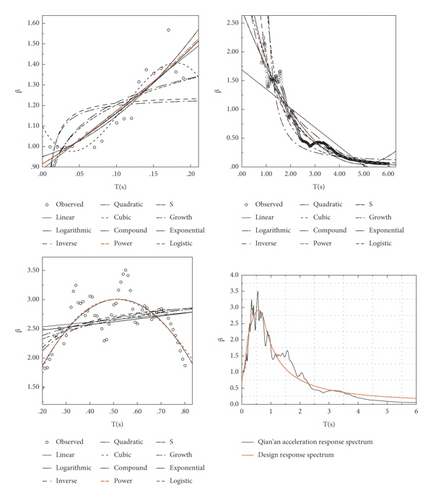
According to the seismic response spectrum curve in Figure 5, the actual seismic response spectrum curve has complex spectrum changes and irregular peak changes in the frequency band where the peak period occurs. The original design response spectrum curve expression cannot objectively describe the response of the mid-frequency site characteristics of the spectrum. Therefore, when determining the reasonable expression form of the calibration model, the regression analysis of each piecewise of the seismic acceleration response spectrum is adopted. According to the calculation results of the regression analysis, it is concluded that the R2 values of the quadratic function and the cubic function are the highest. In the Tg ∼ Tm piecewise, the R2 value of the cubic function and the power function is the largest. Thus, the target spectrum used in this paper is expressed as equation (3).
5.2. Genetic Algorithm Calibration Target Spectrum and Inflection Point Period(T0, Tg)
A genetic algorithm is introduced for calibration. 9 individual parameters need to be fitted in the target spectrum, namely: T0, Tg and γ, and a1, a2, a3, a4, a5 and a6. According to the abovementioned genetic algorithm calibration process, the 9 individual parameters are counted into the algorithm in turn. According to the target spectrum expression, the standard deviation of the genetic algorithm when calibrating the spectrum parameters can be expressed as equation (4).
5.3. Shape of the Design Response Spectrum and Determination of its Control Parameters
The periods T0 and Tg calculated by the genetic algorithm are 0.20 s and 0.79 s, respectively, which are different from the initially assumed periods (T11 = 0.10 s, T21 = 1 s). The average value (mean value: T12 = 0.15 s and T22 = 0.90 s) of the initial and calibrated periods is taken as the piecewise period of the next fitting and then iteratively calibrated until the average period is equal to the piecewise period calibrated by the genetic algorithm. Therefore, the calibration curve of the site-related response spectrum determined by this calibration model combined with the genetic algorithm is the optimal design response spectrum curve expression of the field response spectrum.
Table 2 shows the expression form of the objective spectrum function when the proposed piecewise period is equal to the period point calibrated by the genetic algorithm. For high-frequency band fitting, the quadratic function and cubic function R2 values are the largest. The principle behind the determination of the design response spectrum curve is as follows: For the response spectrum calibration of the entire frequency band, too many unknown parameters will increase the dispersion and fluctuation of the calibration parameters. Considering the efficiency of the algorithm, the quadratic function expression form is therefore selected for calibration in the high-frequency band. The middle frequency band (T0∼Tg section) and the low-frequency band (Tg ∼ Tm section) have the best fitting results with cubic and power functions, respectively. Table 3 shows the design spectrum calibration parameters, and the design response spectrum curve is shown in Figure 5.
| Model R2 value | Linear | Logarithmic | Inverse | Quadratic | Cubic | Composite | Power | S | Growth | Exponential | Logistic |
|---|---|---|---|---|---|---|---|---|---|---|---|
| High-frequency band | 0.814 | 0.604 | 0.280 | 0.884 | 0.884 | 0.840 | 0.635 | 0.301 | 0.817 | 0.817 | 0.817 |
| Mid-frequency band | 0.029 | 0.091 | 0.180 | 0.595 | 0.996 | 0.038 | 0.109 | 0.210 | 0.038 | 0.038 | 0.038 |
| Low-frequency band | 0.791 | 0.924 | 0.937 | 0.950 | 0.954 | 0.930 | 0.963 | 0.760 | 0.930 | 0.930 | 0.930 |
| Calibration parameters | T0 | Tg | γ | a1 | a2 | a3 | a4 | a5 | a6 |
|---|---|---|---|---|---|---|---|---|---|
| Record name: Qian’a wave | 0.20 | 0.79 | −1.29 | 18.38 | 2.70 | −4.43 | −0.09 | 4.55 | 1.17 |
From the final calibration results, it is not difficult to find that the final piecewise period and the calibration inflection point period are the same as the value of the inflection point period in the initial genetic algorithm calibration. The design response spectrum shape is determined by repeatedly comparing the assumed piecewise period and the inflection point period obtained by the genetic algorithm calibration. Through a large number of statistical analyses of the seismic response spectrum, it is found that the regression analysis of each piecewise of the seismic response spectrum is performed at the artificially assumed segmented period point. The calibration model of each segment is estimated, and the calibration model expression form of the design response spectrum always satisfies formula (3). Then, combined with the genetic algorithm calibration, two inflection point periods will not change or vary in a narrow range. It is the process of the proposed piecewise period continuously moving closer to the inflection point period calibrated by the genetic algorithm. According to the spectral shape change characteristics of different frequency bands, regression analysis is carried out to estimate that the calibration models for the high-, medium- and low-frequency bands conform to the expression form of the formula (3), which proves that the selection error of the proposed piecewise point does not influence the response spectrum calibration model, and the expression form of the designed response spectrum curve is stable.
5.4. Comparison of Calibration Results
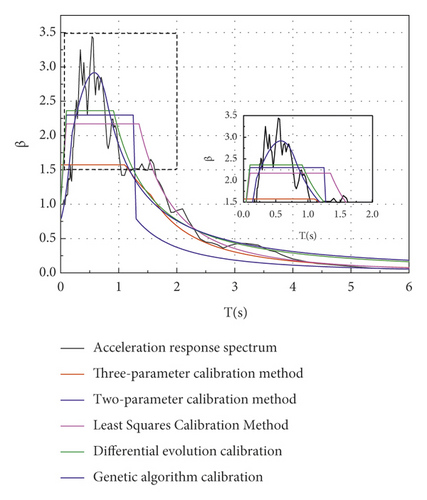
The efficiency of the proposed method is validated against the three-parameter calibration method, two-parameter calibration method, least-square calibration method, and differential evolution algorithm [32, 33]. For the Qian’a earthquake records, the comparison results are presented in Figure 6 and Tables 4 and 5.
| Characteristic parameters | T0/s | Tg/s | βmax | γ |
|---|---|---|---|---|
| Calibration method | ||||
| Three-parameter calibration method | 1.12 | 1.55 | 1.57 | — |
| Two-parameter calibration method | 0.10 | 0.90 | 2.30 | 1.73 |
| Least-squares algorithm | 0.10 | 1.35 | 2.17 | 2.27 |
| Differential evolution algorithm | 0.10 | 0.91 | 2.36 | 1.42 |
| Calibration method | Three-parameter calibration method | Two-parameter calibration method | Least-squares algorithm | Least-squares algorithm | Differential evolution algorithm |
|---|---|---|---|---|---|
| Qian’a earthquake record | 0.62 | 0.67 | 0.61 | 0.28 | 0.14 |
The error between the design response spectrum curve given by the improved design response spectrum calibration model combined with the genetic algorithm and the seismic acceleration response spectrum is the smallest. The curve expression of the design response spectrum curve given in this paper in the middle frequency band truly and reasonably reflects the spectral variation characteristics and peak characteristics of the seismic response spectrum and reduces the discreteness caused by the platformization of the design response spectrum calibration. To verify the feasibility of this method in the seismic safety evaluation of engineering sites, the next part selects an engineering example in an earthquake safety evaluation report for calculation and compares the values of the characteristic parameters.
5.5. An Engineering Example
A hospital building is planned to be built in Tangshan city, the project is located in the VI fortified area of China, and the site category is a Class I site. The bedrock acceleration peaks and response spectra under the 50-year, 2%, 10%, and 63% probability of exceedance given in the seismic hazard analysis report are taken as the objective functions to artificially synthesize the bedrock ground motion time history and input separately to carry out the site seismic response analysis. The calculated horizontal acceleration response spectra are used for calibration by the two-parameter method, the least-square method, the differential evolution algorithm, and the improved genetic algorithm [32, 33]. The fitting results are shown in Tables 6–11 and Figure 7.
| Exceeding probability | βm | T1/s | Tg/s | γ |
|---|---|---|---|---|
| 50a-2% | 2.50 | 0.10 | 0.50 | 0.90 |
| 50a-10% | 2.50 | 0.10 | 0.35 | 0.90 |
| 50a-63% | 2.50 | 0.10 | 0.25 | 0.90 |
| Exceeding probability | βm | T1/s | Tg/s | γ |
|---|---|---|---|---|
| 50a-2% | 2.11 | 0.10 | 0.44 | 1.18 |
| 50a-10% | 2.79 | 0.10 | 0.42 | 1.15 |
| 50a-63% | 2.79 | 0.10 | 0.25 | 1.35 |
| Exceeding probability | βm | T1/s | Tg/s | γ |
|---|---|---|---|---|
| 50a-2% | 2.08 | 0.10 | 0.46 | 1.14 |
| 50a-10% | 2.79 | 0.10 | 0.40 | 1.05 |
| 50a-63% | 2.90 | 0.10 | 0.21 | 1.28 |
| Exceeding probability | βm | T1/s | Tg/s | γ |
|---|---|---|---|---|
| 50a-2% | 2.32 | 0.13 | 0.36 | 0.89 |
| 50a-10% | 2.49 | 0.08 | 0.34 | 1.18 |
| 50a-63% | 3.15 | 0.12 | 0.23 | 1.18 |
| Characteristic parameters | T0 | Tg | γ | a1 | a2 | a3 | a4 | a5 | a6 |
|---|---|---|---|---|---|---|---|---|---|
| Exceeding probability | |||||||||
| 50a-2% | 0.15 | 1.09 | −1.16 | 23.45 | 12.22 | −20.12 | −15.44 | 3.29 | 3.20 |
| 50a-10% | 0.14 | 0.95 | −1.18 | 19.13 | 15.46 | 4.31 | −5.27 | −0.95 | 3.26 |
| 50a-63% | 0.14 | 0.18 | −1.15 | 23.45 | 11.83 | 2.78 | −4.25 | −0.29 | 2.85 |
| Calibration method | Genetic algorithm | Two-parameter calibration method | Least-squares calibration | Differential evolution algorithm | ||||
|---|---|---|---|---|---|---|---|---|
| Exceeding probability | Standard deviation | |||||||
| 50a-2% | 0.15 | 1.09 | −1.16 | 23.45 | 12.22 | −20.12 | −15.44 | 3.29 |
| 50a-10% | 0.14 | 0.95 | −1.18 | 19.13 | 15.46 | 4.31 | −5.27 | −0.95 |
| 50a-63% | 0.14 | 0.18 | −1.15 | 23.45 | 11.83 | 2.78 | −4.25 | −0.29 |
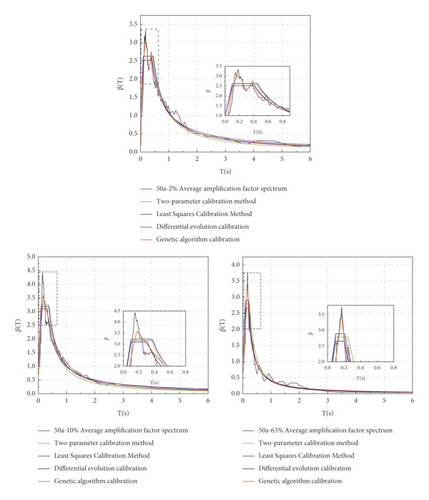
Figure 7 shows that the spectrum shape obtained by the improved genetic algorithm is close to the average amplification factor at each probability level. The platform value βmax given in the seismic safety evaluation report of the engineering site is taken as 2.5, which lacks rationality. The calibration parameters given in this paper are not constant values of βmax. The shape of the design response spectrum is controlled by 9 different characteristic parameters given by the calibration, and a clear mathematical expression of each piecewise of the design response spectrum can be given according to the calibration parameters. Second, comparing the given site ground motion parameters, the site characteristic period and attenuation index given in this paper are larger than those in the engineering site safety evaluation report. The calibration method takes into account the variability of the first inflection point period and the expression of the design spectrum. It reasonably reflects the peak characteristics of the power amplification coefficient spectrum.
- (1)
The expression of the design response spectrum is not limited to the traditional three-section platform expression but is given based on the shape characteristics of the actual seismic acceleration response spectrum.
- (2)
The design response spectrum changes from the original four calibration parameters to 9 calibration parameters. The increase in the parameters improves the calibration accuracy of the design spectrum shape to a certain extent.
- (3)
The curve expression of the design spectral response spectrum objectively and reasonably reflects the influence of local site conditions and the seismic, geological environment on the spectral characteristics of the site-related response spectrum.
6. Conclusions
The calibration of the design response spectrum should not only meet the requirements of seismic engineering design but also fully consider the influence of the geological conditions and the seismic environment in the project site area to obtain the ground motion parameters more in line with the project site. In this paper, the site-related response spectrum calibration method is proposed, which improves the influence of the expression of the original design response spectrum platform section peak clipping on the design response spectrum calibration. The design response spectrum expression and characteristic parameters objectively reflect the site condition to a certain extent. The spectral characteristics of the relevant response spectrum and the influence of the site-specific soil geological conditions on the ground motion parameters provide a reference for future research on the calibration of the site-related response spectrum. However, the calibration method given in this article is currently mainly aimed at the calibration of the relevant response spectrum of major engineering sites and a single seismic acceleration response spectrum. For a large number of industrial and civilian buildings in China that do not need to be evaluated for the seismic safety of engineering sites, the seismic fortification of such buildings is mostly calculated according to the design response spectrum expression given in the “Code for Seismic Design of Buildings” (GB50011-2010). For the seismic fortification of such buildings, proposing a new design response spectrum expression that is in line with the code site classification and seismic design requirements and providing a new reference basis for seismic design are problems that still need further research and discussion.
Conflicts of Interest
The authors declare that they have no conflicts of interest.
Acknowledgments
This study was supported by Earthquake Science and Technology Project of Gansu Earthquake Agency(KY2021M3), https://doi.org/10.13039/501100001809National Natural Science Foundation of China (51508096) and (51808118), and Key Talent Project of Gansu Province: Research on Key Technologies for Rapid Assessment of Building Earthquake Damage with Radar Data in Northwest China.
Open Research
Data Availability
All the data are from the strong earthquake records obtained from the actual observation of previous earthquakes.


