[Retracted] Design and Implementation of College Students’ Physical Fitness Test Management System Using IoT Smart Sensors
Abstract
As science and technology continue to advance and life standards continue to improve, poor living and study habits are common among today’s college students, making their physical health deteriorate. At present, the physical fitness test management system of college students is not perfect. This paper studies the physical fitness test administration system for college students based on IoT smart sensors. It first briefly introduces the design of the physical health test management system and then proposes the IoT smart sensor network algorithm. With the rapid development of IoT, WSN has also grown rapidly as an important technical form of the underlying perception layer of the IoT. Then, this paper tests the data of the college students’ physical fitness test management system under the Grey Relational analysis, and finally, it conducts an experimental discussion on the realization and testing of the college students’ physical health management system. The experimental results of this paper showed that the college students’ physical fitness test management system through the Internet of Things smart sensor can quickly respond to the visits of multiple clients, with relatively high processing efficiency, and the efficiency is increased by 60%. The practical interface designed and implemented by this system has excellent practicality. The system interface uses a light blue background, which has good comfort in application, and the system has complete functions, which can meet the general requirements of university system health management.
1. Introduction
As the successor and mainstay of contemporary socialism, promoting the development of students is the starting and final focus of school work. The State Council further emphasized the importance of the development of physical health of young people, clearly stating that in the physical and mental health of young people, strong physical fitness is a symbol of civilized society, which is a key facet of the country’s overall power. It can be seen that there is a close relationship between youth physique and national development. The State Council has also promulgated relevant documents for school sports work, fully demonstrating that school sports work has become a national strategy, and these measures will surely further promote the reform and development of school sports work. Improving the physical quality of students within the scope of colleges and universities and comprehensively assessing the physical health of college students are conducive to improving students’ understanding of their own physical fitness and urging them to participate in physical exercise.
In recent years, research on physical fitness has developed rapidly, but there are few studies on the management of physical fitness testing. It mainly conducts horizontal and vertical research on the related concepts and status quo of students’ physical health. On the premise of abundant “research on management mechanism,” it is of certain theoretical significance to build a more complete new mechanism of adolescent physical fitness test management by drawing on relevant theoretical knowledge and other disciplines. This paper studies the college students’ physical fitness test management system based on the Internet of Things intelligent sensor, aiming to provide reference for the construction of the college students’ physical fitness test management system.
Physical fitness test can detect the quality of a person’s physical fitness. In the current era of information networking, people often do not pay attention to their bodies. Especially in young people, lack of exercise also makes the incidence of disease higher and higher. Therefore, physical fitness testing has also become a hot research topic. The traditional health physique test has the characteristics of complicated operation and low efficiency. Lu et al. designed a set of health-related physical fitness testing methods for college students based on smart mobile terminals [1]. Wang and Chen mainly discussed the computer vision-based design of student fitness measurement system and analysis system of test data [2]. Huang et al. proposed that laboratory-based measures of fitness components could be used to predict WTST [3]. The aim of Melchiorri et al. was to describe a combined test to assess physical efficiency in a healthy Italian older cohort and to provide an overview of the physical progression of locomotor skills in various age classes. Due to its simplicity and applicability, test batteries have been proven to be a valuable tool for assessing multiple aspects of physical fitness in older adults [4]. They have done various researches on physical fitness and achieved relatively good results, but they did not focus on young people, which also caused the experimental results to be inconsistent with the current status quo. The study found that the IoT smart sensor-based physical fitness test administration system for college students has good results.
Several scholars have also made corresponding studies on smart sensors for the Internet of Things: Gabriella presents a novel industry compares for the calibration of intelligent grid transducers for conventional and nonconventional voltage and current transducers in the voltage spectrum from DC to several dozen kHz frequencies. Its precision performance allows the calibration of class 0.1 sensors under both sinusoidal and nonsinusoidal conditions [5]. The main contribution of Herrera-Quintero et al. is the development and realization of a prototype of intelligent sensors for ITS (Intelligent Transportation Systems). The prototype integrates and incorporates an IoT approach using serverless and microservice frameworks to help Bus Rapid Transit’s (BRT) transportation programming system [6]. Dissanayake et al. concentrated on devising a transducer that measures fluoride and hardly in well water through an auto regime. Here, a simple colorimetric method was employed to develop the proposed optical sensor, using SPADNS reagents and a complexometric titration of the color change procedure [7]. They all explained the application of smart sensors in various fields well and achieved good results, but this paper studies the statistics of smart sensors in physical fitness test data and the establishment of models, which is inconsistent with current research hotspots.
This article investigates the physical performance test management system for college students supported by intelligent sensors based on the IoT. Through experiments, it is known that the college students’ physical fitness test management system based on the IoT smart sensor can quickly respond to the visits of multiple clients, which has a very high processing effect, and its efficiency is increased by 60%. Through systematic analysis and comprehensive evaluation, students can have a more intuitive understanding of their physical health status. At the same time, suitable teaching arrangements can be made for students with different physical conditions to improve the teaching effect.
The innovation of this paper is reflected in the following: (1) it analyzes and introduces the design of the physical health test management system; (2) it expounds the algorithm of the Internet of Things intelligent sensor network and introduces the gray correlation analysis; (3) it conducts experimental analysis on the realization of college students’ physical health management system. We provide additional explanations in the introduction section of the paper.
2. Design and Implementation Method of College Students’ Physical Fitness Test Management System Based on IoT Smart Sensors
2.1. Design of Physical Fitness Test Management System
In the college students’ physical health test system, considering the system convenience and maintenance cost, the B/S structure is mainly used in the system platform architecture, which is also the more popular software architecture at present [8, 9].
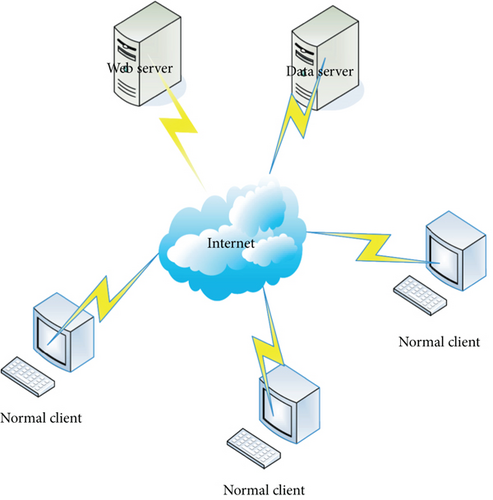
The B/S structure includes a browser, a Web server, and a database server, as shown in Figure 1. Among them, part of the transaction logic is completed in the front end, while the server side completes the main transaction logic. The data interaction between the browser and the database is completed by the Web server, so that the system users can use the browser to send their own requests to the server. The server performs query processing on the request and then feeds back the processing result to the system user. In this way, the client only needs to configure simple client software, and the work is simpler. The client only needs to complete simple operations, and the performance requirements for the client are greatly reduced, which also avoids the maintenance personnel from taking too heavy maintenance tasks on the client. The server needs to process all requests sent by the client, access the database, etc., which is a heavier burden than the client [10].
- (1)
The use cost and technology are simple
- (2)
The data security is high
Under the B/S architecture, all data are stored on a centralized database server, and clients do not need to store business-related data, nor do they need to store database links [13]. In this way, the security of the data is further guaranteed. Based on the physical fitness test-related request of college students in this paper, the framework diagram of the system design is shown in Figure 2.

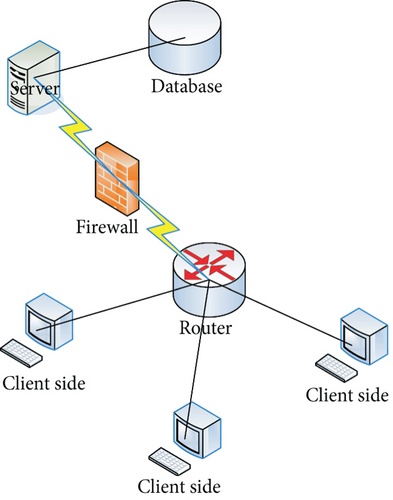
The primary subscribers in the structure of this system are students, faculty, and administrators. The application is classified into user interface layer, application service layer, and data layer [14]. The basic structure of the system network hardware is shown in Figure 3.
2.2. IoT Smart Sensor Network Algorithms
With the rapid development of IoT, WSN has also grown rapidly as an important technical form of the underlying perception layer of the IoT. Many sensors form a smart sensor network in a static or dynamic state, which adopts a self-organizing and multihop structure [15]. In the scope it covers, each sensor node senses and collects the information of the sensed object, processes it, transmits it, and finally accepts it by its owner [16]. The network nodes will automatically compress the collected data and periodically send the collected data to the Internet cloud computing platform. At the same time, the data in the cloud is regularly updated, which can reduce the storage and processing requirements of the sensor, reduce the storage capacity of the sensor, and reduce the power consumption of the sensor. Inexpensive, compact, and low power consumption are important features of sensing nodes. Sensor nodes in WSN have functions such as sensor, data processing, and communication [17].
2.2.1. LED Lightweight Encryption Algorithm
The serpent-type S box is used in the LED encryption algorithm. The maximum difference probability and the linear approximation deviation of the algorithm are both 2-2. The row shift is in the form of a circular left shift j nibble, so that 4 of each column can be scattered into 4 different columns. The LED uses a maximum distance-divisionable code matrix based on a single nibble-level linear feedback shift register. In hardware implementation, only one nibble-level LFSR needs to be implemented, so the required area is relatively small [18]. In hardware implementation, only one nibble-level LFSR needs to be implemented, so the required area is relatively small.
LED-64 is the master key that uses 64bit repeatedly, and the round key is to regard the master key as the sequence P0, P1, P2, P3 of nibble.
2.2.2. SM2 Algorithm and SM4 Algorithm
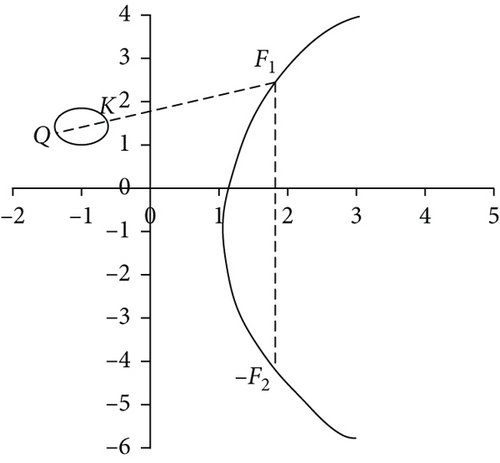
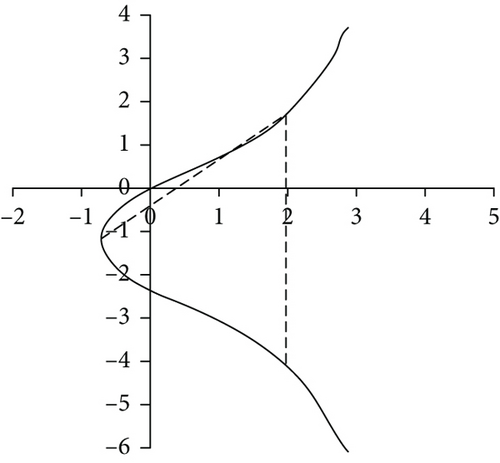
(1) SM2 Algorithm. ECC is an ECC algorithm based on the discrete logarithm problem of point groups on elliptic curves. The elliptic curve equation used by the SM2 algorithm is b = a3 + xa + y. After the coefficients x and y are determined, the unique curve is determined. The advantages of SM2 algorithm are mainly security, low memory size, and quick signal speed. As a kind of public key operator, the SM2 operator can implement signature, signature verification, encryption and decryption, and key negotiation.
Among them, w, p, t, x, y all belong to finite fields GS(q). The set of points on the elliptic curve includes the set of all points (a, b) in the above equation and an infinite point O. The infinite point O is a special point on the set of elliptic curve points, which does not exist on the elliptic curve E. If three points belonging to the set of elliptic curve points lie on a straight line, then the sum of these three points is 0. Figure 4 is an example of two commonly used elliptic curves.
- (i)
Addition operation rules: set x1, x2 ∈ FP, then,
- (ii)
Addition rules: set x1, x2 ∈ FP, then,
- (1)
Sm4 encryption and decryption algorithm: assuming that the input plaintext N is , the output ciphertext is , and the round key is , then the encryption process of the SM4 algorithm is
- (2)
Key expansion algorithm: assuming that the encryption key is NR 1 and the round key is 2, then the algorithm for generating the round key is
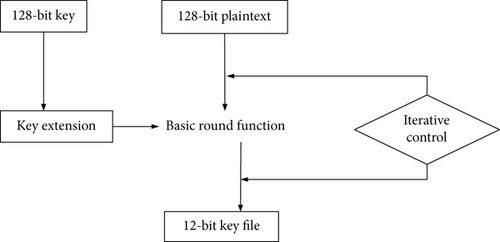
Among them, D′ is basically the same as D in the round function in the above SM4 algorithm encryption and decryption algorithm.
Typical application scenarios of smart sensor networks are as follows:
The target parameters observed in the detection range, such as the intelligent sensor network for monitoring and monitoring of grassland, forest, ocean, and other environments, can realize the monitoring of air humidity, temperature, atmospheric pressure, etc. at a specific location or region. On the sensor node, a variety of sensing devices can be installed, and different information can be received at the same time, and the obtained signals can be collected and analyzed according to different sampling speeds.
In the detection of things of interest and estimates of their associated parameters, for example, in WSN applied to traffic, the sign of the trigger event is that the vehicle travels to the monitoring area, and the sensor node records the license plate, running direction, and speed of the vehicle passing through the detection area. The sensing module of the sensor node is set to a working state, and an event-triggered threshold is set. When the acquired data reaches the preset threshold, other control modules will be triggered, and then the acquired data will be processed.
Classify and identify observations. For example, classification detection of systems with incomplete or incomplete information. In this paper, a data test is made for the management system of college students’ physical fitness test under the Grey Relational analysis.
2.3. Grey Association
Grey Relational degree analysis is an important content in the study of Grey system theory. The Grey Relational degree analysis first collects the original evaluation indicators and then uses the dimensionless method. The obtained data are in the [0,1] interval and form a matrix. It obtains the correlation coefficient matrix by solving the correlation coefficients between the indicators in the rows and columns of the matrix. Then, the weight of each indicator is calculated, and it is combined with the correlation coefficient to obtain the correlation between each indicator and comprehensively sort them. Grey correlation analysis is a comprehensive evaluation method that has been widely used in multi-index comprehensive evaluation in recent years. Before the systematic Grey Relational analysis, the features and factors were sorted. The following are some definitions.
2.3.1. Grey Correlation Factor
Assuming that there is a system factor Aj in the system, the observation data at the position of serial number r is aj(r), r = 1, 2, ⋯m; at this time, we call Aj = {aj(1), aj(2), aj(3) ⋯ aj(m)} is the behavior sequence of the factor. If the serial number r represents a time, an indicator, or an object number, Aj is called a behavior time series, a behavior index series, or a behavior horizontal series. No matter what kind of sequence data, Greyscale correlation analysis can be performed. If the system factor has a dimension, it needs to be dimensionless first, and the negative correlation factor is transformed into a positive correlation factor, and then further processing is carried out.
- (i)
Initialization:
- (ii)
Average:
- (iii)
Interval value:
In these three transformation methods, t1, t2, t3 are called an operator. Corresponding to different methods, they are the initial value operator, mean value operator, and interval value operator. These operators can have dimensionless behavior sequences, but cannot be mixed. Only one of them can be selected for being dimensionless according to the needs of the actual problem. After transformation, these values can be called Grey correlation factors.
2.3.2. Calculation of Grey Relational degree
In the Grey system, we use the concept of Grey correlation degree to reflect the degree of correlation between different system factor sequences and feature sequences. In the Grey system space, the Grey Relational mapping is often not unique. Therefore, the degree of association cannot be simply described by the size of the grey relational degree, but is mainly described by sorting the grey relational degree and using the sorting result. There are several steps to calculate the Grey Relational degree:
First, determine the system sequence.
Second, find the difference sequence among the original serial and the sample serial.
3. Experimental Results of the Design and Implementation of College Students’ Physical Fitness Test Management System Based on IoT Smart Sensors
3.1. System Database Design
The concept of database is to integrate data information into an independent logical structure and organize and manage data according to the data structure. The database is the “warehouse” of the system, and its design has a great impact on the performance of the software. The system uses SQL Server 2008 as the database on the server side. Combined with the specific application of this subject, the main design data of the database are obtained, as shown in Table 1.
| Serial number | Table name | Alias | Illustrate |
|---|---|---|---|
| 1 | S-TAB | Student information sheet | Store basic information of student users |
| 2 | TEST-TAB | Physical fitness test form | Store physical fitness test related content |
| 3 | SA-TAB | Statistical analysis table | Store the relevant results of statistical analysis on student physical data |
3.1.1. Student Information Sheet
The student information table is mainly used to store the student’s login name and password, as well as the student’s college, major, and course selection information, as shown in Table 2.
| Field name | Illustration | Data length | Is it empty | Primary key |
|---|---|---|---|---|
| ID | Numbering | 15 | No | No |
| NAME | Student name | 50 | No | Yes |
| PASS | Student login password | 10 | No | No |
| ROLE | Student category | 10 | No | No |
| SEX | Student sex | 10 | No | No |
| MAJOR | Student major | 50 | No | No |
| INSTITUTE | Affiliated college | 100 | No | No |
| COURSE | Selected course | 100 | No | No |
3.1.2. Physical Fitness Test Table
The physical fitness test table is mainly used to store data related to various physical fitness test items, including test number, test name, test content, test standard, test time, result, and description. Its logical structure is shown in Table 3.
| Field name | Illustration | Data length | Is it empty | Primary key |
|---|---|---|---|---|
| ID | Test number | 15 | No | No |
| NAME | Test name | 50 | No | Yes |
| CONTENET | Test content | 600 | No | No |
| STD | Test standard | 10 | No | No |
| TIME | Test time | 30 | No | No |
| RESULT | Test result | 20 | No | No |
| DESCRIPTION | Describe | 600 | Yes | No |
3.1.3. Reservation Information Form
Reservation information table, as shown in Table 4.
| Field name | Illustration | Data length | Is it empty | Primary key |
|---|---|---|---|---|
| Number | Student ID | 15 | No | Yes |
| NAME | Name | 50 | Yes | No |
| DATA | Appointment time | 60 | Yes | No |
| TYPE | Reservation project | 10 | Yes | No |
3.2. Implementation and Testing of Physical Health Management System
3.2.1. Basic Flow of Program Operation
According to the overall functional design of the physical fitness test management system, before entering the system for examination and management, the system will verify and identify the logged in users. Whether it is a candidate exam or a teacher management, identity verification should be carried out first. The main operation flow of the system is shown in Figure 6.
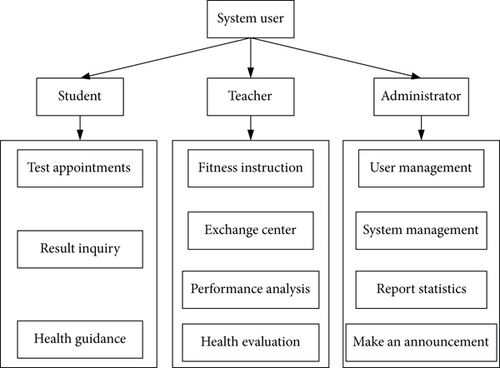
After the student user logs in successfully, enter the exam reservation page, and the teacher will conduct the corresponding physical health test for the student during the reservation time. After the test is completed, the teacher will enter the corresponding test scores into the system, and the system will give a test report according to the test scores. Teachers will also give corresponding fitness guidance according to different students’ physical health conditions. Once the teacher user input his account code, he successfully signed into the system.
According to the actual needs of teachers, it should have management functions, including adding, modifying, deleting users, and managing grades. After the system completes the health evaluation and diagnosis, teachers need to analyze it and give corresponding guidance.
Administrator users can implement basic operations such as adding, deleting, and modifying teacher users and student users. In addition, they can complete the setting and management of system-related information.
3.2.2. Realization of the Main Functional Modules of the System
The main function of the system is to facilitate the physical health management of college students, so that students, teachers, and managers can easily understand the physical health of students, which provides more accurate and detailed theoretical basis for physical exercise and physical education of students and teachers. At the same time, it can also be provided to the relevant functional departments to give qualitative evaluations of students’ physical health and provide positive help for the management of students’ physical health test scores.
The system mainly consists of modules such as system administration, test appointment, user administration, fitness instruction, communication center, achievement control, message distribution, and fitness evaluation. Among them, user management, performance management, and health assessment are the main contents of the entire system. User management includes user login, user registration, password modification, and permission setting. Score management includes modules such as score query, score analysis, and score statistics. Through the health evaluation module, scientific analysis can be carried out according to the students’ sports test results, and the correct physical health report can be obtained, and then according to the report, the exercise methods and sports programs suitable for the students can be formulated.
3.3. Health Evaluation and Diagnosis
At present, various colleges and universities mainly measure the physical health of college students by testing different sports, and then experienced teachers evaluate students’ physical health according to the test results. This method is highly subjective, and the importance of the test indicators is determined artificially, which may lead to obvious deviations in the evaluation of students’ physical health. Aiming at the shortcomings of the existing physical health evaluation, this study proposes to use the Grey correlation degree to analyze and comprehensively evaluate the results of the students’ physical health test. On the one hand, it is beneficial to reduce the subjectivity of evaluation, and on the other hand, the weight of each indicator on physical health is calculated, which greatly improves the accuracy of evaluation.
This article takes the sports measurement data of 5 college students in 2020 as an example to explain the process of the health evaluation method. The raw data of the test is shown in Figure 7, and the Quetole index is the value obtained by the student’s weight (kg)∗1000/height (cm). For students in grade 20, their standard Quetole index is basically stable. The index can be used to evaluate the body shape of college students. Grip strength BMI and standing long jump can reflect the physical fitness of college students. The larger the value, the better their physical fitness. The ladder test and vital capacity BMI are important indicators to measure the physical fitness of college students. The closer the two are to the limits of their peers, the better their physiological functions. In the figure, the Cetole index is represented by A, the grip strength body mass index is represented by B, the standing long jump (m) is represented by C, the step test index is represented by D, and the vital capacity body mass index is represented by E.
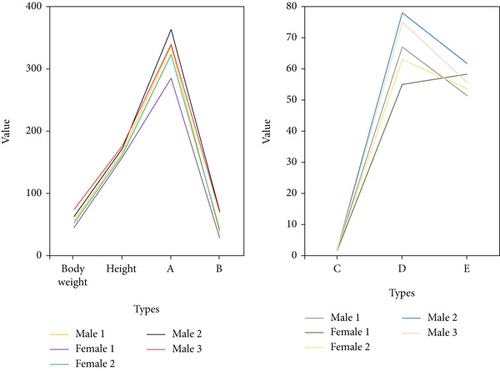
In the figure, taking the test scores of boys and girls of the same age and sex as the standard model value, the Grey correlation analysis was carried out on the index measurement scores of the college students to be tested. Finally, the comprehensive correlation degree of each index is obtained, and the physical health status of college students is determined by its value. The Grey Relational analysis method refers to a method that is affected by a variety of factors and uses the Grey Relational degree of the factor pair to express the influence of the pair. Grey Relational analysis means that r0 is influenced by multiple factors rn, and the Grey Relational degree of factors rn to r0 is used to express the influence of rn to r0.
Before the Grey Relational analysis, the raw data of the test is preprocessed, the standard mode is r0 = (r01, r02, r03, r04, r05) = 347,92,2.66,82,84, and rnl = min{rnl, r0l}/max{rnl, r0l} can be obtained by dimensionless processing. r0 is the reference sequence; r1, r2, r3, r4, r5 are the comparison sequence. Subtract the elements corresponding to the comparison sequence and the reference sequence to obtain the absolute value of the difference, denoted by ∆n. Then, in the comparison sequence rn, for the reference sequence r0, the maximum difference and the minimum difference between the two poles are, respectively, expressed as follows: Q = maxnmaxl∆nl. Then the Grey Relational degree at point l can be defined as w(r0l, rnl) = (q + βQ)/(∆nl + βQ). Where 0 ≤ β ≤ 1 is the resolution constant, the larger the value, the greater the resolution, and vice versa. Normally, set the resolution constant β = 0.5. Figure 8 can be obtained by dimensionless processing of the above figure, and reference sequence r0 = (1, 1, 1, 1, 1) at the same time.
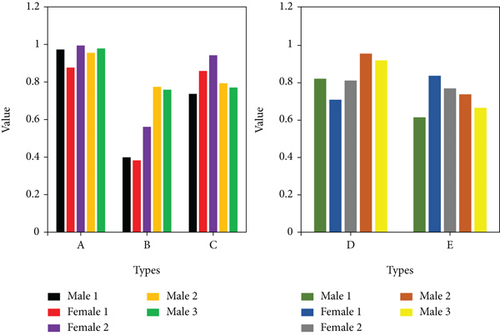
Calculate the absolute value difference; you can get Figure 9.
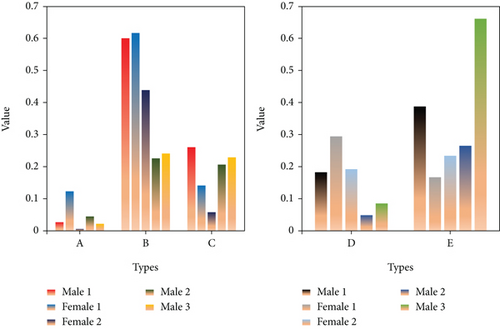
Among them, Q and q can be calculated as: 0.6619 and 0.0059, respectively, and the Grey correlation between the measurement data of college students’ physical health index and the standard mode value can be calculated, as shown in Figure 10. Combining the weights of each measurement index obtained above, the correlation between body shape, athletic ability, and physical function can be calculated, and then the comprehensive correlation value of each student can be calculated.
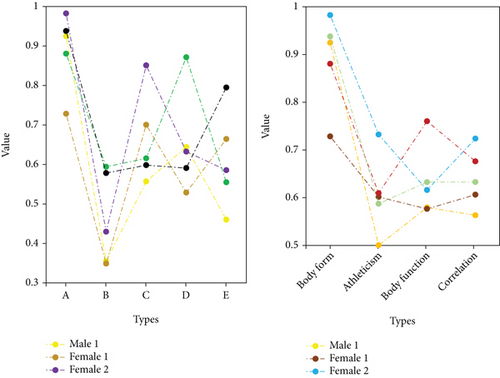
Taking student male 1 as an example, based on the Grey correlation value, its health level can be analyzed. Due to the large Grey correlation value in terms of body shape, the student’s body shape is good, but there are deficiencies in athletic ability and physical function. Then, experts can use this table as the basis for students’ health judgment, combine their own experience, conduct health assessment for different students, and give corresponding physical exercise advice. Then, experts can use this table as the basis for students’ health judgment, combine their own experience, conduct health assessment for different students, and give corresponding physical exercise advice.
Students can learn about their own health status based on the content of the health diagnosis. The health evaluation method in the system is used to obtain the health diagnosis opinions of the students participating in the test, and the teachers give exercise prescriptions according to the health evaluation opinions, which are used to guide the students to carry out corresponding exercise and exercise according to their own physical conditions, so as to enhance the physical health of the students.
3.4. System Test
The purpose of system testing is to check whether the software system implemented by programming meets the requirements, and it is the final review and verification of the results of the entire system development stage. In the development process of the system, although all stages of development have been checked, there are inevitably some omissions, and the legacy of these problems may eventually lead to problems or even paralysis of the system during operation. Therefore, after the system development is completed, the final test of the system is required to find more problems. It can be said that software system testing is to find problems in the software. This paper will introduce and analyze the physical health management system of college students from the aspects of the system’s operating environment and functional testing.
3.4.1. System Function Test
In this paper, the functional testing of the system mainly includes testing of system installation/uninstallation, system interface, functional modules, security, and so on. In terms of functional testing, data verification testing and white-box testing are used to test whether each system function meets the requirements.
This article has tested the basic installation and operation of the system. The test situation is as follows: No errors were found during the installation and script running of the system; the server and client programs installed on the Windows 7 operating system, including the code and related content, are correct; the test is installed on computers with different hardware configurations; the system does not find errors and can start and run normally through the configuration. When there is a problem with the system operation, such as insufficient disk space, the system can capture the occurrence of the error, give the user an error prompt, and exit the system normally. From the above test situation, it can be found that the basic operation of the system is normal. Test of system operating interface: The operating interface designed and implemented by the system has good operability. The system interface adopts light blue design, which has better comfort during use. The system has complete functions, which can meet the basic needs of institutional health management in colleges and universities.
3.4.2. System Performance Test
In the aspect of system performance test, it mainly evaluates the security and stability of the system.
In terms of security, the database of the system does not allow direct operations but can only be accessed through the system, including adding, modifying, and deleting database data. The system has done strict authorization control management, and different users have different levels of authority. Only authorized users can perform database operations, and nonauthorized users can only query data, which ensures that the system has good security.
Stability mainly means that the system is not prone to errors during operation or can catch the corresponding errors and handle them appropriately. During the test, the system did not exit abnormally due to errors. In addition, by configuring multiple client programs to access the system server at the same time to test the processing and response speed of the system. The test results showed that the system can quickly respond to the access of multiple clients and has high processing efficiency, which increases its efficiency by 60%.
The performance test results of the system show that the system has good effects in terms of security and stability and can meet the basic functional requirements and performance requirements of college students’ physical health test.
This paper starts from the overall goal of physical fitness test management and explains the main functional requirements of the system. It divides the system function modules, gives the detailed system realization, and tests it. Ultimately, this paper will implement a set of high-efficiency college students’ physical health management system, comprehensively evaluate and analyze students’ physical status through students’ physical fitness test results, and provide corresponding decision-making opinions.
4. Conclusions
To address the current problems of physical health of college students, this paper has combined IoT smart sensors and Grey system theory to assess and manage the physical health problems of college students. A set of monitoring and management system for college students’ physical health problems has been realized, which can better help the implementation of the national college students’ physical health standards and urge students to realize the importance and necessity of physical exercise and physical fitness. The college students’ physical health test management system realized in this paper has very important practical significance. It enables students to have a more intuitive understanding of their physical health status through systematic analysis and comprehensive evaluation. In this way, teachers can adjust the teaching content and teaching methods in a more targeted manner, make appropriate teaching arrangements for students with different physical conditions, improve the teaching effect, and truly achieve a purpose. The next work of this paper will further optimize the physiological health assessment method, improve the realization of the program and algorithm, and develop the multiplatform interactive use, so that the system has more generality and practical application significance.
Conflicts of Interest
There is no conflict of interest.
Acknowledgments
This work was supported by Hunan Education Department Scientific Research Project: Research on the Development of Public Fitness Informatization O2O Model in Hunan Province (No. 19K015); the Educational Reform Project of University of Electronic Science and Technology of China: Freshman Project Courses: Physical Enhancement and Functional Training (No. 2019PBLF029); and the Ministry of Education, PRC: “Internet +” Era College Physical Education Teachers Professional Development Ability Training (No. 202101275011).
Open Research
Data Availability
The datasets generated during and/or analyzed during the current study are available from the corresponding author on reasonable request.


