Determination of Nitrofuran Metabolites in Complex Food Matrices Using a Rough, Cheap, Easy-Made Wooden-Tip-Based Solid-Phase Microextraction Probe and LC-MS/MS
Abstract
In this study, a rough, cheap, easy-made wooden-tip-based solid-phase microextraction (SPME) probe was first developed for simultaneous determination of 4 nitrofuran metabolite derivatives in complex food matrices via LC-MS/MS. A simple dip-coating method was used to coat wooden tips with biocompatible polyacrylonitrile (PAN) and N-vinylpyrrolidone-co-divinylbenzene, also known as HLB particles, which served as the extractive substrate in the proposed device. Compared with the traditional solid-phase extraction (SPE) method, the proposed device shortens sample clean-up time, reduces solvent consumption, and decreases testing costs. In addition, the main parameters affecting the SPME procedure efficiency were investigated in detail and the optimal conditions were found. The method was validated using three different food matrixes (pork, croaker, and honey) by spiking with the four metabolites at 0.5, 1.0, and 5.0 μg/kg, as well as their internal standards. The average recovery of all nitrofuran metabolite derivatives ranges from 97.4–109.5% (pork), 87.5–112.7% (croaker), and 98.6–109.0% (honey). Relative standard deviations were all <10% for intraday and interday precision. The values of limit of detection and limit of quantification were, respectively, ranging from 0.011 to 0.123 and 0.033 to 0.369 μg/kg (pork), 0.009 to 0.112 and 0.027 to 0.339 μg/kg (croaker), and 0.010 to 0.131 and 0.030 to 0.293 μg/kg (honey). The presented method was applied to the analysis of real positive samples.
1. Introduction
Nitrofurans (NFs) are a group of synthetic broad-spectrum antibacterial drugs with a 5-nitrofuran ring skeleton structure [1]. They have been widely used as feed additives in poultry, livestock, honey bee, and aquaculture to promote growth or as antimicrobial agents to control diseases caused by Salmonella and E. coli infections [2]. The nitro group, located in the 5-C position of the furan ring, contributes most to bactericidal activity. The metabolic activation of NFs is achieved through enzymatic reduction of the nitro group catalyzed by nitroreductase. Once activated, enzymes involved in the degradation of glucose and pyruvate are inhibited, accompanied by a decrease in bacterial activity [3]. Furazolidone (FZD), furaltadone (FTD), nitrofurantoin (NFT), and nitrofuranzone (NFZ) are the most commonly used NFs in animal production [4]. These drugs exhibited a short half-time in animals after ingestion and could be rapidly transferred to their respective metabolites: 3-amino-1,3-oxazolidin-2-one (AOZ), 1-amino-hydantoin (AHD), 3-amino-5-(4-morpholinyl-methyl)-1,3-oxazolidin-2-one (AMOZ), and semicarbazide (SEM) [5–9]. These metabolites can bind to proteins to form stable structures and remain in the animal body for an extended period and can be released from the tissues only under acidic conditions [8, 9].
Toxicology research indicated that NFs and their metabolites are potentially hazardous substances, with possible carcinogenic, teratogenic, and mutagenic properties [10–13]. Metabolites of NFs (NFMs) usually exhibited much higher toxicity than their corresponding parent molecules and are hard to degrade even during steaming, baking, grinding, and microwave heating processes [14–16].
Due to their toxicity, many countries have banned NFs, as the European Union (EU) initiated in 1995 [17], followed by the USA (Federal Register 2002), China (Regulation of the Department of Agriculture of China 2002), and Korea (Food code 2004). After several years, the EU established the first minimum required performance limit (MRPL) for NFMs set at 1 μg/kg according to Decision No. 2003/181 [18]. More recently, the European Food Safety Authority (EFSA) published a scientific opinion on nitrofurans and their metabolites in food [19], which pushed the EU to set the reference points for action (RPAs) for these metabolites at 0.5 μg/kg, consistent with the Commission Regulation (EU) 2019/1871 [20]. NFs are still being used illegally in animal treatment despite the stringent policy due to their low price and good therapeutic effect [21].
The analysis of nitrofuran residues in food is based on the detection of its metabolites [8, 22]. Enzyme-linked immunosorbent assay, flow injection, chemiluminescence, HPLC, and HPLC-MS were reported to be the most widely used methods [22–29]. HPLC-MS is considered the most efficient technique among these methods due to its reliability, sensitivity, and selectivity [24, 26, 28]. Although many HPLC-MS methods have been reported in recent years to detect nitrofuran derivatives in complex matrix foods (e.g., honey [26, 30–35], milk [34–38], meat [34, 35, 39–43], seafood [44, 45], and eggs [34, 46, 47]), there are still problems that need to be solved more or less. For example, a sample clean-up step, usually SPE, is typically required to eliminate matrix effects. However, the SPE method usually implies much more complex purification steps, including activation, washing, elution, etc. Also, if the sample is gelatinous or relatively viscous, it may clog the SPE column and be challenging to separate.
SPME is a relatively recent sample pretreatment technique integrating sampling, extraction, concentration, and injection in one step [48, 49]. SPME exhibits many advantages, such as full process automation, avoidance of organic solvent consumption, and suitability for in situ and in vivo sampling. Due to its ultrahigh efficiency, SPME is receiving widespread attention from analysts in different fields, especially in routine laboratories and industrial applications [50–54]. The coated wooden tip is one SPME technology based on substrate-ESI and lately used for food safety analysis [55–58]. However, this method has a low ionization efficiency and poor reproducibility and is not easy to apply to complex food matrices, such as meat.
This study designed a crude, simple, inexpensive, easy-to-prepare wooden-tip-based SPME device combined with HPLC-MS/MS to determine nitrofuran metabolite derivatives in complex foods. Compared to traditional SPE methods, this SPME technique can compress costs and reduce analysis time, efficiently facilitating the handling of viscous, colloidal complex samples while potentially highly automated. This established method was further validated in terms of limit of detections (LODs), limit of quantifications (LOQs), and recoveries of each nitrofuran metabolite derivatives in pork, croaker, and honey. Ultimately, this method was used to evaluate real positive samples.
2. Materials and Methods
2.1. Materials and Chemicals
The external standards, including AOZ, AHD, AMOZ, and SEM, were purchased from Sigma-Aldrich (Germany). Isotopically labeled AOZ-d4, AHD-d3, AMOZ-d5, SEM-d3, used as Internal Standards (ISs), and 2-nitrobenzaldehyde (2-NBA) were also bought from Sigma-Aldrich (Germany). All reference standards were more than 98% pure. A Milli-Q purification system (Millipore, USA) was used to produce deionized water. The PAN powder was obtained from Macklin (Shanghai, China) and Oasis HLB from Waters (Shanghai, China). Dimethyl sulfoxide (DMSO), dipotassium hydrogen phosphate, sodium hydroxide, ammonium acetate, formic acid, and concentrated hydrochloric acid were obtained from Kermel (Tianjin, China) with a purity higher than 98%. HPLC grade ethyl acetate, n-hexane, methanol, acetonitrile, and isopropanol were purchased from Fisher (Shanghai, China). Medical cotton swabs to prepare PAN/HLB wooden tips were purchased from a local medical store in Weifang (China).
2.2. Standard Solutions
Standard solutions of NFMs were prepared by diluting individual stock solutions containing 100 mg/L of each standard dissolved in methanol (MeOH). The solutions of ISs were prepared by mixing AOZ-d4, AHD-d3, AMOZ-d5, and SEM-d3 in methanol at a concentration of 100 mg/L. Then, these two standard solutions were mixed in an intermediate solution at 1 μg/mL. A series of working solutions of NFMs and their ISs were prepared by diluting the intermediate solution with methanol. These solutions were cooled to −20°C in a freezer immediately after preparation. The 2-NBA solution was freshly prepared at a concentration of 50 mM in methanol.
2.3. Preparation of PAN/HLB-Coated Wooden-Tip-Based SPME
An amount of 7 g of PAN powder was dissolved in 100 mL of DMF with constant stirring at room temperature to ensure uniform dissolution. An amount of 1 g HLB particles (30 μm), previously obtained by ball mill grinding Oasis HLB at 240 rpm for 2 hours, was mixed with a 10 mL PAN solution to obtain a PAN-HLB slurry. The mixture was then shaken and blended on an oscillator at 1800 rpm for 12 hours to provide a sufficiently homogeneous combination of particles. The cotton from the tip of the medical swab was removed, and the wooden stick was dipped into the PAN-HLB slurry to a depth of about 1 cm, making the glue evenly coated on the wooden tip, and then dipped and coated it again after drying slightly. The wooden tip was washed twice in a solvent solution (methanol/isopropanol/acetonitrile, 50 : 25 : 25) by shaking at 1500 rpm for a total of 3 min to remove residues. Scanning electron microscopy (JSM-6510, JOEL, Japan) was used to examine the surface morphology of the SPME probe.
2.4. Sample Preparation
Muscle samples from meat or aquaculture products were minced and homogenized and stored at −20°C until use. Honey samples were stored under dry conditions in the dark at 4°C. For sample preparation, 3 g of the homogenized sample (accurate to 0.01 g) was weighed, placed into a 50 mL polypropylene centrifuge tube, and spiked with 30 μL of 0.1 μg/mL of ISs (AOZ-d4, AHD-d3, AMOZ-d5, and SEM-d3). Then, 17 mL of 0.125 mol/L hydrochloric acid and 1.0 mL of 2-NBA solution were added, homogenized for 1 min, and kept in a constant temperature shaker at 37°C for 16 h. The sample was centrifuged at 10000 r/min for 10 min, and 10 mL of the supernatant was taken and moved into a 20 mL polypropylene centrifuge tube. Subsequently, 1 ml of the dipotassium hydrogen phosphate solution was added to the test tube and the pH was adjusted to 7.2–7.4 with 1 mol/L sodium hydroxide solution and 0.1 mol/L aqueous hydrochloric acid solution.
2.5. Wooden-Tip-Based SPME Procedure
The wooden-tip-based SPME probe was first soaked in a methanol/water mixture for pretreatment (MeOH/H2O, 50 : 50) to activate the HLB coating, then dropped into the sample solution, and shaken with a speed of 1800 rpm for 2 min on a lab shaker at the room temperature. After this, the tip was picked up and placed into a centrifuge tube containing 5 mL of water, vibrated at 1800 rpm for 2 min. Then, the tip was collected and transferred into a centrifuge tube containing 5 mL of ethyl acetate and oscillated at the same speed for 3 min. The extract was evaporated under nitrogen at about 50°C until dryness and then redissolved in 500 μL of a mixture of methanol/ 0.1% formic acid aqueous solution (10 : 90; v : v). Finally, the sample was filtered at 0.2 μm and transferred into a microvial of 300 μL adapted to the injector.
2.6. LC-MS/MS Analysis
-
Spray voltage of 5.5 kV
-
Vaporizer temperature of 550°C
-
Curtain gas pressure of 35 psi
-
Ion-source gas 1 (nebulizer gas) pressure of 55 psi
-
Ion-source gas 2 (turbo gas) pressure of 50 psi
With positive ESI, NFMs were detected in the MRM mode. Table 1 displays the compound-dependent parameters.
| Analyte | Precursor ion (m/z) | Product ion (m/z) | DP (V) | CE (eV) |
|---|---|---|---|---|
| 2-NP-SEM | 209.1 | 166.2 ∗, 192 | 80 | 14, 16 |
| 2-NP-AOZ | 236.1 | 134.2 ∗, 104 | 117 | 17, 31 |
| 2-NP-AOZ-d4 | 240.2 | 134 | 117 | 20 |
| 2-NP-AHD | 249.1 | 104.1 ∗, 134 | 120 | 17, 27 |
| 2-NP-AHD-d3 | 252.1 | 134 | 100 | 17 |
| 2-NP-AMOZ | 335.2 | 291.1 ∗, 262.2 | 80 | 17, 23 |
| 2-NP-AMOZ-d5 | 340.2 | 296.1 | 80 | 20 |
- ∗Quantitation ion.
2.7. Method Validation
The proposed method was validated according to the Chinese National Standard (GB/T 27404-2008) [59]. The validation parameters include linearity, accuracy, precision, limit of detection (LOD), limit of quantification (LOQ), and recovery. The analytical signal was the ratio of peak areas of analytes to the corresponding internal standards.
Calibration curves were constructed by diluting the NFM standard at five concentrations (2.0, 4.0, 8.0, 16.0, and 20.0 μg/L, containing 4 μg/L ISs (AOZ-d4, AHD-d3, AMOZ-d5, and SEM-d3)) with the mobile phase. Linearity was determined based on the correlation coefficients of the calibration curves. Instrument response versus concentration plots were constructed for each analyte, and linear equations and correlation coefficients were calculated by linear regression analysis. The range of each analyte used for its calibration curves is listed in Table 2. The IS calibration method was used in this study to correct each substance’s matrix effects and isolate their contribution to the actual sample matrix [60].
| Analyte | Linear range (μg/L) | Calibration equation | Correlation coefficient (r2) |
|---|---|---|---|
| 2-NP-AOZ | 0.25–2.5 | y = 0.538x−0.0239 | 0.9998 |
| 2-NP-AHD | 0.25–2.5 | y = 0.198x−0.0114 | 0.9997 |
| 2-NP-AMOZ | 0.25–2.5 | y = 0.457x + 0.0204 | 0.9977 |
| 2-NP-SEM | 0.25–2.5 | y = 2.05x−0.0559 | 0.9997 |
The accuracy was assessed by adding three levels of NFM standards (0.5, 1.0, and 5 μg/kg) and ISs to the samples and calculating their recoveries. Precision was calculated by performing intraday (repeatability) and interday (reproducibility) studies and expressed as relative standard deviation (RSD). The intraday precision was determined using the same concentration levels (0.5, 1.0, and 5 μg/kg), and 6 parallel tests were conducted for each concentration level, whereas interday precision was studied, spiking 6 samples at 0.5, 1.0, and 5 μg/kg in different days. Selectivity of the method is achieved by using control blank samples. LODs and LOQs of the method correspond to the signal-to-noise ratios of 3 and 10, respectively.
3. Results and Discussion
3.1. Design Principle and Characterization of PAN/HLB-Coated Wooden-Tip-Based SPME
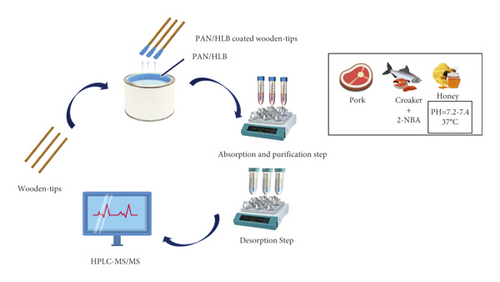
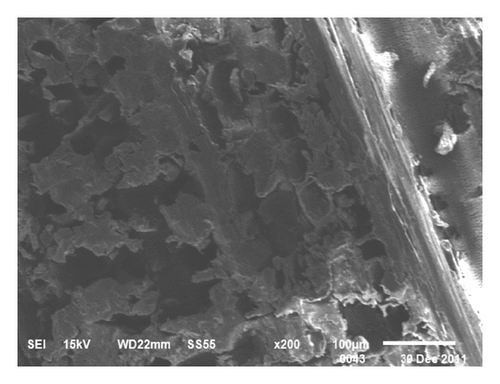
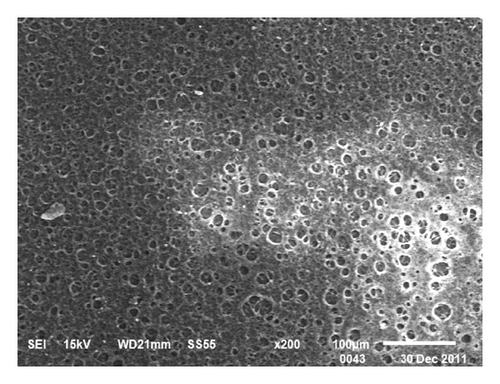
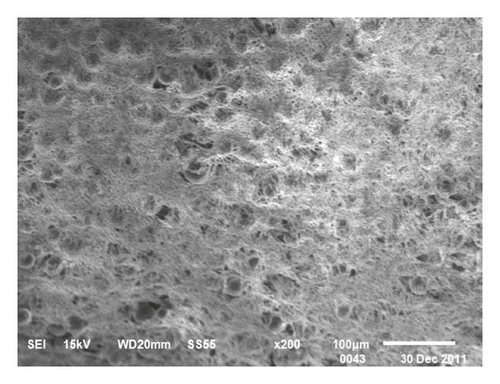
The procedure of wooden-tip-based SPME probe combined with LC-MS/MS for the detection of complex foods is shown in Figure 1. Morphological characterization of the PAN/HLB-coated wooden tip was performed via scanning electron microscopy analysis, as illustrated in Figure 2. It clearly shows that the surface of the wooden tip wrapped with PAN/HLB (Figure 2(c)) coating is covered with lots of “bubbles,” different from the tip itself (Figure 2(a)) and the PAN-covered tip (Figure 2(b)), suggesting an overcoating of HLB particles.
3.2. Optimization of Wooden Tip Coating Thickness
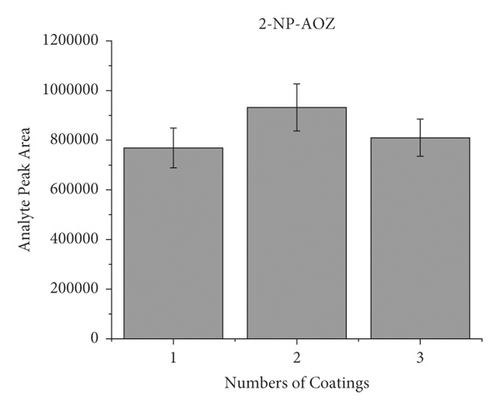
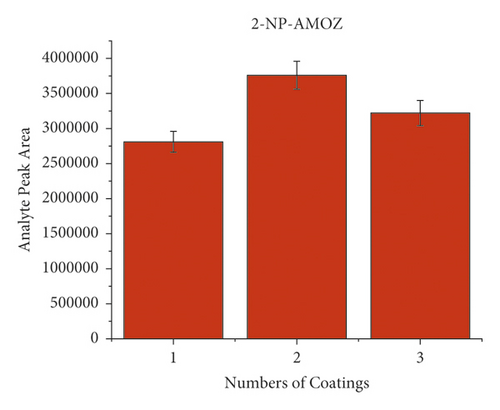
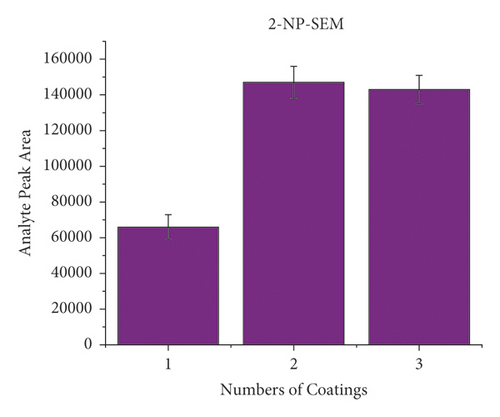
When dealing with the SPME technology, the thickness of the extracted phase is crucial because this characteristic of the equipment will be a deciding factor. Typically, a thicker coating would adsorb more target compounds and improve detection sensitivity. However, overcoating can make the preparation of SPME devices more difficult while causing material waste. Therefore, it is essential to find the ideal coating thickness. In order to investigate the effect of coating thickness on method response when applying to the HPLC-MS/MS approach, the wooden tip was tested, which had one layer, two layers, and three layers of a PAN-HLB coating applied, corresponding to 2.35, 4.71, and 11.18 mg of the sorbent weight. Each coating thickness was analyzed in triplicate, with an NFMs standard concentration of 0.1 mg/mL 200 μL spiked in pork and a shaking extraction time of 3 min. As shown in Figure 3, the highest mass spectral response values for the target compounds were obtained for the tips with two layers, and the response values decreased when the coating thickness increased to three layers. The slight signal drops may be because as the coating thickness increases, the uniformity decreases, causing the loss of some binding sites of the HLB to be concealed. This result shows that only about 5 mg of PAN/HLB coating (2 layers) is required to meet the detection needs of NFMs, which can largely cut the analysis cost compared with the current widely applied SPE cartridge (contains typically 30–500 mg HLB). Two layers of PAN-HLB coatings were employed for all further experimentation.

3.3. Optimization of Extraction Time
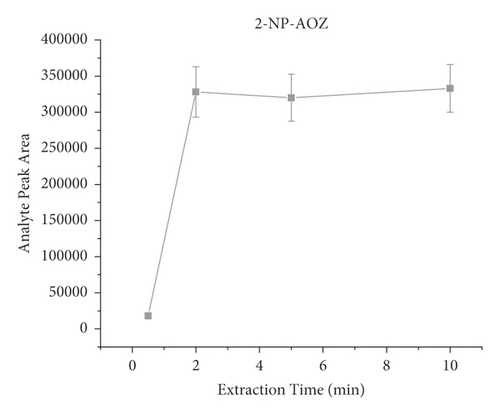
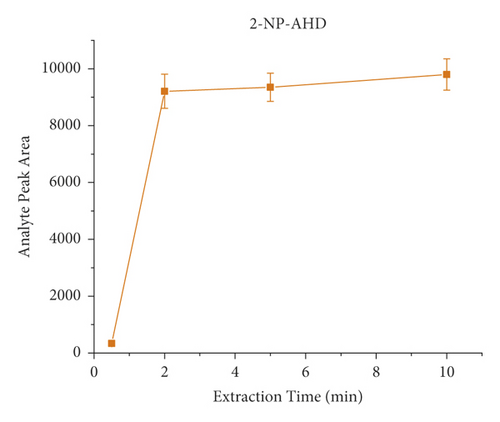
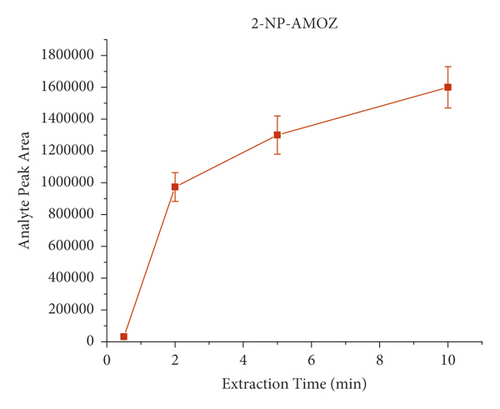
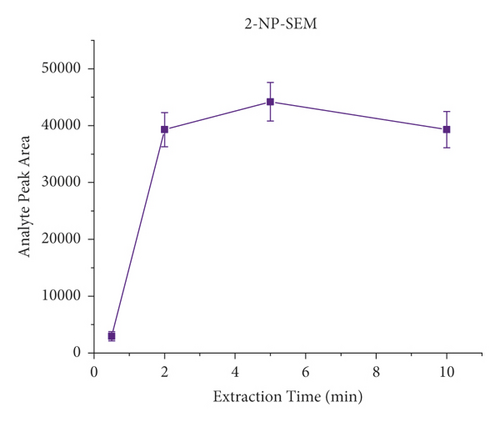
The derivatization conditions of nitrofurans have been discussed in detail in many articles [33, 40, 45, 61, 62]. Most of them suggest that a temperature of 37°C and a pH value of about 7.0 are optimal. Therefore, the present paper discusses the derivatization conditions, and the literature reports are directly adopted. Extraction time is an important factor in the dynamic equilibrium process of SPME, and different extraction times (i.e., 2 min, 5 min, 10 min, and 20 min) were investigated on the influences. Each experiment was investigated by analyzing pork spiked with 40 μL of the NFM standard (0.1 μg/mL) in triplicate. As shown in Figure 4, the response signal peak area increased from 30 s to 2 min and then remained relatively constant, indicating that the extraction equilibrium was reached. Therefore, the results indicated that the extraction process could be completed in a short time (2 min). Consequently, 2 min was selected as the extraction time for further experiments. It is worth mentioning that, unlike the traditional nonautomated SPE purification process, here, we use a lab shaker that allows semiautomated operation and simultaneous processing of dozens of samples, significantly improving efficiency.
3.4. Reusability of the PAN/HLB-Coated Wooden Tip
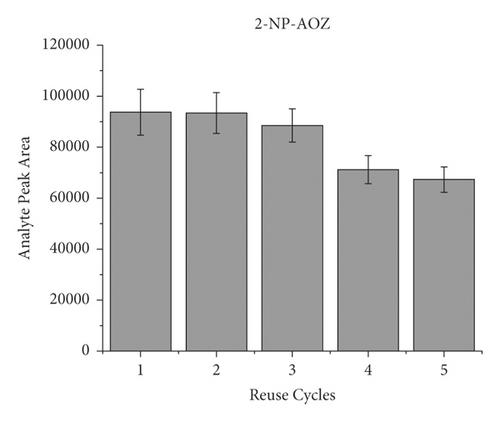
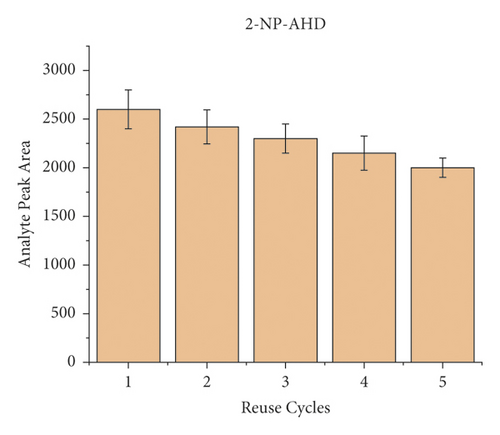
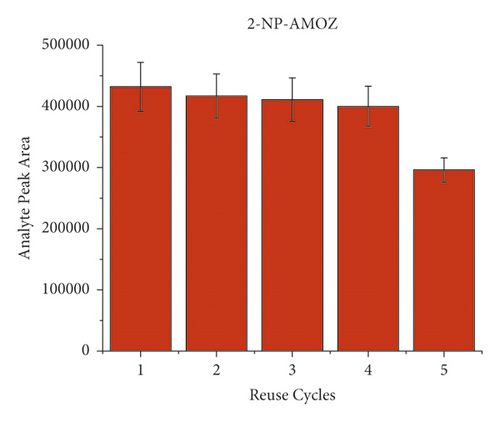
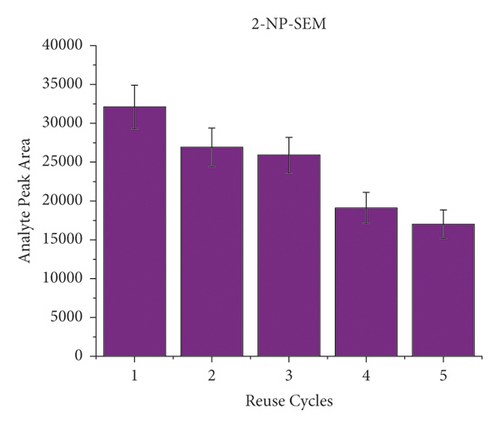
To evaluate the reusability of the PAN/HLB-coated wooden tip, 5 cycles of adsorption experiment were performed by analysis of pork spiked with 40 μL of the NFM standard (concentration of 0.1 μg/mL). Each cycle was carried out by triple times. The binding capacity of 5 cycles for the target molecule is shown in Figure 5. During the 5-cycle period, each cycle was accompanied by a decrease in the chromatographic signal peak, which was attributed to decreased adsorption capacity due to the loss of binding sites. After 5 cycles, the wooden-tip-based SPME probe reached more than 70% of the first adsorption capacity for 2-NP-AOZ, 2-NP-AHD, 2-NP-AMOZ, and over 50% 2-NP-SEM. Based on these results, the PAN/HLB-coated wooden tip demonstrates good regeneration performance and could be recycled several times.
3.5. Method Validation
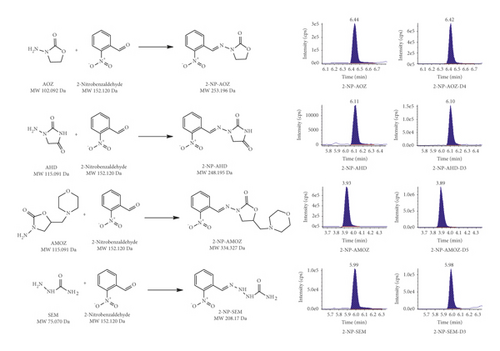
As shown in Table 3, selectivity, specificity, and sensitivity were evaluated with good results (including at a concentration of 0.5 μg/kg) in compliance with EU regulation 2002/657/EC. The signal-to-noise ratio (S/N) was determined by comparing the signal with the lowest concentration of the target analyte and the blank sample. The LODs and LOQs of the four NFMs were obtained by 3 and 10 times the S/N, respectively. For the three different food matrices (pork, croaker, and honey), the values of LOD and LOQ were, respectively, ranging from 0.011 to 0.123 and 0.033 to 0.369 μg/kg (pork), 0.009 to 0.112 and 0.027 to 0.339 μg/kg (croaker), and 0.010 to 0.131 and 0.030 to 0.293 μg/kg (honey). It can be seen that the LOQ of the method is lower than the MRPL of 1.0 μg/kg specified by the EU. Accuracy and precision were determined by each recovery and percentage root square deviation (%RSD) and by peak area at three concentration levels (0.5, 1.0, and 5 μg/kg). The average recovery of all NFM derivatives ranges from 97.4–140.3% (pork), 87.5–112.7% (croaker), and 98.6–109.0% (honey), as Table 3 summarized. It can be seen (Table 3) that intraday and interday precisions were lower than 10% for the three levels assayed. Typical multiple reaction monitoring (MRM) chromatograms of a spiked sample are shown in Figure 6.
| Analyte | Matrix | Spiked level (μg/kg) | Intraday series (% RSD) | Interday series (% RSD) | LOD (μg/kg) | LOQ (μg/kg) | Recovery (%) |
|---|---|---|---|---|---|---|---|
| 2-NP-AOZ | Pork | 0.5 | 6.98 | 8.14 | 0.043 | 0.129 | 109.5 |
| 1.0 | 3.69 | 5.29 | 104.3 | ||||
| 5.0 | 5.27 | 3.73 | 103.0 | ||||
| 2-NP-AHD | 0.5 | 8.14 | 7.66 | 0.072 | 0.216 | 97.4 | |
| 1.0 | 6.03 | 8.69 | 98.2 | ||||
| 5.0 | 5.91 | 4.78 | 99.7 | ||||
| 2-NP-AMOZ | 0.5 | 3.80 | 7.08 | 0.011 | 0.033 | 102.6 | |
| 1.0 | 5.78 | 6.42 | 101.9 | ||||
| 5.0 | 5.91 | 4.07 | 102.5 | ||||
| 2-NP-SEM | 0.5 | 9.41 | 8.11 | 0.123 | 0.369 | 108.1 | |
| 1.0 | 8.67 | 5.25 | 103.2 | ||||
| 5.0 | 6.53 | 6.29 | 99.6 | ||||
| 2-NP-AOZ | 0.5 | 3.83 | 4.18 | 0.036 | 0.109 | 112.7 | |
| 1.0 | 4.95 | 3.53 | 105.5 | ||||
| 5.0 | 3.04 | 3.11 | 99.1 | ||||
| 2-NP-AHD | Croaker | 0.5 | 7.64 | 6.47 | 0.060 | 0.180 | 105.6 |
| 1.0 | 6.05 | 6.14 | 103.2 | ||||
| 5.0 | 8.12 | 5.89 | 101.5 | ||||
| 2-NP-AMOZ | 0.5 | 4.03 | 5.86 | 0.009 | 0.027 | 96.5 | |
| 1.0 | 3.87 | 7.55 | 97.3 | ||||
| 5.0 | 4.53 | 6.34 | 98.9 | ||||
| 2-NP-SEM | 0.5 | 6.51 | 7.34 | 0.112 | 0.337 | 87.5 | |
| 1.0 | 5.37 | 6.53 | 88.3 | ||||
| 5.0 | 6.72 | 8.07 | 92.4 | ||||
| 2-NP-AOZ | 0.5 | 3.87 | 7.03 | 0.035 | 0.105 | 103.4 | |
| 1.0 | 2.79 | 8.14 | 105.2 | ||||
| 5.0 | 5.02 | 5.31 | 102.4 | ||||
| 2-NP-AHD | 0.5 | 2.91 | 5.88 | 0.131 | 0.293 | 109.0 | |
| 1.0 | 2.06 | 3.74 | 99.7 | ||||
| 5.0 | 4.72 | 5.96 | 104.8 | ||||
| 2-NP-AMOZ | Honey | 0.5 | 4.52 | 6.85 | 0.010 | 0.030 | 100.4 |
| 1.0 | 2.36 | 5.92 | 101.2 | ||||
| 5.0 | 3.18 | 6.25 | 99.3 | ||||
| 2-NP-SEM | 0.5 | 2.51 | 4.14 | 0.063 | 0.189 | 104.7 | |
| 1.0 | 3.77 | 2.36 | 100.5 | ||||
| 5.0 | 2.09 | 3.53 | 98.6 | ||||
3.6. Analysis of Real Samples
In order to test the accuracy of the method on the actual positive samples, the method established in this paper was applied to test the proficiency testing samples provided by China National Accreditation Service for Conformity Assessment (CNAS) for the determination of nitrofurans in chicken meat (no. ACAS-PT-1048), and the results are as shown in Table 4. It is shown that our method is closer to the true values than the China national GB standard method (GB/T 20752-2006, employing SPE purification step) [63], meaning that the presented method can be used to replace the national standard method in real sample testing.
| Analyte | Sample no. | Concentration (μg/kg) | True value (μg/kg) | Z value (only the results of the GB method are counted) | |
|---|---|---|---|---|---|
| GB method | Wooden tip method | ||||
| AOZ | 20-N483 | 10.6 | 12.9 | 17.0 | −1.1 |
| 20-J996 | 11.6 | 14.2 | 17.0 | −1.0 | |
| AMOZ | 20-N483 | 30.3 | 33.6 | 39.0 | −0.5 |
| 20-J996 | 32.6 | 35.7 | 39.0 | −0.4 | |
4. Concluding Remarks
A rough, cheap, easy-made wooden-tip-based SPME probe was developed, optimized, and validated to simultaneously determine 4 NFM derivatives in complex food matrices by LC-MS/MS. The present method is less time-consuming and less expensive than the traditional SPE clean-up method and achieved desirable reliability, sensitivity, and simplicity in the analysis process. Additionally, the developed PAN/HLB-coated wooden tip LC-MS/MS method provided good repeatability and reproducibility in a deficient concentration level. Finally, the method can be successfully applied to the analysis of real positive samples.
Conflicts of Interest
The authors declare that they have no conflicts of interest.
Authors’ Contributions
Xiaoming Gong and Kai Li contributed equally to this work.
Acknowledgments
This work was financially supported by General Administration of Customs P. R. China, grant no. 2020HK201.
Open Research
Data Availability
The data used to support the findings of this study are included within the article.


