Research on Adsorption and Desorption Characteristics of Gas in Coal Rock Based on Nuclear Magnetic Resonance Technology
Abstract
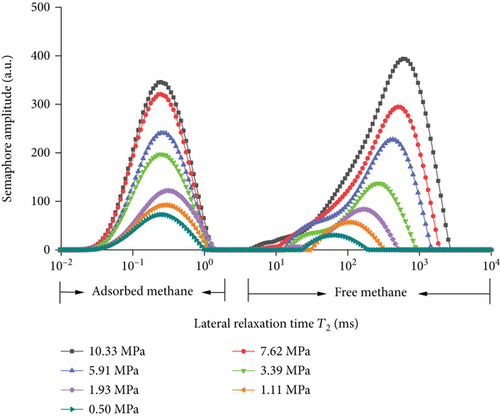
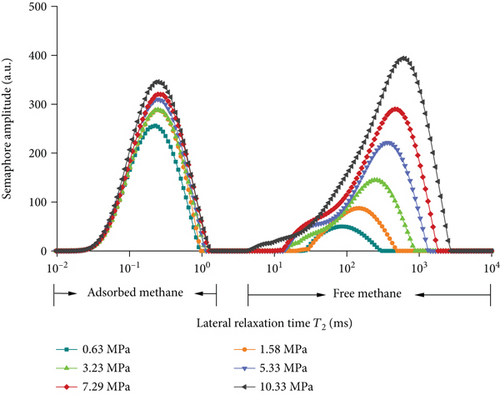
In order to explore the change characteristics of the adsorption and desorption performance of coal under high gas pressure, low-field nuclear magnetic resonance (LFNMR) technology was used to conduct experimental research on coal adsorption and desorption. The results show that (1) the T2 spectrum distribution diagram shows adsorption peaks (T2 = 0.01 ms ~ 1 ms) and free peaks (T2 = 5 ms ~ 1000 ms); (2) with the increase of equilibrium pressure, the peak area of adsorbed methane gradually increased at first and then tended to equilibrium. The initial increase rate of free methane was slower than that of adsorbed methane, and the increase rate of free methane was faster in the later stage; (3) the relationship between the amount of adsorbed gas in the adsorption state of coal and the gas pressure conforms to the Langmuir equation. Taking the equilibrium pressure P = 8.7 MPa as the critical hysteresis pressure, it can be divided into two stages which are higher gas pressure (0.5~8.7 MPa) and high gas pressure (8.7~10.33 MPa); the amount of adsorbed gas in the free state has a linear relationship with the gas pressure, and there is no obvious hysteresis; (4) comparative analysis under the same experimental conditions, the mass of the adsorbed gas in the desorption process is greater than the mass of the adsorbed gas in the adsorption process, and there is basically no difference in the mass of the free gas.
1. Introduction
With the continuous mining of coal mines, there are more gas outburst mines, and there is a large amount of free and adsorbed gas in the coal seam. After mining, the gas pressure pushes the coal to do its work, and a large amount of gas is desorbed in a short time [1–3], causing disasters and accidents, resulting in irreversible casualties and economic losses. Therefore, it is of great significance to study the adsorption and desorption characteristics of gas in coal to improve the accuracy of gas prediction and forecasting, improve mine gas control, and prevent disaster accidents. In recent years, a large number of scholars have conducted related researches on the deformation characteristics of media adsorption and desorption. He et al. [4] conducted experimental studies on the desorption process of gas in coal under the action of temperature-stress coupling field. Liang et al. [5] used the self-made adsorption and desorption test device to test the deformation law of coal in the process of low-pressure gas adsorption. The study adopted the adsorption deformation test of gas-containing coal to study the influence of adsorption and desorption deformation under different gas pressure conditions by Guo [6]; Zhang et al. [7] carried out the experiment of coal seam adsorption deformation under the action of He, CH4, and CO2 and studied the deformation characteristics of coal seams in the process of gas adsorption; [8, 9] discussed the mechanical behavior of protruding coal adsorption gas to produce expansion deformation and desorption gas to produce shrinkage deformation of the macroscopic level.
The above research analyzes the deformation characteristics of adsorption and desorption gas of coal from a macro perspective; however, the change in macrophysical properties of coal after the adsorption of methane is caused by the structural deformation of its internal microscopic view [10–12].
At present, there are many researches through conventional test methods; Lin et al. [13] used Scanning Electron Microscope (SEM) and image analysis methods to study the effects of adsorption energy and substrate strain on adsorption capacity and obtained the ultrahigh pressure Langmuir equation. Wang et al. [14] reviewed the progress of molecular simulation of gas adsorption/desorption and diffusion in shale matrix in recent years. Wang et al. [15] combined N2 (77 K) and CO2 (273 K) adsorption experiments to study the microstructural characteristics of bituminous coal in the process of gas cyclic adsorption/desorption. Tang et al. [16] studied the adsorption and desorption characteristics of CH4 in coal during low-temperature oxidation by constructing a physical model of CH4 adsorption and desorption. Liu et al. [17] used the quasisecondary adsorption/desorption kinetics model and the Freundlich isothermal model to fit methane adsorption/desorption kinetics and isotherms.
However, the above results show that it is susceptible to damage to the internal structure of coal bodies. Low-field nuclear magnetic resonance (LF-NMR) is a nondestructive, fast, and accurate detection method, which can accurately characterize the change characteristics of coal from the microscopic pore structure [17–22]. In order to further understand the nonuniform deformation law of coal microscopic and the influence of coal structure, this paper uses low-field nuclear magnetic resonance (LF-NMR) technology to explore the isothermal adsorption and desorption characteristics under different gas pressures and then study the microscopic microstructure of coal affected by different gas pressures. The law of deformation is expected to provide theoretical guidance for coal mine gas control and prevention of gas outburst.
2. Experimental Principle and Process
2.1. Principle of NMR
It can be seen from equation (3) that the transverse relaxation time T2 is proportional to the coal rock aperture r, and the longitudinal relaxation distribution map corresponding to T2 can evaluate the pore size and pore size distribution. That is, the peak area of the T2 spectrum distribution can represent the relative amount of pores in coal. Since the pores are the main places where gas in the coal occurs, the peak area of the T2 spectrum can represent the total gas signal detected in coal. In the paper, the T2 spectrum peak area is used to characterize the amount of gas adsorption and desorption in coal, that is, to study the characteristics of gas adsorption and desorption from the microscopic aspect [21, 23, 26].
2.2. Experimental Equipment and Sample Preparation
In order to study the adsorption and desorption characteristics of coal under different gas pressures, and its influence on coal deformation, the experimental program adopted is to set different gas pressures, tested with NMR technology, and obtain the T2 spectrum of coal. The adsorption and desorption characteristics of coal rocks and the influence law of coal body deformation are analyzed by the experiment.
This test uses the MacroMR12-150H-I nuclear magnetic resonance test analyzer (Figure 1). Its parameters are permanent magnet magnetic field strength (0.3 ± 0.05 T), probe coil diameter of 60 mm, the main frequency which is 12.54 MHz, and the echo interval which is 0.15 ms.
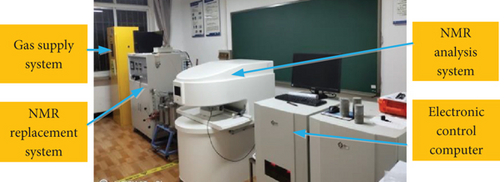
The coal sample used in the test was taken from the Guizhou coal mine, and a large coal sample was made into a cylinder in the laboratory. The sample volume is 14.22 cm3, and the porosity is 1.123%. The specific parameters are shown in Table 1. The main component of gas in coal is methane, and the test gas is selected for purity of 99.99% methane gas.
| Sample name | Diameter (mm) | Height (mm) | Volume (cm3) | Nuclear magnetic semaphore | Porosity (%) |
|---|---|---|---|---|---|
| Coal sample | 25.20 | 28.50 | 14.22 | 13022.89 | 1.123 |
2.3. Test Procedure
Preliminary preparation for the experiment: ① put the sample in an oven and dry it at 60°C for 24 hours; ② take out the sample and weigh the dry weight; ③ put the dry sample in the core holder, and test the T2 spectrum of the dry sample.
As shown in Figure 2, connect the test device and do vacuum treatment (-0.01 MPa) to ensure that there is no leakage in the system pipeline. In this experiment, the data of 11 equilibrium pressure points below 10 MPa (equilibrium time is 4 h) are taken.
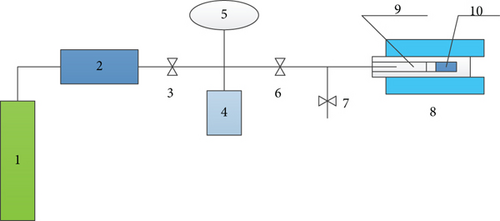
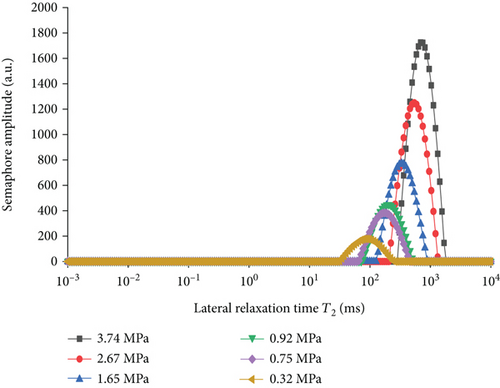
First, the pure methane gas is calibrated to establish the relationship between the amplitude of the signal and the mass of the methane gas. By selecting equilibrium pressures (0.32 MPa, 0.75 MPa, 0.92 MPa, 1.65 MPa, 2.67 MPa, and 3.74 MPa), the mass of adsorbed and free methane can be quantitatively analyzed under different pressures, and the NMR of T2 spectrum can intuitively and qualitatively observe the changes of adsorbed and free methane. Secondly, the coal column specimen is placed into the NMR analyzer holder cavity, and the sample is not removed during the test. The same specimen was used to conduct laboratory tests on the whole process of gas adsorption and desorption in coal.
Adsorption process: in this experiment, when the adsorption in coal reaches equilibrium, the T2 spectrum does not change, and then, the next pressure point is adsorbed at a time interval of 10 min, and the equilibrium pressure of gas adsorption is 0.50 MPa, 1.11 MPa, 1.93 MPa, 3.39 MPa, 5.91 MPa, 7.62 MPa, and 10.33 MPa, and collect and record relevant experimental data, respectively.
Desorption process: after the data acquisition of 10.33 MPa in the adsorption process is completed, the pressure relief is carried out quickly. The data acquisition interval is 10 minutes, and the gas pressure is 10.33 MPa, 7.29 MPa, 5.33 MPa, 3.23 MPa, 1.58 MPa, and 0.63 MPa, and the relevant experimental data are collected and recorded, respectively.
3. Methane Calibration Test Based on NMR
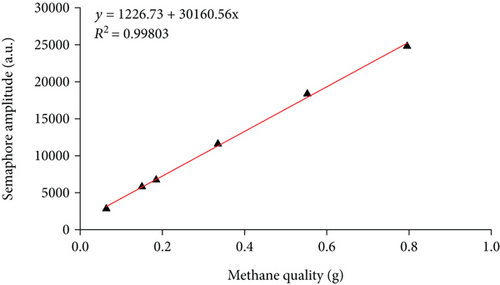
As shown in Figure 3, with the increase of pressure, the T2 spectrum of free methane gradually shifted to the right, and the peak area gradually increased, and the specific increase in experimental values is shown in Table 2. Moreover, the free state gas peak T2 spectral curve has only one characteristic peak, the gas pressure is 0.32~3.74 MPa, and the corresponding free state gas transverse relaxation time is 31.81~1683.18 ms. Figure 4 and Table 1 establish the relationship between amplitude and mass of methane signal as shown in Figure 4, and the pressure and methane mass increase linearly, that is, the methane mass is proportional to the free peak area.
| Pressure (MPa) | Compression factor | Methane quality (g) | Free peak area |
|---|---|---|---|
| 3.74 | 0.9287 | 0.795377431 | 24809.298 |
| 2.67 | 0.9545 | 0.552474752 | 18358.782 |
| 1.65 | 0.9726 | 0.335063242 | 11596.887 |
| 0.92 | 0.9834 | 0.184771392 | 6733.107 |
| 0.75 | 0.9856 | 0.150292627 | 5810.072 |
| 0.32 | 0.9935 | 0.063614953 | 2834.298 |
4. Analysis of Pressure Swing Adsorption and Desorption Characteristics
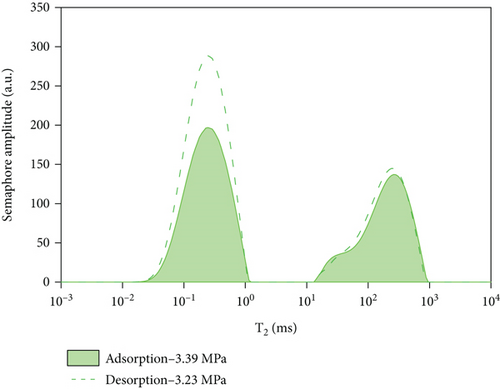
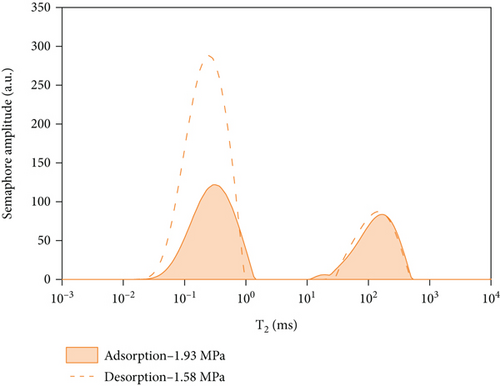
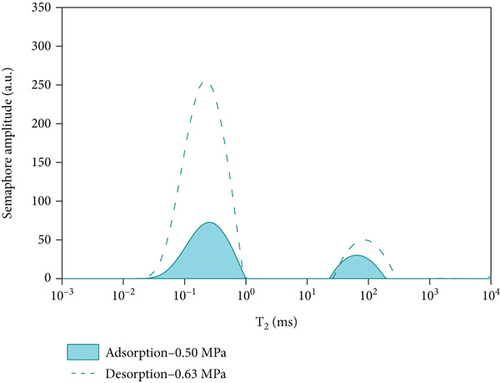
In this experiment, the methane adsorption and desorption experiment is carried out by adjusting the experimental pressure at room temperature (297.15 K). It can be seen from Figure 5 and Table 3 that the T2 of coal rock presents two independent peaks under different pressures which are the left peak (relaxation time 0.01 ms~1 ms) which is defined as adsorbed methane and the right peak which is free methane (relaxation time 5 ms~1000 ms). With the increase of pressure, the peak area of the adsorbed methane gradually increases first, and when the pressure reaches a certain pressure value, the adsorbed methane gradually saturates and tends to equilibrium; however, as the pressure increases, the initial increase rate of free methane is slower than that of adsorbed methane, when the pressure increases from 3.39 MPa to 5.91 MPa and higher, the free methane increases faster. After the methane adsorption experiment, the decompression desorption is carried out under the same conditions. It shows from Figure 5(b) and Table 3 that with the decreases of pressure from 10.33 MPa to 7.29 MPa, the peak area of free methane decreases rapidly, while the reduction of adsorbed methane is slower than that of free methane. When the pressure decreased from 7.29 MPa to 5.33 MPa and lower, the peak area of free methane continues to decrease rapidly, while the peak area of adsorbed methane generally decreases slowly.
| Methane adsorption | Methane desorption | ||||||
|---|---|---|---|---|---|---|---|
| Pressure (MPa) | Adsorption peak | Free peak | Total peak area | Pressure (MPa) | Adsorption peak | Free peak | Total peak area |
| 10.33 | 8681.762 | 12698.17 | 21379.94 | —— | —— | —— | —— |
| 7.62 | 7929.735 | 9009.905 | 16939.641 | 7.27 | 8031.894 | 8636.967 | 16668.861 |
| 5.91 | 5898.243 | 6546.558 | 12444.802 | 5.33 | 7641.708 | 6217.434 | 13859.141 |
| 3.39 | 4923.571 | 3561.819 | 8485.389 | 3.23 | 7054.432 | 3723.823 | 10778.255 |
| 1.93 | 3083.376 | 1843.329 | 4926.706 | 1.58 | 6816.78 | 1927.395 | 8744.174 |
| 1.11 | 2279.002 | 1084.695 | 3363.697 | 0.63 | 5995.802 | 977.376 | 6973.178 |
| 0.5 | 1693.325 | 522.343 | 2215.668 | —— | —— | —— | —— |
4.1. The Change Law of Adsorbed Gas in Adsorption and Desorption
In the formula, θ is the adsorption capacity coverage, a is the adsorption coefficient or adsorption equilibrium constant, and p is the pressure at the adsorption equilibrium, MPa.
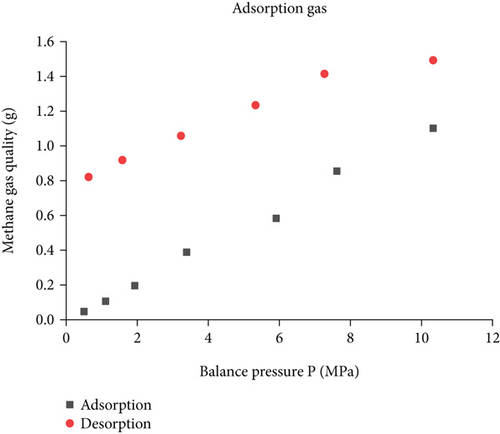
According to the calibration curve (Figure 6), the peak area value and the methane mass are converted to obtain the adsorbed methane mass under different experimental conditions (Figure 7). Due to the peak area of T2 spectrum of the adsorbed gas, it reflects the amount of gas adsorbed in coal. The Langmuir equation is used to fit the T2 spectrum peak area S and gas pressure P of the adsorbed gas in the adsorption and desorption process. It can be seen from Figure 7 that the amount of adsorbed gas and the gas pressure conform to the Langmuir equation. (1) Adsorption process: the fitted curve is S2 = 13661.53P/(6.19 + P), R2 = 0.96528, the gas pressure rises from 0.5 MPa to 10.33 MPa, and the amount of adsorbed gas increases by 34.59%, 35.30%, 59.68%, 19.80%, 34.44%, and 9.50%; as the gas pressure increases, the amount of adsorbed gas gradually increases, and the adsorption rate increases first and then decreases; (2) desorption process: the fitted curve is S1 = 8261.77P/(0.28 + P), R2 = 0.96528, the gas pressure drops from 10.33 MPa to 0.63 MPa, and the amount of adsorbed gas is desorbed by 7.49%, 4.86%, 7.69%, 3.37%, and 12.04%, the desorption volume gradually increases, and the desorption speed shows a decreasing trend.
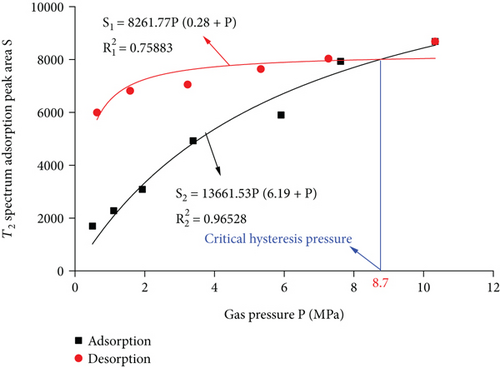
In adsorption and desorption, the peak area S of the adsorbed gas T2 spectrum and the gas pressure P fitting curve, S1 = 8261.77P/(0.28 + P), S2 = 13661.53P/(6.19 + P), the critical hysteresis pressure P = 8.7 MPa can be obtained by calculation. It can be divided into high gas phase (8.7~10.33 MPa) and higher gas phase (0.5~8.7 MPa). During the adsorption and desorption process of high gas phase, the fitted curve of adsorbed gas desorption is below the adsorption curve. The gas desorption rate is greater than the adsorption rate. It shows that in the high gas state, the amount of adsorbed gas in the adsorption and desorption process will gradually decrease; in the higher gas stage during the adsorption and desorption process, the adsorbed gas desorption curve is above the adsorption curve, and the desorption rate of the adsorbed gas is much slower than the adsorption speed. The above error shows that the adsorption process has not reached the saturation state, and the adsorption is still in the early stage of the desorption process. The desorption rate is slightly greater than the adsorption rate in the later stage. When the gas pressure drops to 0.63 MPa, the desorption rate of 12.04% is greater than the initial adsorption rate of 9.50%. It shows that in the process of adsorption and desorption, the desorption has obvious hysteresis with the decrease of pressure, and a certain amount of gas adsorption will remain. In coal mining, the working face may desorb hysteresis and lead to local gas overlimit.
4.2. The Law of Free Gas Change in Adsorption and Desorption
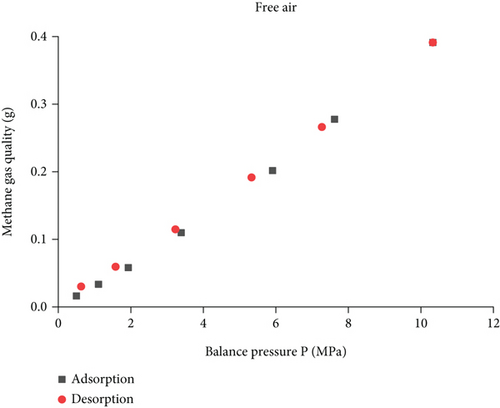
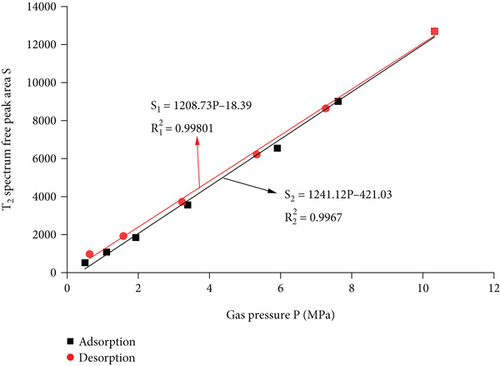
It can be seen from Figure 8 that the amount of free methane gas in adsorption and desorption basically overlaps, there is a linear relationship between the amount of free gas and the gas pressure, and linear fit is performed. It can be seen from Figure 9 that the adsorption process is as follows: S2 = 1241.12P − 421.03, R2 = 0.9967, the gas pressure increases from 0.5 MPa to 10.33 MPa, and the amount of free gas increased by 107.66%, 69.94%, 93.23%, 83.80%, 37.63%, and 40.94%. With the increase of gas pressure, the amount of adsorbed gas gradually increases, and the adsorption speed shows a trend of increasing first and then decreasing and gradually tends to be flat. The desorption process: the resultant curve is S1 = 1208.73P − 18.39, R2 = 0.99801, the amount of free desorbed gas decreased by 31.98%, 28.01%, 40.11%, 48.24%, and 49.29%, the desorption amount increases gradually, and the desorption rate first decreases and then increases. It can be known from linear fitting that the desorption curve of the free state of adsorption and desorption is slightly higher than the adsorption curve, the desorption rate is slightly greater than the adsorption rate, and there is no obvious hysteresis.
5. Comparative Analysis of Adsorption and Desorption Capacity under Different Pressures
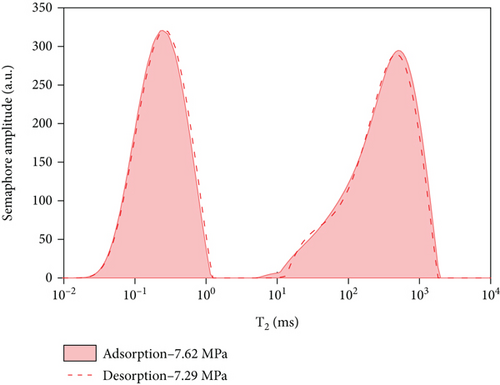
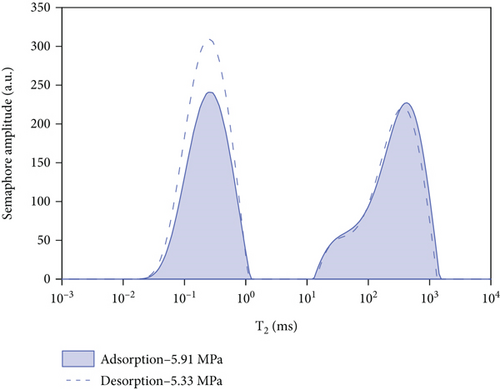
By comparing and analyzing the T2 spectrum distribution of methane adsorption and desorption under the same experimental conditions, select 5 MPa, 3 MPa, 2 MPa, and 0.5 MPa, as shown in Figure 10. In the process of methane pressurization adsorption and depressurization desorption, the peak value of free methane under the same pressure is not much different, while the adsorption state is very different. The analysis of the comparison chart shows that as the equilibrium pressure decreases, the T2 spectrum of free methane has little difference under the same pressure, while the peak area difference of the adsorbed methane is larger. During the process of desorption of methane, the peak area of the T2 spectrum of adsorbed methane under the pressure of 0.63 MPa is larger than that of the T2 spectrum of adsorbed methane under the condition of 5.91 MPa. According to Table 4, the initial adsorbed gas mass in the adsorption process is 0.0469 g, and when the desorption process is 0.63 MPa, the adsorbed gas mass is 0.7906 g, and the residual gas in the coal sample is 0.7437 g; when the gas pressure drops to 0.63 MPa, the content of free methane gas in the desorption process is 0.0301 g, and the initial content of free methane gas in the adsorption process is 0.0161 g, so the residual gas in the coal sample is 0.014 g. It shows that as the equilibrium pressure increases, the mass of methane gas increases, and the mass of adsorbed gas in the desorption process is greater than that in the adsorption process. Since the T2 spectrum did not change during the 4 h adsorption in this experiment, it was used as the time for the adsorption equilibrium pressure. However, it indicates that the methane adsorption did not reach full saturation at this time, and the adsorbed gas continued to be adsorbed at the initial stage of desorption. The analysis of the above test data shows that in the actual mining of adsorption coal mines, the working face can only desorb part of the gas by depressurization and drainage, and most of the gas will remain, resulting in local gas exceeding the limit.
| Adsorption process | Desorption process | ||||
|---|---|---|---|---|---|
| Balance pressure (MPa) | Free gas quality (g) | Adsorbed gas quality (g) | Balance pressure (MPa) | Adsorbed gas quality (g) | Free gas quality (g) |
| 0.5 | 0.0161 | 0.0469 | 10.33 | 1.1012 | 0.3912 |
| 1.11 | 0.0334 | 0.1060 | 7.27 | 1.1485 | 0.2661 |
| 1.93 | 0.0581 | 0.1959 | 5.33 | 1.0424 | 0.1915 |
| 3.39 | 0.1097 | 0.3881 | 3.23 | 0.9430 | 0.1147 |
| 5.91 | 0.2017 | 0.5826 | 1.58 | 0.8588 | 0.0594 |
| 7.62 | 0.2776 | 0.8548 | 0.63 | 0.7906 | 0.0301 |
| 10.33 | 0.3912 | 1.1012 | |||
6. Discussion
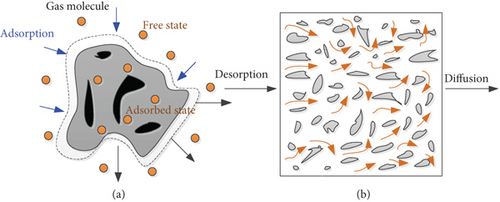
Coal is a complex porous medium and natural adsorbent, the process of gas injection into coal is an adsorption-desorption-diffusion, as shown in Figure 11, and there is a large amount of free and adsorbed gas in the coal seam. The gas molecules will accelerate the adsorption speed with the passage of gas pressure and will be desorbed into coal pores in a short time. Finally, it spreads from coal fissures to boreholes or coalbed methane wells, causing disaster accidents [30, 31]. It is of great significance to study the gas adsorption and desorption characteristics from the microscopic nonuniform deformation law of coal and its coal structure.
By carrying out low-field nuclear magnetic resonance research on the adsorption and desorption law of coal and rock under gas pressure, it provides a theoretical basis for in-depth prediction of coal seam gas content, understanding of gas occurrence and migration mechanism in the coal seam, and prediction of gas disasters. It can be seen from Figure 12 that the gas pressure in different states has a significant promoting effect on gas adsorption and desorption (the left ordinate axis represents the proportion of desorbed methane and represents desorption; the right ordinate axis represents the proportion of adsorbed methane and represents boost adsorption); with the increase of gas pressure, the proportion of adsorption capacity of coal samples increases linearly; when the gas pressure is reduced, the proportion of desorbed gas in the coal sample gradually increases. On the contrary, the residual gas content of the coal sample gradually decreased. It indicates that in the actual mining, the pressure reduction of the working face has a certain promoting effect.
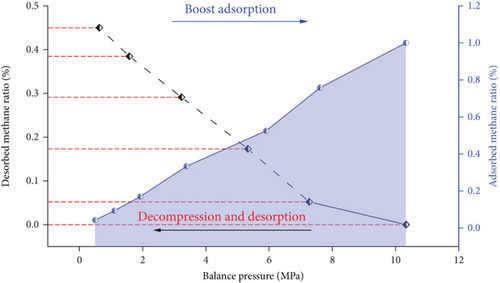
In the above analysis, the factor that cannot be ignored is the change of the pore structure inside the coal body. The hysteresis of the adsorbed gas during the adsorption and desorption process is mainly related to whether the pore structure of the coal body is fully developed; the hysteresis of free gas is related to the deformation of coal pore and fracture structure and whether the seepage channel is blocked. They all need to be further researched.
7. Conclusion
- (1)
Based on NMR analysis, the T2 spectrum distribution of adsorption and desorption under different pressures is measured, showing two independent peaks, the left peak (relaxation time 0.01 ms~1 ms) is adsorbed methane, and the right peak is free methane (relaxation time 5 ms~1000 ms)
- (2)
Combined with the Langmuir model, the amount of adsorbed gas and the gas pressure conforms to the Langmuir equation. During the adsorption and desorption process, the desorbed gas has a hysteresis at pressure P = 8.7 MPa; the amount of free gas has a linear relationship with the gas pressure, and there is no obvious hysteresis
- (3)
By comparing and analyzing the law of gas adsorption and desorption under the same equilibrium pressure, in the process of methane pressurization adsorption and depressurization desorption, the peak value of free methane under the same pressure is not much different, while the adsorption state is very different. In coal mining, the working face only relies on the depressurization drainage method, the gas adsorption and desorption is incomplete, and the efficiency is too low
Conflicts of Interest
The authors declare that they have no conflicts of interest.
Acknowledgments
The study was funded by the National Natural Science Foundation of China (51974009), Anhui Province Science and Technology Major Project, Anhui Province “Provincial Special Expenditure Plan” Leading Talent Project (T000508), Anhui Academic and Technical Leaders Scientific Research Activity Fund (2021), The University Synergy Innovation Program of Anhui Province GXXT-2021-075, Anhui Provincial Natural Science Foundation (No. 2008085QE222), and Guizhou Provincial Science and Technology Plan Project (Qiankehe Platform Talents [2019] 5674).
Open Research
Data Availability
The data used to support the results of this study are available from the first author upon request.


