Optimization of the Stirring Blade Structure of the Pumping Unit Based on the Improvement of Concrete Suction Efficiency
Abstract
In this paper, a discrete element method (DEM) is used to simulate the suction process of fresh concrete in the pumping system, and the influence of the stirring blade on the suction is explored. The Hertz-Mindlin with JKR Cohesion contact model is used to establish the DEM model of fresh concrete, and the suction work is realized by an API function of DEM, and the movement of particles in the suction cylinder can be completed smoothly. The changes of the concrete flow field during the suction process are further studied, and the influence mechanism of the stirring blade on the suction process is explained. A numerical simulation scheme is designed to explore the influence of the rotation speed, installation angle, and edges distance of the stirring blade on the suction efficiency and the stirring resistance torque, and the structure of the stirring blade is optimized according to the influence law. The simulation results show that the stirring resistance torque of the optimized stirring blade is reduced without the suction efficiency of the pumping system reduced, and the stirring energy consumption of the pump suction is reduced.
1. Introduction
Fresh concrete is transported from the hopper to the pouring site along the pipeline with the help of the concrete pump truck [1]. It has the advantages of adjustable pumping height, long conveying distance, large pumping concrete quality, fast conveying speed, high efficiency, continuous operation, labor saving, and strong economy. And it is widely used in various concrete construction projects [2]. Pumping system is the core part of the concrete pump truck [3], usually located in its tail. The reciprocating motion of the piston in the conveying cylinder is powered by the hydraulic system that converts the hydraulic energy into mechanical energy. With the cooperation of the S-pipe reversing work, the concrete in the hopper is sucked into the conveying cylinder to complete the suction work, while the concrete in the conveying cylinder is pushed through the S-pipe to the output pipe to complete the push work, as shown in Figure 1. During the pumping process, the stirring blade continuously stirs the fresh concrete in the hopper. Speeding up the flow of the fresh concrete that can ensure the fluidity of the fresh concrete in the hopper, promote the suction work, prevent the rapid solidification of the fresh concrete, and the blockage of the pipe at the bottom of the hopper. Optimizing the structural parameters of the stirring blade can improve the suction performance and reduce the energy consumption.
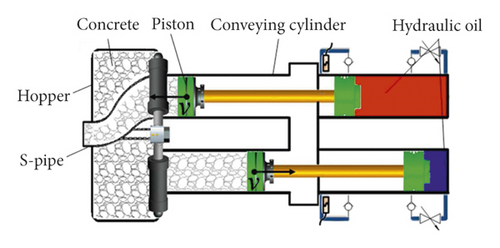
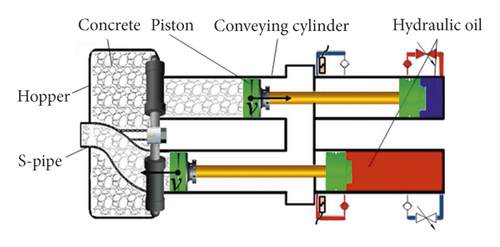
The actual experiments of pumping concrete are time-consuming and labor-intensive, while the numerical simulation technology can reduce the waste of resources and save the economy. In recent years, there were many numerical simulations of fresh concrete. Roussel et al. [4] roughly divided its types into three types: single-phase flow models [5–7], discrete particle flow models [8–10], and suspension flow models [11–13] and elaborated on the advantages and disadvantages of the three methods. Choi et al. [14] chose the single-phase fluid method and used Fluent to solve the complex concrete flow. The experimental, analytical, and numerical results found that the behavior of the lubricating layer is similar to that of mortar in terms of rheology. Zhan et al. [15] used the DEM to numerically simulate the local pumping problem and explored the influence of a series of factors on the local pumping performance, which were related to the pipe geometry, aggregate geometry, and pumping conditions. Shengqiang et al. [16] used a computational fluid dynamics-discrete element method (CFD-DEM) coupling model to explore the influence of structural parameters and inclination angles of tapered pipes, elbows and their combinations on pressure loss, and proposed a pump truck conveying pipeline. They used a single-objective optimization method to reduce the pressure loss (about 5.45%) in the pumping process. In addition, there were a lot of work on the optimal design of pumps [17–19]. Liu et al. [20] explored the influence of the geometry of inlet guide vanes (IGVs) on the stability of centrifugal pump operation, and prerotation adjustment of IGVs effectively adjusted the operation of centrifugal pump. The researches on pumping were mostly aimed at the pumping and flow of fresh concrete in the pipeline, but the researches on the process of concrete pumping and suction are very few. At present, there is still a lack of research on the suction process of the pumping system.
In this paper, the discrete element method simulated the suction process of fresh concrete in the pumping system, and the influence of the stirring blade on the suction is explored. First, the Hertz-Mindlin with JKR Cohesion contact model is used to establish the DEM model of fresh concrete, and the mechanical behavior of the concrete particles is described. Comparison between experiments and simulations of slump flow tests and L-box tests, the feasibility of simulating the flow behavior and rheological properties of the fresh concrete is proved. The geometric structure of pumping system is simplified. The suction force of the conveying cylinder is customized by the API function of DEM to realize the suction work; therefore, the numerical simulation of the suction process is completed. Next, the changes of the concrete flow field during the suction process are further studied, the particle flow velocity at different positions is considered, and the influence mechanism of the stirring blade on suction process is explained. In addition, the numerical simulation scheme is designed to explore the influence of the rotation speed, installation angle and edges distance of the stirring blade on the suction efficiency and the stirring resistance torque, and the structure of the stirring blade is optimized according to the influence law. Finally, verified by the results before and after optimization, the stirring resistance torque of the optimized stirring blade is reduced without the suction efficiency of the pumping system reduced, thereby the stirring energy consumption of the pump suction is reduced.
2. The Simulation of the Suction Process of the Pumping System
2.1. The Numerical Simulation Method
The discrete element method is that the discontinuous body is separated into a set of rigid elements, and the motion equation of each rigid element is solved by the method of time-step iteration, and then the overall motion shape of the discontinuous body is obtained. In the process of numerical simulation using the discrete element method, each particle in the material is used as a particle unit to establish a mathematical model, and the size and physical properties of the particle unit are given. Among them, there are two relations of contact and separation between each particle. When the contact occurs, the contact force and moment will be generated at the contact point, the magnitude of that can be calculated according to the contact mechanics model.
Figure 2 shows the typical plot of JKR normal force as a function of normal overlap.
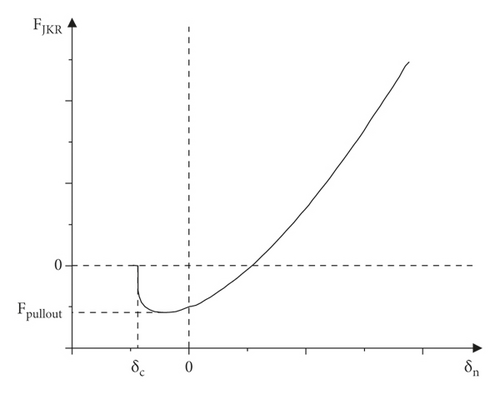
Hence, the adhesion of fresh concrete is determined by the surface energy, which is the basic parameter of the Hertz–Mindlin with JKR model. The viscosity of concrete flow is characterized by the adhesion of fresh concrete.
2.2. The DEM Model of Fresh Concrete
Fresh concrete is mainly mixed by water, cement, sand, coarse aggregate (stone), and various additives (concrete water-reducing agent or concrete retarder). The mix proportions for the fresh concrete are given in Table 1. The mass ratio of mortar (water + cement + sand + water-reducing agent + retarder) to coarse-aggregate is about 1.35.
| Water-cement ratio | Cement (kg/m3) | Sand (kg/m3) | Coarse aggregate (kg/m3) | Concrete water reducing (kg/m3) | Concrete retarder (kg/m3) |
|---|---|---|---|---|---|
| 0.42 | 390 | 900 | 1080 | 3.20 | 0.39 |
In the simulation, the fresh concrete is composed of coarse aggregate particles and mortar particles with a mass ratio of 1.35. In order to realize the feasibility of numerical simulation and the calculation efficiency, both particles are set as spheres. The diameter of mortar particles is uniformly 10 mm. According to experiments, the coarse aggregate particle size in the DEM model is normally distributed, with an average of 20 mm, a standard deviation of 5 mm, a minimum of 10 mm, and a maximum of 30 mm, as shown in Figure 3.
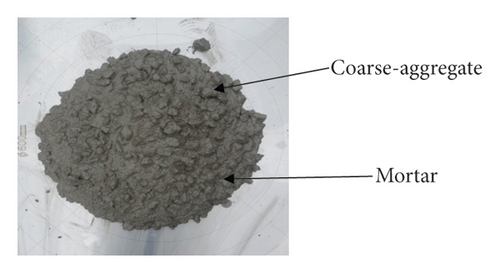
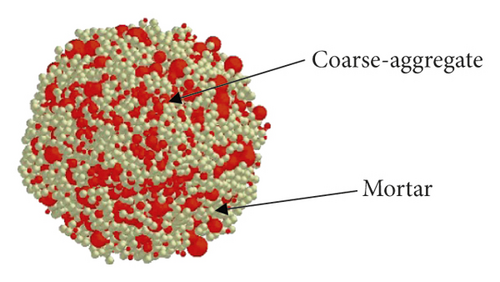
Under the hydration of cement, fresh concrete has strong adhesion. The adhesion not only exists between particles and particles but also particles and geometry. Compared with other contact models, the Hertz–Mindlin with JKR model has higher matching for fresh concrete, which has obvious cohesion effects [21]. The mechanical behaviors of fresh concrete discrete elements are described when they come into contact with each other.
2.3. The Validation of the Fresh Concrete DEM Model
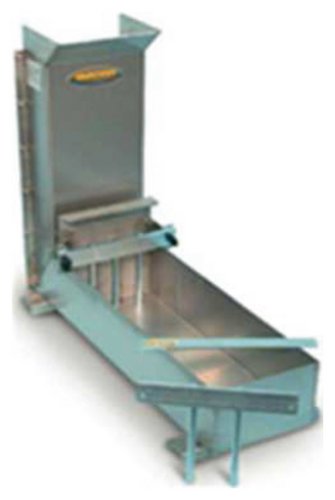
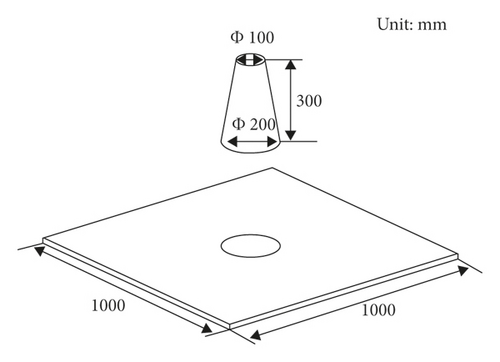
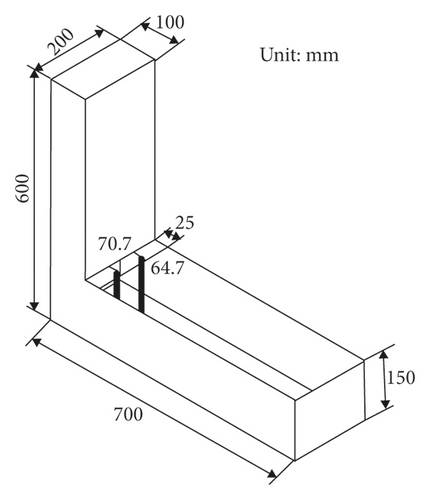
The rheological properties of fresh concrete are expressed by various standard tests, slump flow test, L-box test, and V-funnel test. In experiments, three slump tests and L-box tests were repeated, and the test results are averaged. In the simulations of slump flow tests and L-box tests, all the uncertain quantities in the DEM model of the fresh concrete were continuously adjusted so that the gap between experiments and simulations results is less than 5%. Figures 4(a) and 4(b) show the model of slump cone and L-box. Figures 4(c) and 4(d) show their dimensions.
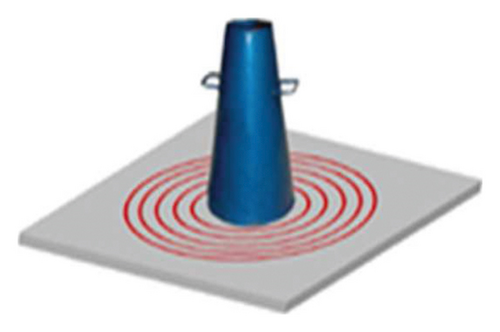
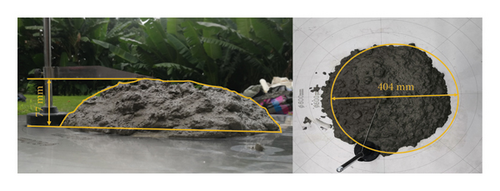
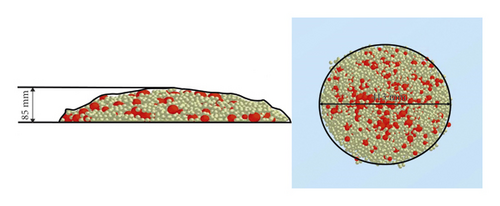
In experiments, after the fresh concrete collapses and stabilizes naturally, the average remaining height is 77 mm, the average slump value is 223 mm, and the average expansion value is 404 mm. In the simulation, the average remaining height is 85 mm, the slump value is 215 mm, which is 3.6% different from the experiments, and the expansion value is 413 mm, which is 2.2% different from the experiments. It is not difficult to find that the simulation is very similar to the experiments by observing the vertical and horizontal shape of fresh concrete carefully from Figures 5(a) and 5(b).
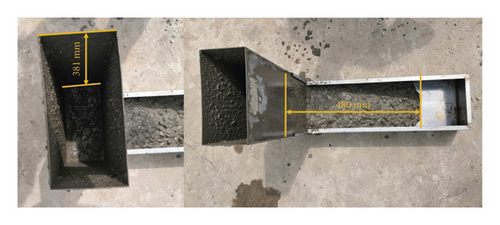
In experiments, when the fresh concrete stopped flowing naturally, the fresh concrete did not flow to the end of the L-box. The average height of the front end is 219 mm, and the flow distance is 480 mm. In the simulation, the average height of the front end is 224 mm, which is 2.3% different from the experiments, and the flow distance is 498 mm, which is 3.8% different from the experiments. Figures 6(a) and 6(b) show that the experiments and simulations of the L-box are also very similar.
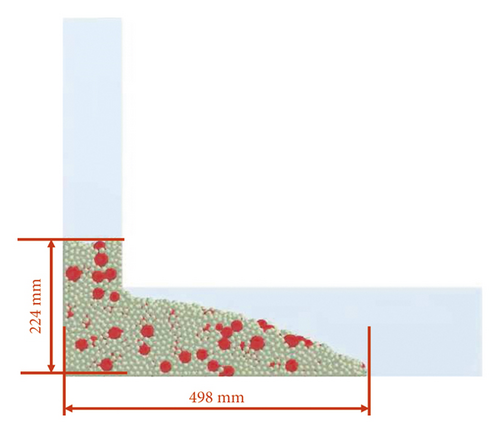
In short, the difference between the results of simulations and experiments is less than 5% for slump and L-box tests. The feasibility of simulating the flow behavior and rheological properties of the fresh concrete is proved. The DEM model of the fresh concrete will be applied to the numerical simulation of the pumping and suction process. The surface energy of the final DEM model of fresh concrete is shown in Table 2. The time step is set as 3.80675e − 06 s.
| Coarse aggregate-coarse aggregate | Coarse aggregate-mortar | Coarse aggregate-steel | Mortar-mortar | Mortar-steel | |
|---|---|---|---|---|---|
| Surface energy (J/m2) | 1 | 3 | 0.6 | 5 | 0.9 |
2.4. Realization of the Suction Work of the Pumping System
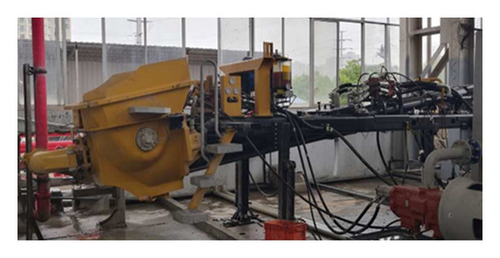
Pumping system is an executive mechanism to realize suction work and determine pumping performance, which is composed of pump transport mechanism, hopper, S valve, oscillating mechanism, stirring mechanism, conveying pipeline, and lubrication system. The pumping suction test device has an angle of 8° with the horizontal plane, the inner diameter of the conveying cylinder is 230 mm, and the pumping stroke is 1600 mm, as shown in Figures 7(a) and 7(b).
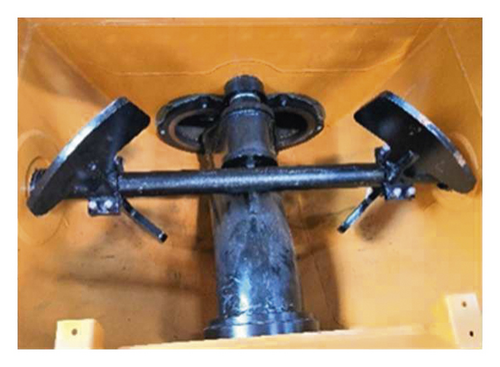
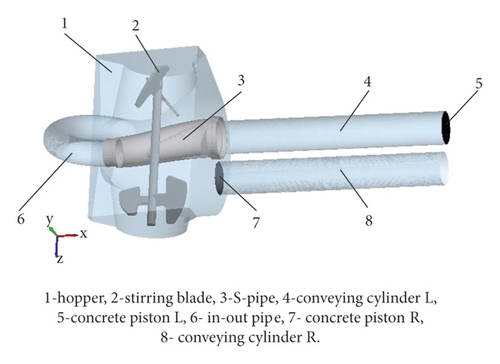
In the DEM numerical simulation, the main purpose is to study the interaction between particles and particles and between particles and geometric bodies. Therefore, only the geometries in direct contact with the fresh concrete particles in the pumping system need to be considered when establishing geometric models in simulation. There is a hopper, a stirring blade, a S-pipe, two conveying cylinders L and R, two concrete pistons L and R, and an in-out pipe, as shown in Figure 8.
Among them, M2 is theoretical suction mass that is the mass of the conveying cylinder completely filled with fresh concrete; M1 is actual suction mass that is the mass of the conveying cylinder actually filled with fresh concrete during a single suction process.
The average suction efficiency is 84.6% that is measured in experiments. The theoretical suction mass is 88.9 kg, which is measured in simulation.
In experiments, the hydraulic system converts hydraulic energy into mechanical energy, which drives the concrete piston to reciprocating motion in the conveying cylinder. The fresh concrete is sucked under the combined action of atmospheric pressure and gravity and pushed by the concrete piston. The suction process is mainly due to the movement of the concrete piston, and negative pressure is formed at the position of the piston port, which is manifested as the suction effect of the conveying piston cylinder.
In the above, F ′ is the resultant force of a particle at the beginning of the time step, F is the resultant force of the particle at the end of the last time step, Fsuction is the self-defined suction force, and m is the mass of the particle.
Figure 9(a) is the numerical simulation result without adding suction force (k = 0). The actual suction mass is 3.2 kg, and the suction efficiency is 3.60%. Figure 9(b) is the numerical simulation result with adding suction force (k = 66). The actual suction mass is 75.2 kg, and the suction efficiency is 84.59%. The relationship between the parameter k and suction efficiency is shown as Figure 10 according to the results of multiple numerical simulations. The value of parameter k is adjusted to meet the experimental suction efficiency, which required adjustment for some conditions, including the inclination angle of the pumping system, the pumping stroke, and the speed of the piston movement during suction. In this article, the inclination angle of the pumping system is 8°, the pumping stroke is 1600 mm, and the speed of the piston movement during suction is 1 m/s. Obviously, if suction force is not added, the actual suction mass is extremely small, and the suction work is difficult to complete. After adding suction force, the suction performance of the pumping system can be revealed. When k is 66, comparing the results in simulation with the results in experiments, the difference in suction efficiency is less than 0.1%. Therefore, it is necessary to add suction force and k is 66.
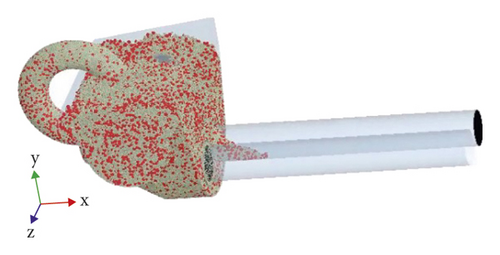
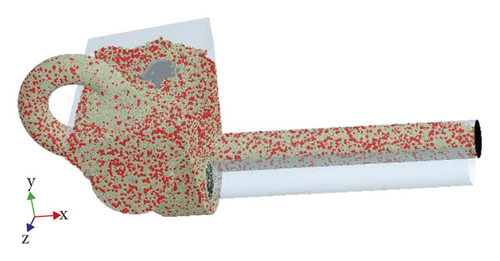

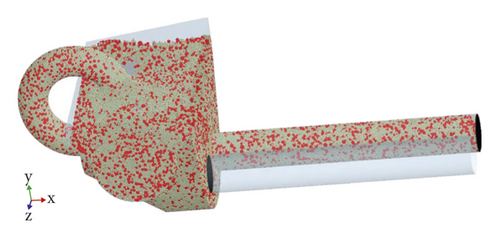
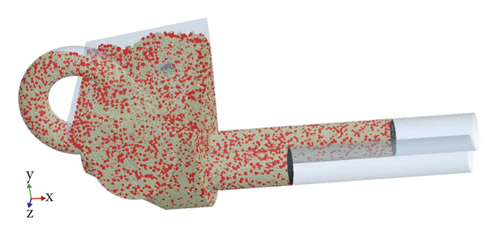
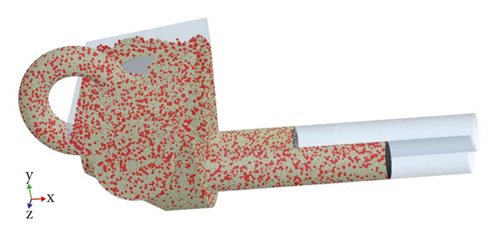
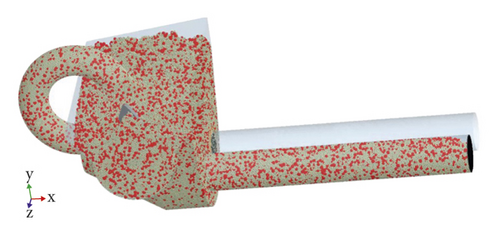
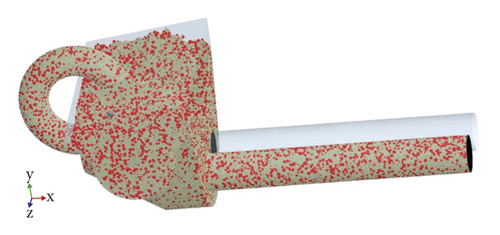
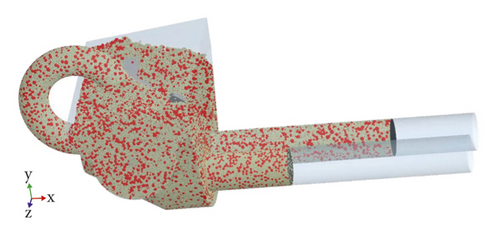
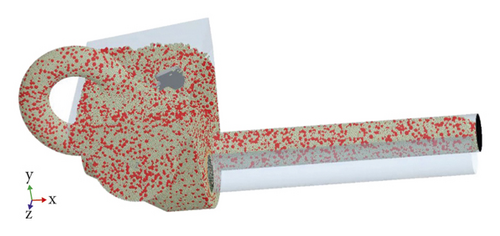
In the DEM numerical simulation, the total time is 7.7 s. Fresh concrete particles were generated in the hopper from 0 to 0.5 s. The movements of geometries are shown in Table 3 from 0.5 to 7.7 s. The stirring blade rotates at a fixed speed. The S-pipe swings and commutates during the commutating period that is 0.2 s. The stroke of the conveying cylinder is 1600 mm, and the time for each suction and push is 1.6 s. There is a pumping cycle of 3.6 s, a total of 2 cycles. The numerical simulation visualization process of the second pumping cycle (4.1−7.7 s) is shown in Figure 11.
| Time | Stirring blade | S-pipe | Concrete piston L | Conveying cylinder L | Concrete piston R | Conveying cylinder R |
|---|---|---|---|---|---|---|
| 0.5–2.1 s | 25 r/min | 0 | −1 m/s | Push | 1m/s | Suction |
| 4.1–5.9 s | ||||||
| 2.1–2.3 s | 6.12 rad/s | 0 | — | 0 | — | |
| 5.7–5.9 s | ||||||
| 2.3–3.9 s | 0 | 1m/s | Suction | −1 m/s | Push | |
| 5.9–7.5 s | ||||||
| 3.9–4.1 s | −6.12 rad/s | 0 | 0 | |||
| 7.5–7.7 |

3. Analysis of Concrete Flow
3.1. The Flow Field of Concrete Particles
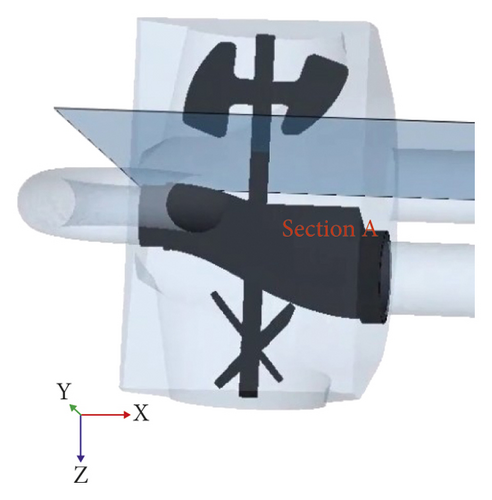
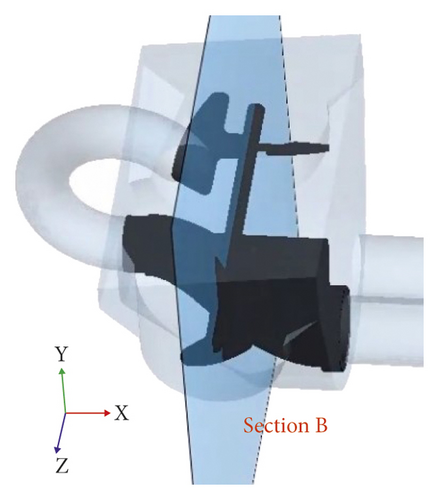
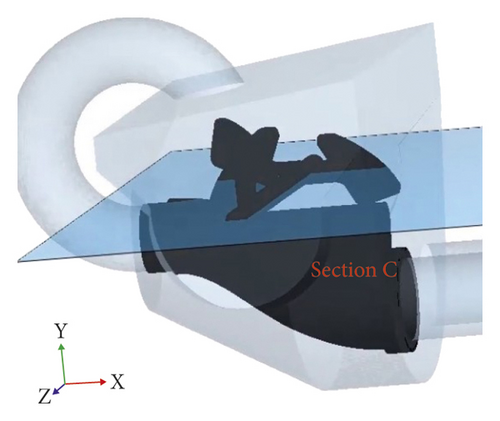
The particles velocity nephogram is used to represent the flow field of fresh concrete particles. In order to analyze the flow field in the pumping process, three sections A, B, and C are set up, as shown in Figure 12. Section A is perpendicular to the central axis of Z axis and passes through the central axis of the piston cylinder L. Section B is perpendicular to the central axis of Y axis and passes through the central axis of the stirring blade. And section C is perpendicular to the central axis of X axis and passes through the central axis of the stirring blade.
At 5.9 s, the S-pipe reversing is completed, and it is connected to the conveying cylinder R. The concrete flow rate in the swing area of the S-pipe is larger, and the concrete flow rate near the suction side of the stirring area of the stirring blade is larger than that far from the suction side.
From 5.9 to 7.5 s, the fresh concrete in the hopper is sucked into the conveying cylinder L, the S-pipe remains static, and the stirring blade keeps rotating. The concrete flow rate in the conveying cylinder L is relatively stable in the early and middle stages and decreases at the end of the suction process. The concrete flow rate in the stirring area of stirring blade has little change. Figures 13(a)–13(d) show the concrete flow field of sections A, B, and C at 5.9 s, 6.4 s, 7 s, and 7.5 s.
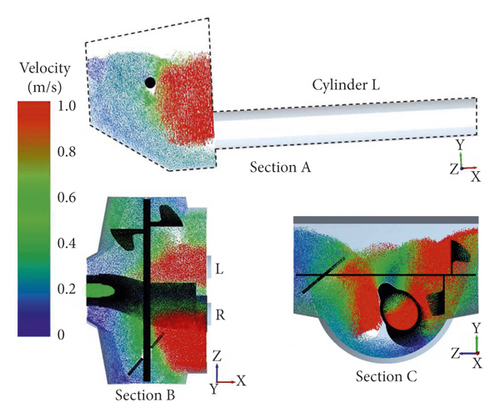
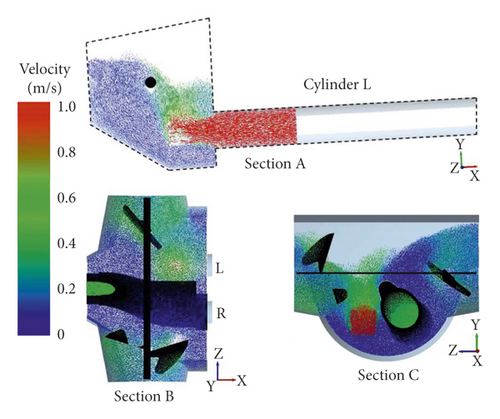
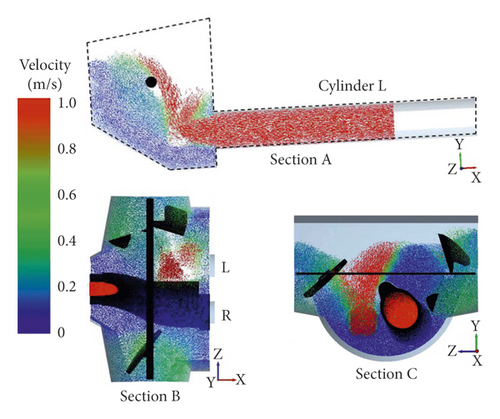
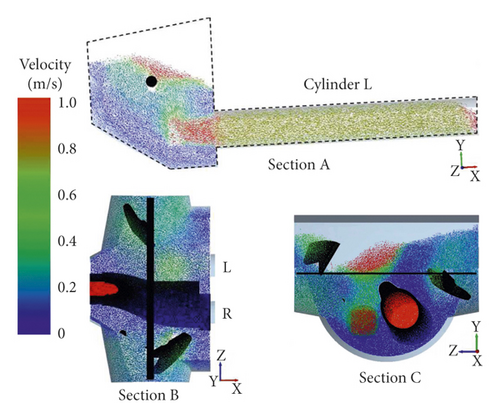
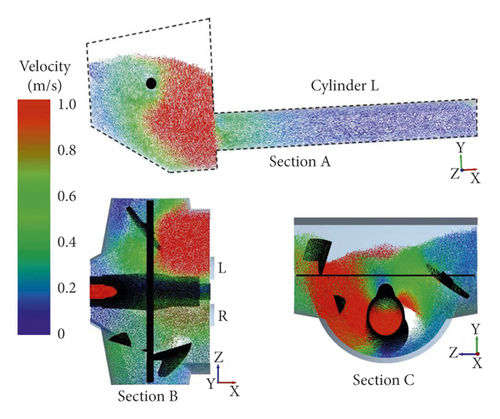
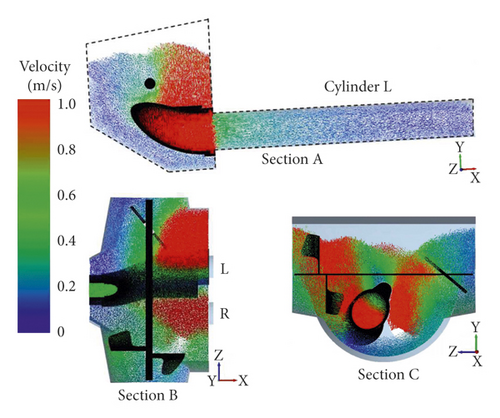
From 7.5 s to 7.7 s, the conveying cylinder L stops suction, the S-pipe swings and reverses, and the stirring blade continues to rotate. The flow field in the hopper changes greatly, and the concrete flow rate away from the suction side increases affected by the reversal of the S-pipe. Figure 13(e) and 13(f) show the concrete flow field of sections A, B, and C at 7.6 s and 7.7 s.
According to the numerical simulation of the suction process, the concrete flow rate near the wall of hopper is small. The concrete flow rate in the stirring area of the stirring blade changes little. The concrete flow rate in the piston cylinder is large in the early and middle stages and is lower at the end of suction. When the S-pipe swings, the concrete flow rate in the swing area is large.
3.2. The Flow Velocity of Concrete Particles
There are 5 typical positions in the hopper, as shown in Figure 14. Position 1 is at the center of the connection between the conveying cylinder L and the hopper, which is the necessary entrance and exit to suck and push fresh concrete. Position 2 is directly below the axis of the stirring blade, which is the edge of the rotation area of the stirring blade. Position 3 is located directly above the axis of the stirring blade and close to the shaft of the stirring blade, which is an area where the stirring blade cannot be swept. Position 4 is below the discharge end of the S-pipe, which is the area on the nonsuction side and close to the hopper wall in the hopper. Position 5 is located below the connection between the S-pipe and the conveying cylinder R, which is the suction side and near the hopper wall area in the hopper. Each position has a virtual grid for counting the concrete particle velocity, which the size is 60 mm × 60 mm × 60 mm. The center coordinates of grids are shown in Table 4.
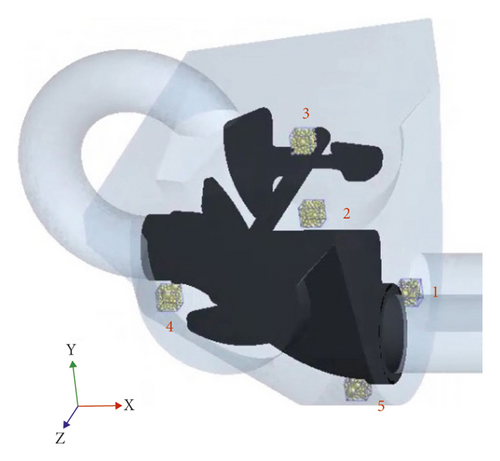
| Position | X | Y | Z |
|---|---|---|---|
| 1 | 347.5 | −210 | −147.5 |
| 2 | 0 | −70 | −400 |
| 3 | 0 | 160 | −550 |
| 4 | −337.5 | −160 | 0 |
| 5 | 250 | −380 | 147.5 |
Statistics of the concrete particle velocity at 5 locations, the change of particle velocity at different locations with time, and the average particle velocity are shown in Figure 15. The change cycle of the particle velocity at position 1 is the same as the pumping cycle. The particle velocity fluctuates greatly during the reversing phase of the S-pipe (2.1–2.3 s, 3.9–4.1 s, 5.7–5.9 s, 7.5–7.7 s), including the maximum value. It is relatively stable in the early and middle stages and has a slow downward trend at the end of suction. It is shown that the particle flow velocity caused by the reversal of the S-pipe is greater than that caused by the suction. The change of particle velocity in position 2 is related to the rotation of the stirring blade, and the velocity always reaches the maximum when the stirring blade is swept. Position 3 particle velocity changes very little. The particles of position 4 and position 5 are driven only when the S-pipe is reversing, and the particle velocity can be ignored at other times. When the S tube reverses, the particle velocity of position 4 is small while that of position 5 is large. During the whole pumping process, the average particle velocity of the 5 positions is 1, 2, 5, 3, 4 in descending order.
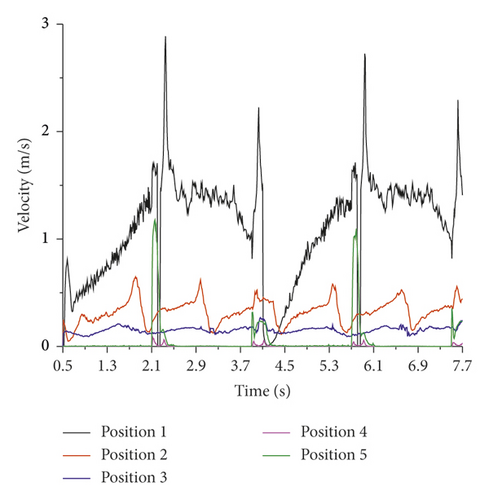
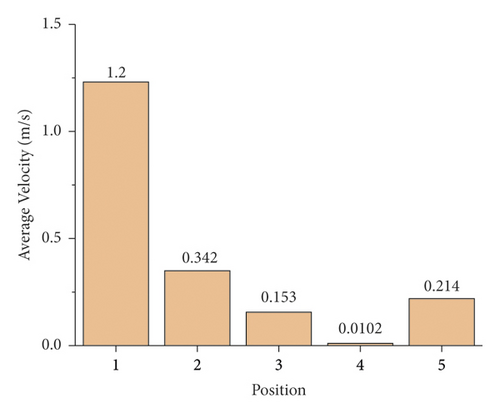
In terms of the particle flow velocity, the particle flow caused by the reversing work of the S-pipe is the largest, followed by the particle flow caused by the suction work of the conveying cylinder, and the particle flow caused by the stirring work of the stirring blade is the smallest. The particle flow velocity near the hopper wall near the suction side is larger than that far from the suction side. The S-pipe swinging time is short, and the stirring blade has a greater auxiliary effect on the suction work in a long time.
Figure 16 is the flow trajectory of concrete particles near the stirring blade on the suction side. During the suction process, the concrete particles near the axis of the stirring blade form an obvious circulation under the continuous stirring of the stirring blade. The concrete particles near the suction port of the conveying cylinder and above the suction port of the piston cylinder in the hopper continuously flow into the conveying cylinder.
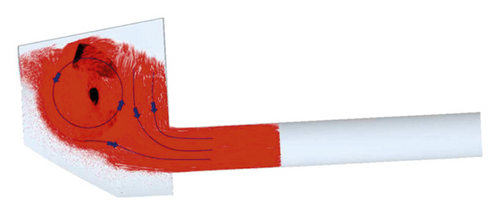
All in all, the stirring work makes the concrete particles in the hopper form an annular flow field around the stirring axis, ensuring the flow performance of the fresh concrete, and transporting concrete particles to the suction port of the conveying piston cylinder, thereby the suction of pumping system is promoted.
4. The Influence of the Stirring Blade Parameters
4.1. The Numerical Simulations
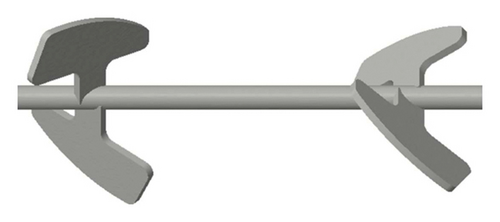
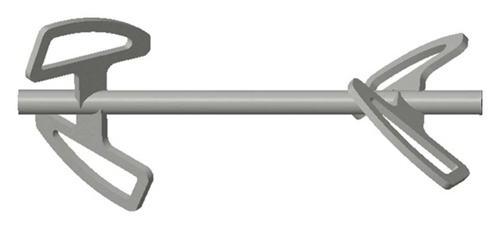
The stirring blade is composed of a stirring axis and four blades, which two blades are distributed at both ends of the axis. In the initial model of the stirring blade, the blade does not open holes, the angle between the blade plane and the axis (installation angle α) is 40°, and the stirring blade rotates at a constant speed of 25 r/min (rotation speed n) when working, as shown in Figure 17. In the following, the blade will be opened with a hole, in which the edges distance d refers to the distance between the inner and outer edges, as shown in Figure 18.
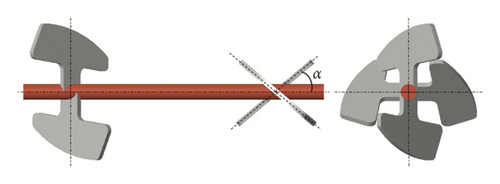
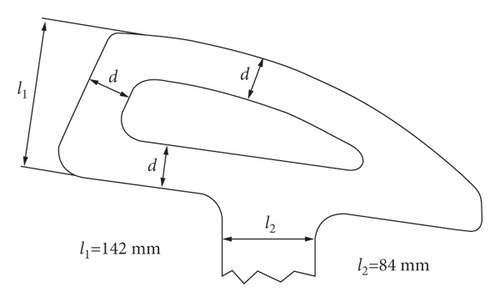
In this paper, the rotation speed n, the installation angle α, and the edges distance d of the stirring blade are considered as influencing factors that each factor is set to 4 levels. The suction efficiency η of the pumping suction process and the stirring resistance torque TM of the stirring blade are considered as indicators to explore the influence on the suction process. The single-factor comparison scheme is designed, which included a total of 10 simulations, as shown in Table 5. Among them, only the rotation speed is changed in simulations 1, 2, 3, 4; only the installation angle is changed in simulations 2, 5, 6, 7; only the edges distance d is changed in simulations 2, 8, 9, 10.
| No. | Edge distance d (mm) | Installation angle α (°) | Rotation speed n (r/min) |
|---|---|---|---|
| 1 | — | 40 | 20 |
| 2 | — | 40 | 25 |
| 3 | — | 40 | 30 |
| 4 | — | 40 | 35 |
| 5 | — | 35 | 25 |
| 6 | — | 45 | 25 |
| 7 | — | 50 | 25 |
| 8 | 50 | 40 | 25 |
| 9 | 40 | 40 | 25 |
| 10 | 30 | 40 | 25 |
- “—” means that the mixing blade does not perforate.
4.2. Results of Simulations
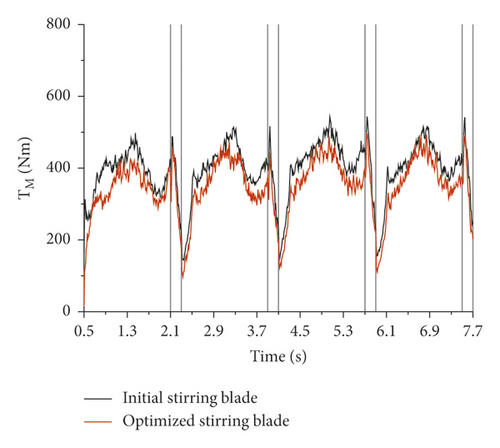
Figure 19 is the variation of the stirring resistance torque with time from the results of simulations. The change of the resistance torque of the mixing blade TM is periodic and the period is 1.8 s which is the sum of the single suction time and the single S-pipe reversing time. The stirring resistance torque always fluctuates greatly during the S-pipe reversing period, which reaches the peak value at the beginning, and reaches the valley value at the end. The increase and decrease of the stirring resistance torque at different rotation speeds are occurred at the different time, while the trends of stirring resistance torque with different installation angles and different edges distances are the same.
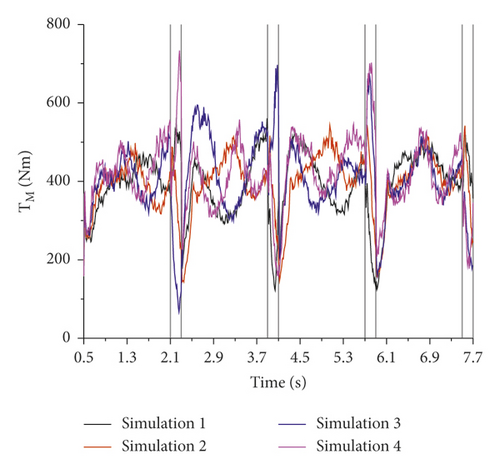
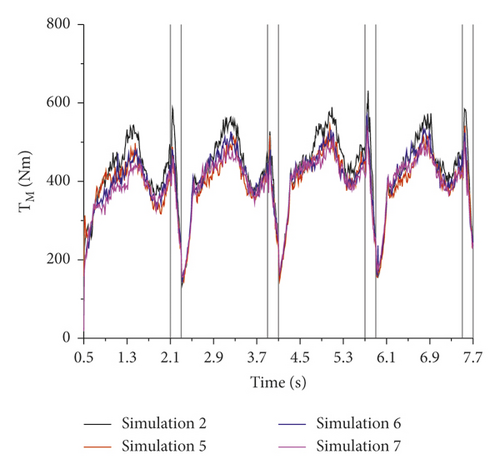
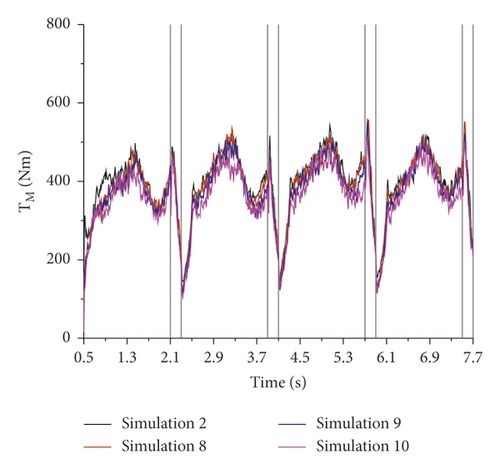
First, the influence of the rotation speed of the stirring blade on pump suction is revealed by comparing the results of simulations 1, 2, 3, and 4, as shown in Figure 20(a). As the rotation speed increases, the suction efficiency η increases and the average of stirring resistance torque increases. Second, the influence of the installation angle of the stirring blade on pump suction is revealed by comparing the results of simulations 2, 5, 6, and 7, as shown in Figure 20(b). As the installation angle a increases, the suction efficiency is almost unchanged and the average of stirring resistance torque decreases. Third, the influence of the edges distance d of the stirring blade on pump suction is revealed by comparing the results of simulations 2, 8, 9, and 10, as shown in Figure 20(c). Compared with the base blade, the suction efficiencies of three perforated blades are slightly reduced, and they are almost the same. In addition, the average stirring resistance torque of the perforated blades is greatly reduced. As the edges distance decreases, the opening area increases, and the average of stirring resistance torque decreases.
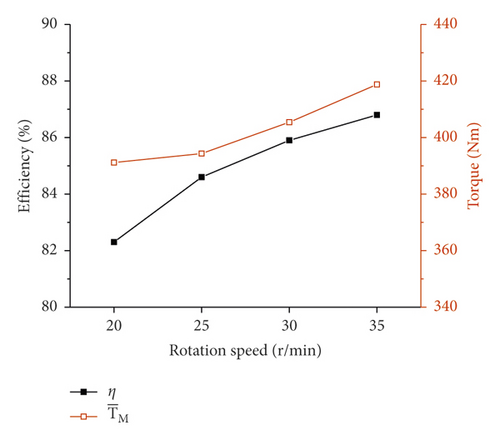
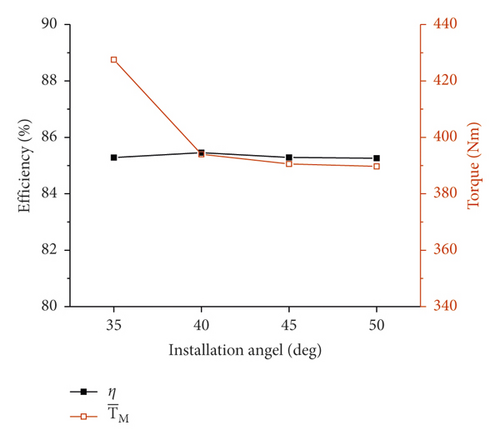
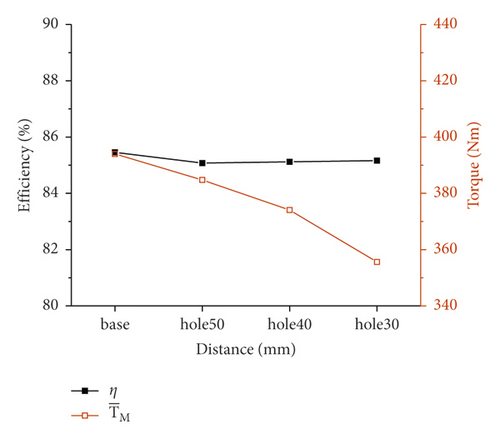
The rotation speed has a great influence on the suction efficiency, while the installation angle and the edges distance have almost no influence on the suction efficiency. Moreover, with the increase of the rotation speed, installation angle, and edges distance, the stirring resistance torque of the stirring blade increases.
4.3. The Influence Mechanism of the Stirring Blade Parameters
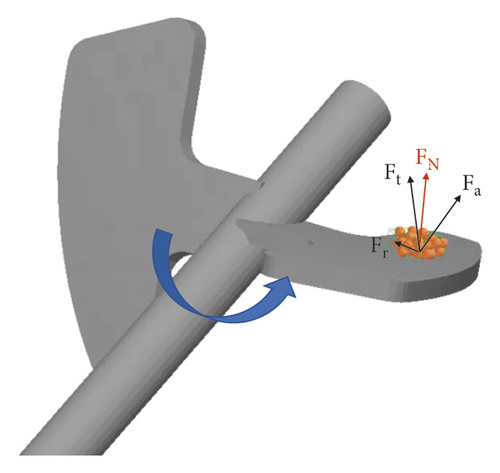
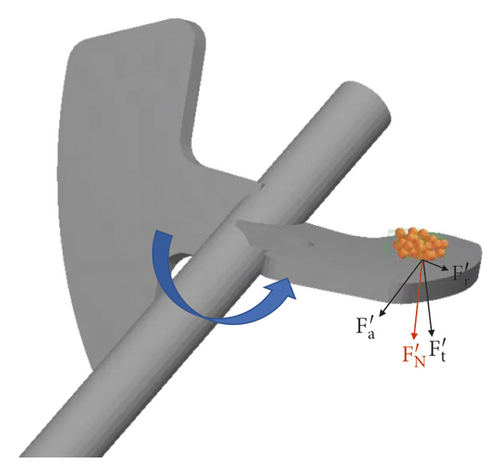
Changing the rotation speed is mainly to change the resisting force. With the increase of rotation speed, the resisting force increases, so the stirring resistance torque increases. The installation angle is changed, and the tangential force changes accordingly, as shown in formula (7). The larger the installation angle α, the smaller the tangential force and the smaller the stirring resistance torque. When the stirring blade is opened a hole, the area of the stirring blade is changed with the edges distance d. With the decrease of the edges distance, the area of the blade decreases, and the units of the stirring blade decreases, so the stirring resistance torque decreases. These rules are consistent with the simulation results.
5. Optimization
In order to reduce the stirring energy consumption of the stirring blade without reducing the suction efficiency, the structure of the initial stirring blade is optimized. The installation angle is improved from 40° to 50° and the blade is opened with a hole which the edges distance is 30 mm, as shown in Figure 22.
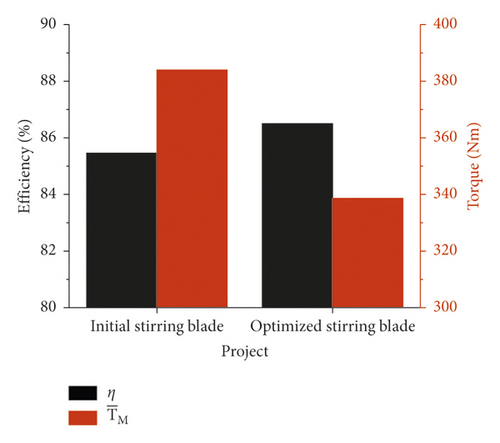
The pumping suction with the optimized stirring blade is simulated compared with the initial stirring blade. The simulation results are shown in Figure 23. After optimization, the trend of the stirring resistance torque is unchanged, the suction efficiency is increased by 1.22%, and the stirring resistance torque of the mixing blade is reduced by 11.8%. It is consistent with the expectation which reduces the stirring energy consumption of the stirring blade without reducing the suction efficiency.
6. Conclusions
The DEM model of fresh concrete was established. The gap between experiments and simulations results of slump flow tests and L-box tests was less than 5%, so the feasibility of simulating the flow behavior and rheological properties of the fresh concrete was proved.
The geometric structure of pumping system was simplified. The suction force of the conveying cylinder was customized by the API function of DEM to realize the suction work. The difference of suction efficiency in experiments and simulations was less than 0.1%. Therefore, the numerical simulation of the suction process was completed and feasible.
The concrete particles flow during the suction process was further studied. In terms of the particle flow velocity, the particle flow caused by the reversing work of the S-pipe was the largest, followed by the particle flow caused by the suction work of the conveying cylinder, and the particle flow caused by the stirring work of the stirring blade was the smallest. The stirring blade maked the concrete particles in the hopper form an annular flow field around the stirring axis, so the suction of pumping system was promoted.
In addition, the influence of the stirring blade was explored. The rotation speed had a great influence on the suction efficiency, while the installation angle and the edges distance had almost no influence on the suction efficiency. Moreover, with the increase of the rotation speed, installation angle, and edges distance, the stirring resistance torque of the stirring blade increased.
An optimized stirring blade was established and compared with the initial stirring blade. After optimization, the suction efficiency was increased by 1.22%, and the stirring resistance torque of the mixing blade was reduced by 11.8%. The stirring energy consumption of the stirring blade was reduced without the suction efficiency reduced.
Conflicts of Interest
The authors declare that they have no conflicts of interest.
Acknowledgments
This work was supported by the Natural Science Foundation of Hunan Province (2021JJ20009, 2020JJ5541, 2020JJ5538, 2019GK4025, and 2019JJ20015) and the NSFC projects of China (52075465 and 11772135). The authors are grateful for the financial support for this research.
Open Research
Data Availability
The data used to support the findings of this study are available from the corresponding author upon request.


