[Retracted] On Entropy Measures and Eccentricity-Based Descriptors of Polyamidoamine (PAMAM) Dendrimers
Abstract
Topological indices (TIs) assign a numeric value to a graph or a molecular structure. Due to their ability to predict the physiochemical properties of a molecular graph, several TIs have been introduced and studied, mainly based on degree and distance. For a vertex v, the maximum distance of v from any other vertex in a graph G is called the eccentricity of v, which is denoted by σ(v), in G. The eccentricity of vertices gained special attention among the distance-based or degree-distance based TIs. An important TI in the class of eccentricity-dependent TIs is an eccentricity-entropy index. Furthermore, other eccentricity-dependent TIs such as eccentric-connectivity index, total-eccentricity index, and the first Zagreb index have also been extensively studied. On the other hand, dendrimers came out as unique polymeric macromolecules because of extensively branched three-dimensional architectural characteristics. This structure design prepares for various unique properties of dendrimers, including monodispersity, multivalency, uniform size, globular shape, water solubility with hydrophobic internal cavities, and a high degree of branching. These properties make them attractive candidates for different applications. PAMAM (polyamidoamine) dendrimers are promising polymers that can be successfully used in various biomedical applications. The PAMAM dendrimers having different structures such as a primary amine as the end group or porphyrin core have been studied through graph-theoretic parameters. This paper studies these two types of PAMAM dendrimers through eccentricity-dependent parameters. In particular, we establish formulae of eccentricity entropy for two types of PAMAM dendrimers. Moreover, we also derive analytic formulae of some other significant TIs from the class of eccentricity-dependent TIs. Furthermore, we apply graphical tools to demonstrate the trends of the values in the obtained results.
1. Introduction
The numerical coding of nanomaterials and nanosized neural networks through topological descriptors plays a valuable role in forecasting several chemical, biological, and physical properties. Thus, the implementation of mathematics in nano- and neuroscience is securing momentum as the mutual advantages of this collaboration become gradually more obvious. In the modern era of computational chemistry, molecular structures are characterized by certain invariants associated with graphs, containing applications in QSAR/QSPR studies; see [1, 2]. These invariants may connect a matrix, a polynomial, a numeric number, a drawing, or a sequence of numbers to a graph (or a molecular structure). Such estimates either possess similar or identical tendencies for isomorphic graphs. One such innovative type of these invariants is a topological index (TI) of graphs (or molecular structures), which is sensitive to shape, bonding patterns, symmetry, size, and the contents of heteroatoms of a molecular structure. Therefore, the evaluation of the formulae of different TIs describe several features of molecular structures quantitatively, for example, see [3, 4]. The molecular graph consists of vertices and edges, where vertices represent the atoms in the molecule and edges are the chemical bonds between atoms. Since the structure of a molecule depends on the covalent bonds among its atoms, so the numerical graph invariants obtained from the information based on vertices and edges can disseminate structural information about the molecule. Several aspects of TIs and their applications, such as the Mostar index for nanostructures and graph operations [5, 6], topological aspects of lattice, metal-organic superlattice and dendrimers [3, 7, 8], irregularity measures for different derived graphs [9, 10], eccentric-connectivity polynomial and distance-dependent entropies [11–13], have been studied extensively over the years.
The history of topological descriptors goes back to 1947, when Wiener presented the first distance-based TI, called the Wiener index (WI), as a forecaster of the boiling point of paraffin [25]. Moreover, a distance-based TI is the eccentric-connectivity index (ECI), which was formulated by Sharma et al. [26]. Comparative analyses in terms of prediction of biological activity between the models based on these two TIs have been made for several drugs, which are utilized in Alzheimer’s disease [27], hypertension [28], inflammation [29], and HIV [30] and as diuretics [31]. In most of the cases, prediction power of ECI was observed to be more superior to those correspondingly derived from the WI. Consequently, there is substantial motivation to inquire this index and its related topological descriptors. We refer the readers to [25, 32–36] to examine several applications and mathematical aspects of this index. On the other hand, the higher branched macromolecules have excessively different features from the usual polymers. Their structural characteristics have a significant contribution to their use. These molecules are known to be dendrimers. They are highly branched, well-defined, and monodisperse macromolecules synthesized by iterative divergent or convergent protocols to different generations. The PAMAM dendrimers are made-up repetitiously branched units of amide and amine functionality. The best known and most commonly used ones in biological research are PAMAM and polypropyleneimine dendrimers. PAMAM dendrimers are characterized by unique characteristics that make them reliable candidates for many applications. The rapid growth of significance in the chemistry of PAMAM dendrimers has been observed since their first preparations. For more on the properties and use of PAMAM dendrimers, see [37, 38]. With the fast industry growth, including in the medical field, several novel nanomaterials, crystalline materials, and drugs come into view each year. To investigate the chemical properties of these many compounds and drugs, several chemical investigations are required, which increase the workload of the chemists and pharmacists. Consequently, the technique of studying these compounds which are based on computing different types of TIs has acquired more and more attention, which will become the mainstream growth trend in the future. This approach can help researchers get a lot of difficult or impossible information during the experiment. Researchers can use topological descriptors defined on the chemical molecule structure to understand better physical features, chemical reactivity, and biological activity. This paper studies two types of PAMAM dendrimers through eccentricity-dependent parameters. In particular, we establish formulae of eccentricity entropy for two types of PAMAM dendrimers. Moreover, we also derive analytic formulae of eccentric-connectivity index, total-eccentricity index, and the Zagreb index for these dendrimers. Furthermore, we apply graphical tools to demonstrate the trends of the values in the obtained results.
2. Results
In this section, we prove the main results of the paper. We start with the following subsection.
2.1. Eccentricity-Based Entropy of PAMAM Dendrimers with a Primary Amine as End Groups
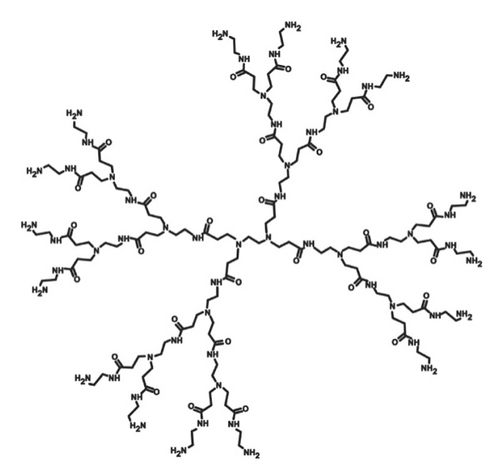
In PAMAM dendrimers with a primary amine as end groups, the initiator core is an ethylenediamine (EDA). EDA has four possible binding sites for amidoamine repeating units. The primary amino groups are on the surface of the molecule, and two new branches may be engaged to each of them. The number of end groups in nth generation EDA core PAMAM dendrimer can be found by the formula 2n + 2. The third generation of the PAMAM dendrimer with an EDA core and primary amine as the end group is shown in Figure 1. We denote the molecular graph of an EDA core PAMAM dendrimer with a primary amine as end groups with P1(n). It consists of four branches and the central core, which has four vertices. The total number of vertices in each branch is 13 × 20 + 13 × 21 + ⋯+13 × 2n−1 + 3 × 2n + 5 = 16 × 2n−1 − 8. Hence, the total number of vertices in this molecular graph is 4(16 × 2n−1 − 8) + 4 = 64 × 2n−1 − 28. In Reference [23], it is shown that for a given tree graph, it follows that |E(P1(n))| = |V(P1(n))| − 1. Since the EDA core PAMAM dendrimer with a primary amine as the end group is a tree graph, so the total number of edges is 64 × 2n−1 − 29. There are three types of vertices in nth generation of the EDA core PAMAM dendrimer with a primary amine as end groups with degrees 1,2, and 3.
To compute the distance-based entropy measure of the PAMAM dendrimer with a primary amine as the end group, we can partition the vertex set on the basis of degree and eccentricity. For this purpose, we make two sets of representatives of V(P1(n)), say A = {α1, α1}, and B = {si, ti, ui, vi, wi, xi, yi, zi}, where 1 ≤ i ≤ n. With this labelling, P1(2) is shown in Figure 2. In the ith generation, there are 2i+1 number of vertices with degree 2 and eccentricity 7n + 7i − 3, 2i+1 number of vertices with degree 2 and eccentricity 7n + 7i − 2, 2i+1 number of vertices with degree 3 and eccentricity 7n + 7i − 1, 2i+1 number of vertices with degree 1 and eccentricity 7n + 7i, 2i+1 number of vertices with degree 2 and eccentricity 7n + 7i, 2i+1 number of vertices with degree 2 and eccentricity 7n + 7i + 1, 2i+1 number of vertices with degree 2 and eccentricity 7n + 7i + 2, and for i ≠ n, 2i+1 number of vertices with degree 3 and eccentricity 7n + 7i + 3. Table 1 shows the detailed frequency of vertices with a specific degree and eccentricity at every generation of P1(n).
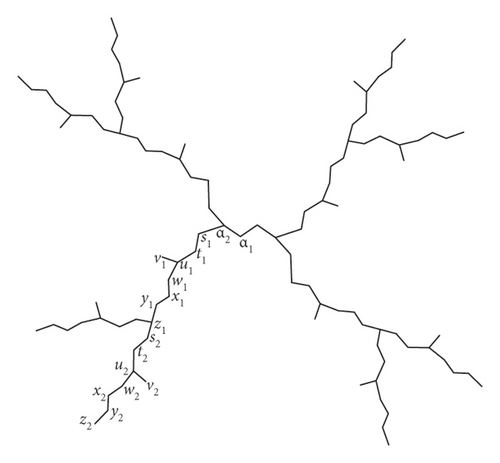
| Representative | Degree | Eccentricity | Frequency |
|---|---|---|---|
| α1 | 2 | 7n + 2 | 2 |
| α2 | 3 | 7n + 3 | 2 |
| si | 2 | 7n + 7i − 3 | 2i+1 |
| ti | 2 | 7n + 7i − 2 | 2i+1 |
| ui | 3 | 7n + 7i − 1 | 2i+1 |
| vi | 1 | 7n + 7i | 2i+1 |
| wi | 2 | 7n + 7i | 2i+1 |
| xi | 2 | 7n + 7i + 1 | 2i+1 |
| yi | 2 | 7n + 7i + 2 | 2i+1 |
| zi, i ≠ n | 3 | 7n + 7i + 3 | 2i+1 |
| zn | 2 | 14n + 3 | 2n+1 |
Now, we prove the main result of this subsection.
Theorem 1. For the PAMAM dendrimer with amino acid as end groups, the eccentricity-entropy measure is given by the following:
Proof. We will divide our proof in two parts. First, we will calculate for the value of T, then we will substitute this value in eccentricity entropy measure. Now, by using Table 1, we may calculate the value of T as follows:
Now,
Now, substituting the value of T, we obtain as follows:
The rest follows from simplifications.
2.2. Eccentricity-Based Entropy of PAMAM Dendrimers with a Porphyrin Core
In this subsection, we compute the eccentricity-based entropy of PAMAM dendrimers with a porphyrin core. The structural details related to PAMAM dendrimers with porphyrin core can be seen in [39]. We denote the molecular graph of this type of PAMAM dendrimers with P2(n). It is easy to observe that |V(P2(n))| = 16(2n+1 + 1) and |E(P2(n))| = 8(2n+3 + 3). To compute the distance-based entropy measure of the PAMAM dendrimer with a porphyrin core, we can partition the vertex set on the basis of degree and eccentricity. For this purpose, we make two sets of representatives of V(P2(n)), say C = {γ1, γ2, γ3, γ4, γ5, γ6} and D = {ai, bi, ci, di, ei, fi, gi, hi}, where 1 ≤ i ≤ n. With this labelling, P2(2) is shown in Figure 3. In the ith generation, there are 2i+1 number of vertices with degree 2 and eccentricity 7n + 7i + 10, 2i+1 number of vertices with degree 2 and eccentricity 7n + 7i + 11, 2i+1 number of vertices with degree 3 and eccentricity 7n + 7i + 12, 2i+1 number of vertices with degree 1 and eccentricity 7n + 7i + 13, 2i+1 number of vertices with degree 2 and eccentricity 7n + 7i + 13, 2i+1 number of vertices with degree 2 and eccentricity 7n + 7i + 14, 2i+1 number of vertices with degree 2 and eccentricity 7n + 7i + 15 and for i ≠ n, and 2i+1 number of vertices with degree 3 and eccentricity 7n + 7i + 16. Table 2 shows the detailed frequency of vertices with a specific degree and eccentricity at every generation of P2(n).
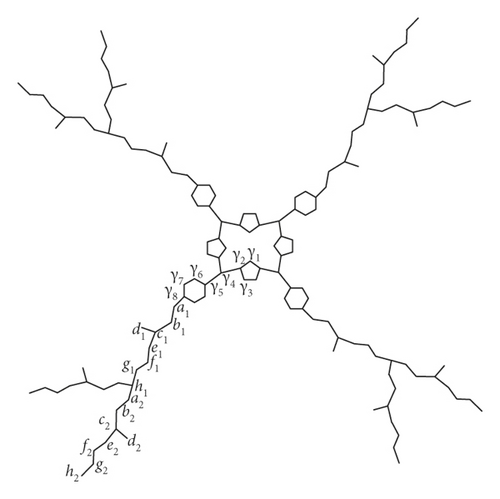
| Representative | Degree | Eccentricity | Frequency |
|---|---|---|---|
| γ1 | 2 | 7n + 10 | 4 |
| γ2 | 3 | 7n + 11 | 8 |
| γ3 | 2 | 7n + 11 | 8 |
| γ4 | 3 | 7n + 12 | 4 |
| γ5 | 3 | 7n + 13 | 4 |
| γ6 | 2 | 7n + 14 | 8 |
| γ7 | 2 | 7n + 15 | 8 |
| γ8 | 3 | 7n + 16 | 4 |
| ai | 2 | 7n + 7i + 10 | 2i+1 |
| bi | 2 | 7n + 7i + 11 | 2i+1 |
| ci | 3 | 7n + 7i + 12 | 2i+1 |
| di | 1 | 7n + 7i + 13 | 2i+1 |
| ei | 2 | 7n + 7i + 13 | 2i+1 |
| fi | 2 | 7n + 7i + 14 | 2i+1 |
| gi | 2 | 7n + 7i + 15 | 2i+1 |
| hi, i ≠ n | 3 | 7n + 7i + 16 | 2i+1 |
| hn | 2 | 14n + 16 | 2n+1 |
Now, we prove the main result of this subsection.
Theorem 2. For the PAMAM dendrimer with a porphyrin core P2(n), the eccentricity-entropy measure is given by the following:
Proof. We will divide our proof in two parts. First, we will calculate for the value of T; then, we will substitute this value in eccentricity entropy measure. Now, by using Table 2, we may calculate the value of T as follows:
Now, substituting the value of T, we obtain as follows:
The rest follows from simplifications.
2.3. Eccentricity-Based Indices of PAMAM Dendrimers
Multiple applications and graph-theoretical aspects of ξ(G) are presented in [36].
In the following theorems, we give the precise values of the eccentric-connectivity index for PAMAM dendrimers.
Theorem 3. For the PAMAM dendrimer with amino acid as end groups P1(n), ξ(P1(n)) is given by the following:
Proof. From Table 1 and the definition of ξ, we obtain as follows:
The rest follows from simplifications.
Theorem 4. For the PAMAM dendrimer with a porphyrin core P2(n), ξ(P2(n)) is given by the following:
Proof. From Table 2 and the definition of ξ, we obtain as follows:
The rest follows from simplifications.
Theorem 5. For the PAMAM dendrimer with amino acid as end groups P1(n), ς(P1(n)) is given by the following:
Proof. From Table 1 and the definition of ς, we obtain as follows:
Theorem 6. For the PAMAM dendrimer with a porphyrin core P2(n), ς(P2(n)) is given by the following:
Proof. From Table 2 and the definition of ς, we obtain as follows:
The rest follows from simplifications.
Theorem 7. For the PAMAM dendrimer with amino acid as end groups P1(n), Z1(P1(n)) is given by the following:
Proof. From Table 1 and the definition of Z1, we obtain as follows:
Theorem 8. For the PAMAM dendrimer with a porphyrin core P2(n), Z1(P2(n)) is given by the following:
Proof. From Table 2 and the definition of Z1, we obtain as follows:
The rest follows from simplifications.
3. Graphical Analysis
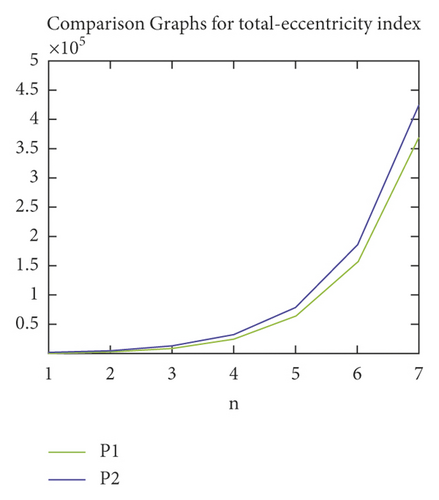
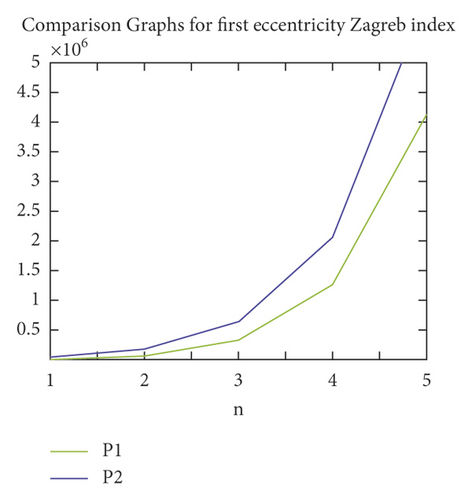
We proceed further with our obtained formulae in the previous section to study graphical patterns in the values of TIs of P1(n) and P2(n). In Figures 4–6, the patterns of ECI, TEI, and ZI (on y-axis), where the value of n has been taken on x-axis, for P1(n) and P2(n) have been presented. All the figure shows the rapid rise in the values of each TI for P1(n) and P2(n) with the rise in the value of n. The trends in Figures 4–6 show that the P2(n) attains higher values of ECI, TEI, and ZI as compared to P1(n).

4. Conclusion
Entropy measure is a transcendental and comprehensive approach in multiple expertise aspects, including biology, chemistry, statistics, discrete mathematics, computer science, and information theory. It relates the concept of uncertainty and randomness with physical conditions, which are constructed as transformation information channels. This paper provided the precise formulae for the entropy measures of the molecular graphs of different PAMAM dendrimers P1(n) and P2(n). Moreover, the formulae for other significant eccentricity-dependent TIs have also been proved for P1(n) and P2(n). The values of these TIs have been compared for P1(n) and P2(n). The results show that the values of TIs of P2(n) remain greater than the values of corresponding TIs of P1(n).
5. Disclosure
This research was carried out as a part of the employment of the authors.
Conflicts of Interest
The authors declare that they have no conflicts of interest.
Acknowledgments
All the authors are thankful to their respective institutes. This work was partially supported by the China Henan International Joint Laboratory for Multidimensional Topology and Carcinogenic Characteristics Analysis of Atmospheric Particulate Matter PM2.5.
Open Research
Data Availability
No additional data set is used to support the study.


