A DOE (Response Surface Methodology) Approach to Predict the Strength Properties of Concrete Incorporated with Jute and Bamboo Fibres and Silica Fumes
Abstract
Design of Experiment approach is adopted for deriving progression variables comprising jute fibres, bamboo fibres, and silica fumes. To obtain the optimal combination of progression variables, the effect of progression variable on the strength properties of concrete, Box–Behnken design of Response Surface Methodology was adopted. Totally four responses like compressive strength and split tensile strength at 14 days and 28 days were considered. Regression models for responses were tested using Analysis of Variance (ANOVA) and Pareto chart. The statistical importance of each progression variable was evaluated, and the attained models were articulated in second-order polynomial equation. The outcomes showed that addition of jute fibres, bamboo fibres, and silica fumes has enhanced the strength properties, but higher level of fibres incorporation exhibited reduction in strength. Surface plot, Pareto chart, and regression analysis outcomes show that the most substantial and influence factor at 14 days and 28 days for compressive strength is Jute fibres and for split tensile strength is both jute and bamboo fibres. The percentage of error of the validation tests is less than 4% for compressive strength and less than 3% for split tensile strength.
1. Introduction
Concrete reinforced with sustainable materials like natural fibres has growing demand in the construction industry. Natural fibres ensure the improvement in strength properties of concrete with nonhazardous impact on the environment. To achieve this, many researchers have used natural fibres as an effective reinforcing material [1–4]. Natural fibres help in high-energy absorption, postcracking resistance, and increased fatigue resistance of concrete [5]. Natural fibres and non-natural polymer-based fibres are most widely used to overcome the shortages of fibre-induced concrete with polymer-based fibre [6]. The deficiency with artificial fibres is health and environment hazards and their high costs. Natural fibre reinforced concrete is reinforced with jute and bamboo fibres having a small diameter and discrete natural fibres spread randomly in the concrete. They are beneficial concerning the energy and resources, economy, environment, and conservation. It reduces crack growth and increases mechanical properties [7, 8]. Jute, hemp, coconut, sisal, and bamboo are some of the commonly used natural fibres in cement composites to improve its strength characteristics. Including natural fibres in the cement matrix enhances the mechanical properties, impact strength, resistance against crack propagation, and energy captivation [9–11]. It was found that the mechanical properties, toughness, cracking behaviour, impact behaviour, and strain capacity of concrete increase with the inclusion of plant-based natural fibres [12]. The collective outcome of silica fume and steel fibres in concrete has increased the mechanical properties considerably, while the elastic modulus decreases due to the collective effect. The feasibility of using silica fume and sisal fibres for strength enhancement in concrete and test results in an increase in mechanical properties for M30 and M40 concrete [13, 14]. Incorporation of jute fibres with short and low fibre improves the mechanical properties of concrete with higher cement content. Due to its greater properties, jute fibres have wide applications in sporting industries, marine, automotive, and aerospace [15, 16]. Concrete with 0.5% of jute fibres having 50 mm length and 0.5 mm diameter and 10% of rice husk ash improved the impact resistance and mechanical properties of concrete [17]. Strength properties of concrete with 1% of bamboo fibres have enhancement about 22% and 17% for mechanical properties such as compressive strength and split tensile strength correspondingly; epoxy infiltrated bamboo composite increases strength properties of concrete when compared with untreated fibres, which makes them desirable for structural material applications [18, 19]. The response surface methodology Box–Behnken design is an optimization tool, which integrates mathematical models and experimental designs. It helps to reduce the number of experiment cycles and helps to test the adaptability of models [20]. The fresh and hardened properties of concrete containing E-waste and high-impact polystyrene predicted using response surface face-centred composite surface design models have desirability equal to 1 with experimental results [21]. The regression model developed using a central composite design is very accurate and specific for forecasting the compressive strength of self-compacting concrete and steel fibre reinforced self-compacting concrete. Based on the analysis of variance, the influence of cement is more significant than other variables as the linear effect of cement is greater [22]. Response surface methodology is an active tool for providing a suitable empirical model for predicting the optimum performance of an asphaltic mixture to decrease flexible pavement failure [23]. Response surface models developed to evaluate the reliability index of steel towers have the desired accuracy in comparison with that installed inland [24]. Compressive strength is predicted using response surface methodology (RSM) and the artificial neural networks (ANNs) with three variable processes modelling can be used, and both approaches are an effective tool in the prediction of the strength of concrete under compression [25]. Compressive strength is predicted using the RSM model using nondestructive tests which have high accuracy when compared to other models like the power-power model, bilinear model, double exponential model, and logarithmic model [26]. Experiments designed for Geopolymer concrete using Box–Behnken design of Response Surface Methodology showed an error of 2.24% when validated with experimental results [27]. The response surface models for 7 days, 28 days of compressive strength, and flexural strength presented the association and certainty between the response and the factors [28]. Based on the above research results, it is understood that only a few research studies have been conducted on the combined effect of bamboo and jute fibres with silica fume on the mechanical properties of concrete. The motivation behind this examination was to assess the impact of bamboo and jute fibres with silica fume in various proportions in concrete on the compressive, split tensile properties at 14 and 28 days of curing. Prediction of mechanical properties of natural fibre reinforced concrete containing jute and bamboo fibres is made with response surface methodology. Design of experiment (DOE) is used in designing a concrete with optimum proportion of silica fumes, jute fibers, and bamboo fibres. The effect of independent variables on experimental results can be studied with the help of the DOE method. The test variables can be optimised with DOE, which provides a relationship between the empirical model and independent variables and finally delivers an optimal response for experimental data [29]. To learn the impact of the autonomous variables on the outcomes with the least number of experiments, statistical and mathematical method of Design of Experiments (DOE), preferably response surface methodology, can be adopted [30–33]. Because of its efficiency in producing accurate results, it is widely used in concrete technology. To get the optimal composition of progression variables (silica fumes, jute fibres, and bamboo fibres) and to study the influence of progression variables on compressive strength and split tensile strength, Box–Behnken design (BBD)-RSM statistical analysis was performed. The independent variables are the weight fraction of silica fumes, jute fibres, and bamboo fibres.
2. Response Surface Method
| Variables | Minimum | Maximum |
|---|---|---|
| Silica fumes | 0 | 10 |
| Bamboo fibre | 0 | 1 |
| Jute fibre | 0 | 1 |
| Characteristics | Jute fibres | Bamboo fibres |
|---|---|---|
| Fibre length (mm) | 50 | 50 |
| Tensile strength (MPa) | 430 | 330 |
| Diameter (mm) | 0.2 | 1 |
| Aspect ratio | 250 | 50 |
| Density | 1.45 g/cm3 | 0.6 g/cm3 |
3. Materials and Testing
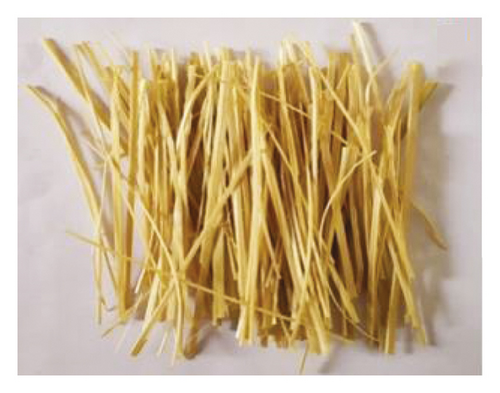
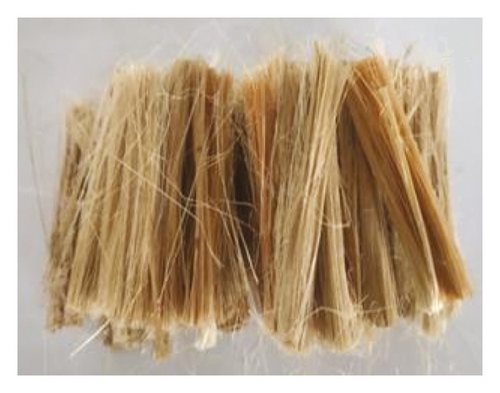
Ordinary Portland Cement of 53 grade complying as per Indian codal provision of IS 12269-2013 [37] having initial setting time 30 min and specific gravity 3.1 was used in this examination. Crushed stone coarse particles with twenty mm sized aggregates having a specific gravity of 2.81 and sand obtained from the river bed conforming to zone III having a specific gravity of 2.69 were utilized as per IS 10262 2019 [38]. Dark grey powdered silica fume with a specific gravity of 2.2 is used as an admixture in concrete. Untreated locally designated bamboo fibres with a 1 mm diameter and jute fibres with a 0.2 mm diameter, as arrayed in Figures 1(a) and 1(b), are used to prepare the concrete specimen. The mechanical properties of jute and bamboo fibres are arrayed in Table.2. The mixture of concrete has been designed as per IS10262: 2019 [38] depending on M25 grade. The proportion of the concrete mixture is 1 : 1.61 : 3.04 with the water cement ratio of 0.48. For preparing fibre reinforced concrete (FRC), jute fibres and bamboo fibres having a 50 mm length with percentage varying from 0% to 1% by weight of cement and silica fumes varying from 0% to 10% by cement weight were considered to measure the mechanical properties of concrete. To manufacture fibre reinforced concrete, jute and bamboo fibres are saturated in water for twenty-four hours, and they are air dried for thirty minutes before mixing them in concrete. Fibres are added in layers while mixing to prevent a balling effect, and fibres can be uniformly distributed. In addition, the quantity of fine aggregate and coarse aggregate and water for all mixes is kept unchanged. The specifications of the mix are given in Table 3.
| Mix designation | Silica fumes (%)(X1) | Jute fibre (%)(X2) | Bamboo fibre (%) (X3) | Fibre length (mm) | Coarse aggregate (kg/m3) | Fine aggregate (kg/m3) | Cement (kg/m3) |
|---|---|---|---|---|---|---|---|
| SFBJ1 | 10 | 0.5 | 0 | 50 | 1214.268 | 642.576 | 359.210 |
| SFBJ2 | 0 | 1 | 0.5 | 50 | 1214.268 | 642.576 | 399.125 |
| SFBJ3 | 0 | 0.5 | 1 | 50 | 1214.268 | 642.576 | 399.125 |
| SFBJ4 | 0 | 0 | 0.5 | 50 | 1214.268 | 642.576 | 399.125 |
| SFBJ5 | 5 | 1 | 1 | 50 | 1214.268 | 642.576 | 379.170 |
| SFBJ6 | 5 | 0 | 1 | 50 | 1214.268 | 642.576 | 379.170 |
| SFBJ7 | 5 | 1 | 0 | 50 | 1214.268 | 642.576 | 379.170 |
| SFBJ8 | 0 | 0.5 | 0 | 50 | 1214.268 | 642.576 | 399.125 |
| SFBJ9 | 10 | 0 | 0.5 | 50 | 1214.268 | 642.576 | 359.210 |
| SFBJ10 | 5 | 0.5 | 0.5 | 50 | 1214.268 | 642.576 | 379.170 |
| SFBJ11 | 5 | 0.5 | 0.5 | 50 | 1214.268 | 642.576 | 379.170 |
| SFBJ12 | 10 | 1 | 0.5 | 50 | 1214.268 | 642.576 | 359.210 |
| SFBJ13 | 5 | 0.5 | 0.5 | 50 | 1214.268 | 642.576 | 379.170 |
| SFBJ14 | 5 | 0 | 0 | 50 | 1214.268 | 642.576 | 379.170 |
| SFBJ15 | 10 | 0.5 | 1 | 50 | 1214.268 | 642.576 | 359.210 |
For the specifications arrayed in Table 3, concrete cubes of size 150 mm × 150 mm × 150 mm and cylinders of size 300 × 150 mm were cast. The cast cube specimen was tested for compressive strength and the cylinder specimen for split tensile strength at 14 and 28 days of curing as per IS 516-1959 [39]. The strength of concrete under compression is determined in a compression machine with a 1000 kN, while the concrete’s split tensile strength was attained indirectly, which was tested in a UTM with a 1000 kN load cell capacity.
4. Results and Discussion
4.1. Experimental Observations
4.1.1. Compression Strength
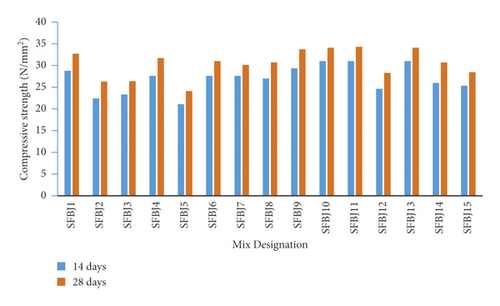
The effect of the incorporation of bamboo and jute fibres on the compressive strength of concrete with the replacement of SF was studied. The compressive strength results obtained from concrete containing jute fibres, bamboo fibres, and silica fumes at 14 days and 28 days of curing are given in Figure 2. The inclusion of jute and bamboo fibres has enhanced the mechanical properties of concrete, but for elevated fibre percentage, the same was reduced. Inclusion of fibre has shown very less significance in the compressive strength of concrete; only marginal variations are observed [40, 41]. Based on the test results, it is observed that the maximum compressive strength is obtained for SFBJ11, which increases by 15.24% and 8% at 14 days and 28 days when compared to SFBJ01. A decreasing trend of compressive strength was observed with the inclusion of jute fibres due to the high porosity of the JFRCC and low specific gravity with respect to the reference concrete [42].
4.1.2. Split Tensile Strength
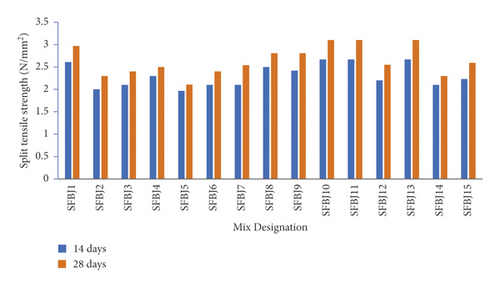
The split tensile strength investigation under 14 days and 28 days of curing was accomplished, and fibre reinforced concrete with different combinations of bamboo and jute fibres with silica fumes and strength is arrayed in Figure 3. The results show that split tensile strength increases by 14.61% and 13.87% for 14 and 28 days curing for SFBJ11 i.e., concrete with 0.5% bamboo fibres and 0.5% jute fibres with 5% silica fumes by weight of cement when compared with SFBJ01. From the results, it is apparent that the jute and bamboo fibres contribute to a rise in split tensile strength. Moreover, owing to unequal distribution of fibre in concrete, split tensile strength decreases for the concrete specimen having jute and bamboo fibres more than 0.5% by weight of cement [42].
4.1.3. RSM Modelling: Observations and Discussion
| Mix designation | Compressive strength | Split tensile strength | ||||||
|---|---|---|---|---|---|---|---|---|
| 14 days | 28 days | 14 days | 28 days | |||||
| Exp | RSM | Exp | RSM | Exp | RSM | Exp | RSM | |
| SFBJ1 | 28.79 | 28.24 | 32.71 | 32.43 | 2.61 | 2.51 | 2.97 | 2.88 |
| SFBJ2 | 22.41 | 22.22 | 26.29 | 26.36 | 2 | 2.07 | 2.3 | 2.42 |
| SFBJ3 | 23.32 | 22.81 | 26.4 | 26.75 | 2.1 | 2.05 | 2.4 | 2.41 |
| SFBJ4 | 27.6 | 26.32 | 31.72 | 30.69 | 2.3 | 2.21 | 2.5 | 2.58 |
| SFBJ5 | 21.1 | 22.02 | 24.1 | 25.65 | 1.97 | 2.06 | 2.11 | 2.37 |
| SFBJ6 | 27.6 | 26.00 | 31 | 29.77 | 2.1 | 2.21 | 2.4 | 2.57 |
| SFBJ7 | 27.61 | 24.23 | 30.12 | 28.45 | 2.1 | 2.29 | 2.54 | 2.64 |
| SFBJ8 | 27 | 25.14 | 30.7 | 29.75 | 2.5 | 2.26 | 2.81 | 2.64 |
| SFBJ9 | 29.34 | 29.42 | 33.72 | 33.37 | 2.42 | 2.45 | 2.81 | 2.81 |
| SFBJ10 | 31 | 26.16 | 34.1 | 30.24 | 2.67 | 2.30 | 3.1 | 2.67 |
| SFBJ11 | 31 | 26.16 | 34.3 | 30.24 | 2.67 | 2.30 | 3.1 | 2.67 |
| SFBJ12 | 24.61 | 25.32 | 28.29 | 29.04 | 2.2 | 2.32 | 2.55 | 2.65 |
| SFBJ13 | 31 | 26.16 | 34.1 | 30.24 | 2.67 | 2.30 | 3.1 | 2.67 |
| SFBJ14 | 26 | 28.45 | 30.7 | 32.98 | 2.1 | 2.40 | 2.3 | 2.77 |
| SFBJ15 | 25.33 | 25.91 | 28.46 | 29.43 | 2.23 | 2.30 | 2.59 | 2.65 |
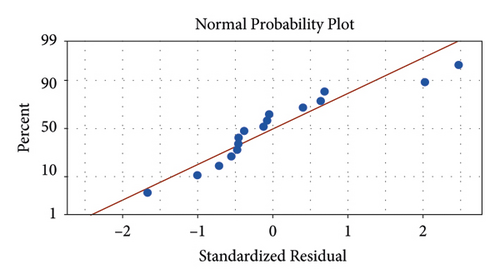
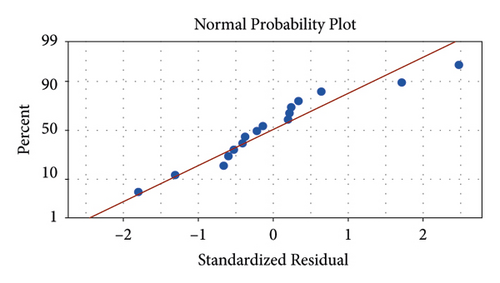
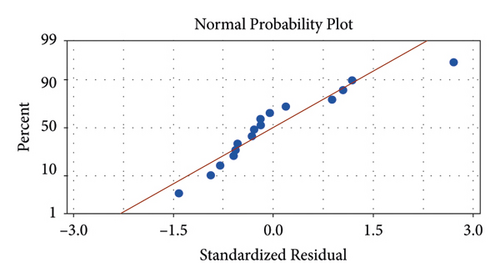
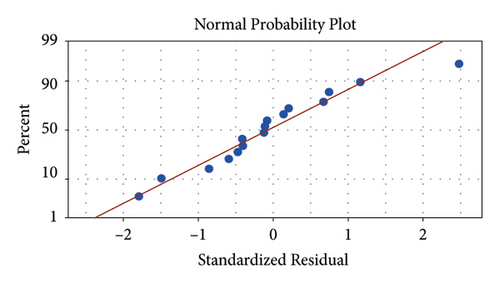
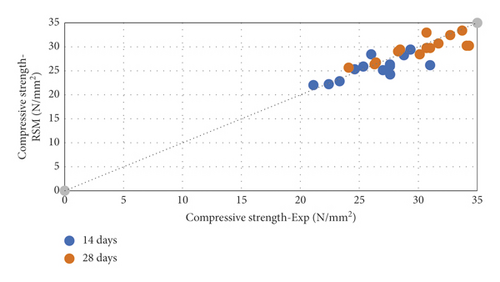
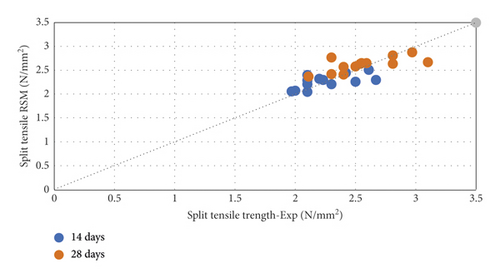
The residual fit for normal probability plots for each response is shown in Figure 4. From Figure 4, it is evident that all the residuals of all the responses fall near the straight line which shows that errors are distributed evenly. To study the association between progression variables and responses, a collection of statistical models and its assessment process called Analysis of variance (ANOVA) are used and the same is summarised in Table 5. From Table 5, it is evident that the models were highly suitable as the lack of fit (p value) was less than 0.005. From Table 6, it is evident that responses of the models were accurate as the variation between the predicted R2 and the adjustable R2 of all responses was lesser than 20%. Moreover, the R2 value of fcs14,fcs28,fSTS14 , and fSTS28 was 97.23%, 98.27%, 92.23%, and 96.29%, respectively. Figures 5 and 6 show the relationship between predicted and experimental values. From Figures 5 and 6, it is obvious that predicted values go in hand with experimental results conforming that model established can be used to predictfcs14 ,fcs28,fSTS14 , and fSTS28. The correctness of the model could be validated by means of F value of the models and its significant based on higher values of F. From Table 5, we can see the F values of 39.39, 43.50, 16.81, and 21.70 in the responses of fcs14, fcs28,fSTS14 , and fSTS28, respectively, signifying that the models are more substantial.
| Source | Compressive strength (fcs14) | Compressive strength (fcs28) | Split tensile strength (fSTS14 | Split tensile strength (fSTS28) | ||||||||
|---|---|---|---|---|---|---|---|---|---|---|---|---|
| DF | F value | P value | DF | F value | P value | DF | F value | P value | DF | F value | P value | |
| Model | 6 | 11.01 | 0.001 | 6 | 13.65 | ≤0.001 | 6 | 5.09 | 0.002 | 6 | 7.53 | 0.003 |
| Linear | 3 | 21.28 | ≤0.001 | 3 | 26.41 | ≤0.001 | 3 | 9.76 | 0.003 | 3 | 14.40 | 0.001 |
| X1 | 1 | 2.09 | 0.179 | 1 | 1.57 | 0.239 | 1 | 1.81 | 0.208 | 1 | 1.64 | 0.230 |
| X2 | 1 | 39.39 | ≤0.001 | 1 | 43.50 | ≤0.001 | 1 | 11.99 | 0.004 | 1 | 20.00 | 0.001 |
| X3 | 1 | 22.00 | 0.001 | 1 | 31.27 | ≤0.001 | 1 | 16.81 | 0.002 | 1 | 21.70 | 0.001 |
| Square | 2 | 1.49 | 0.272 | 2 | 1.60 | 0.249 | 2 | 0.77 | 0.487 | 2 | 1.39 | 0.293 |
| 1 | 0.68 | 0.002 | 1 | 0.80 | 0.001 | 1 | 1.16 | 0.003 | 1 | 2.27 | 0.005 | |
| 1 | 2.30 | 0.161 | 1 | 2.41 | 0.152 | 1 | 0.39 | 0.002 | 1 | 0.50 | 0.003 | |
| Two-way interaction | 1 | 0.03 | 0.861 | 1 | 0.09 | 0.767 | 1 | 0.13 | 0.731 | 1 | 0.38 | 0.549 |
| X2∗X3 | 1 | 0.03 | 0.861 | 1 | 0.09 | 0.767 | 1 | 0.13 | 0.731 | 1 | 0.38 | 0.549 |
| Responses | R2 (%) | Adjusted R2 (%) | Predicted R2 (%) | Difference between adjusted R2 and predicted R2 (%) | P value |
|---|---|---|---|---|---|
| Compressive strength (fcs14) | 97.23 | 92.24 | 88.23 | 4 | ≤0.001 |
| Compressive strength (fcs28) | 98.27 | 95.16 | 89.13 | 6 | ≤0.001 |
| Split tensile strength (fSTS14 | 92.23 | 88.22 | 81.23 | 7 | 0.003 |
| Split tensile strength (fSTS28) | 96.29 | 89.90 | 80.23 | 10 | 0.001 |
4.1.4. Lack of Fit (P Value) and Pareto Analysis
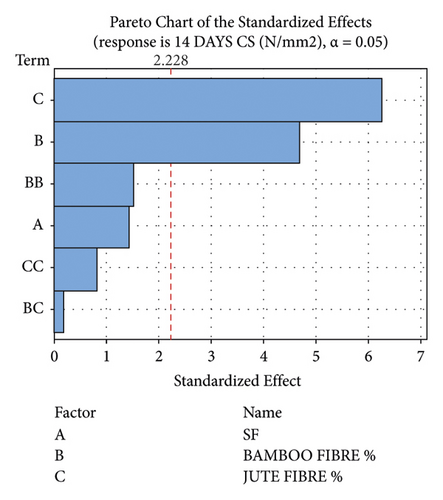
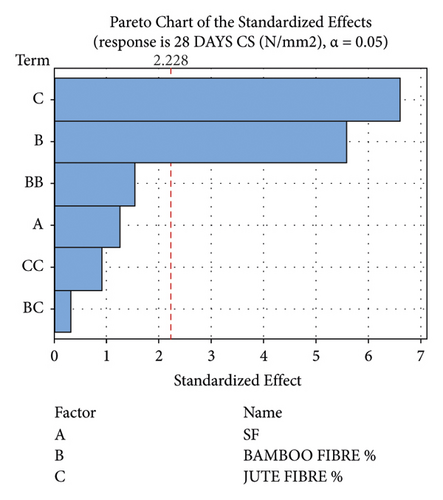
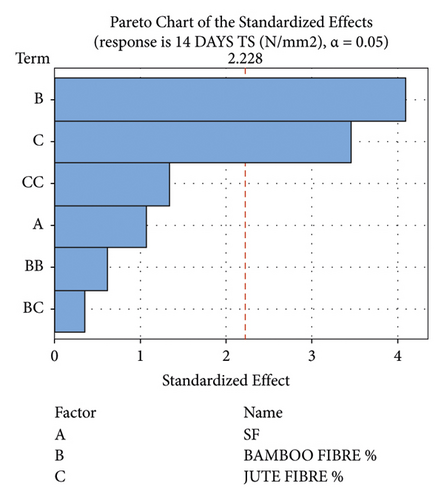
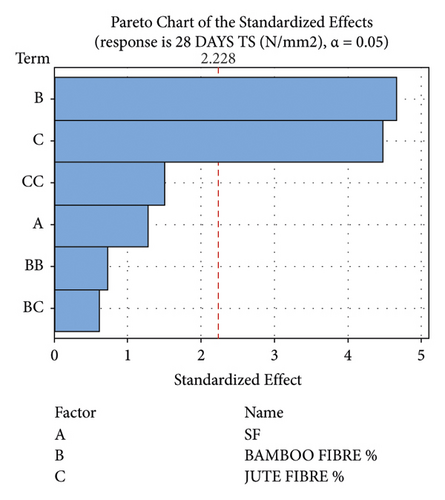
The P value helps to find the significances of progression variables. The P value of the model is the possibility value of the F test which should be minimum. The progression variable can be measured as substantial and highly substantial if the P value of the progression variable is <0.005 and <0.001, respectively. If the p value of the progression variable is more than 0.005, then it is considered as insignificant. From ANNOVA Table 5, P value of X2, X3, and for fcs14 and fcs28 was less than 0.005, but the p values of the linear X1were higher than 0.005. While considering the bamboo fibres, the influence is unimportant and the P value of both linear X3 and the quadratic is greater than 0.005 which clearly shows that bamboo fibres and silica fumes show lower significance in compressive strength at 14 days and 28 days. From the Pareto chart as shown in Figures 7(a) and 7(b), the value of linear (C) was higher when compared to linear (A & B) which shows that jute fibres are more significant than bamboo and silica fumes for compressive strength at 14 days and 28 days curing. Similarly, from ANOVA Table 5, the P value of linear X2is higher when compared to X1and X3 which shows that jute fibres may be the most substantial factor in evaluating the strength of concrete under compression. The observations agree with previous literatures which clearly state that fibres inclusion in concrete has less significance in compressive strength; on the other hand, the fibre addition may enhance the tensile strength significantly. Considering the tensile strength at 14 days and 28 days, X2, X3, , and , jute and bamboo fibres contribute to tensile strength, of which bamboo fibres were more substantial and the p value is less than 0.005. As the linear X1 was more than 0.005, silica fumes was considered as insignificant. From Figures 7(c) and 7(d), the linear (C) and homogenous effect of bamboo fibre was higher than silica fumes and nearby to jute fibres, which are higher than the standard values of 2.23 for both fSTS14 andfSTS28. The tensile strength of concrete increases due to bridging effect between concrete and fibres. From the response of fcs14 ,fcs28, fSTS14 , andfSTS28, it is apparent that the inclusion of jute fibres in the concrete influences/increases the compressive strength properties and the addition of Bamboo fibres significantly improves the tensile strength.
4.1.5. Surface Plot Analysis and Optimization of Progression Variables
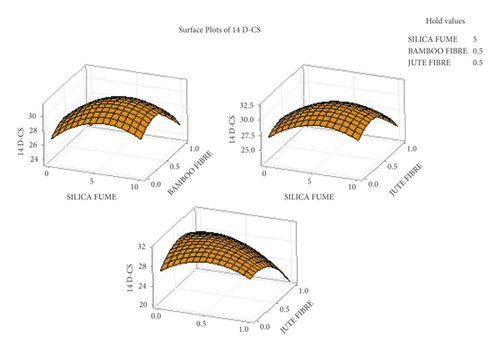
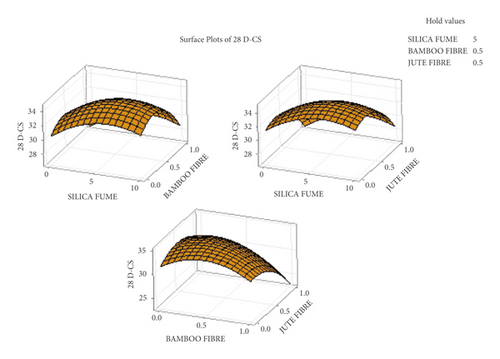
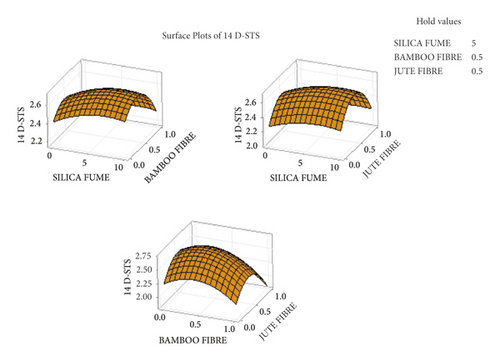
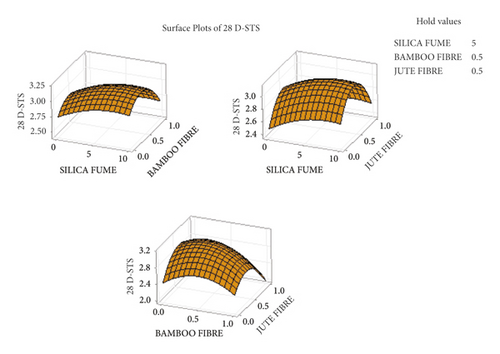
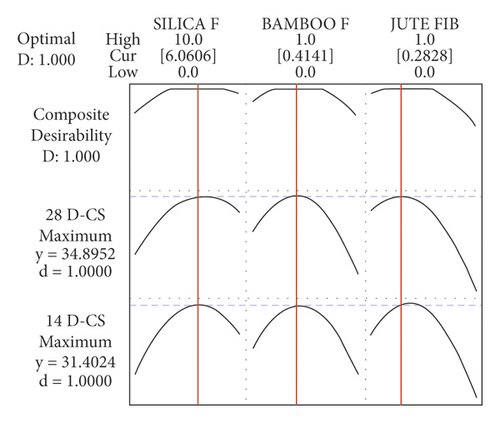
Three-dimensional (3D) surface plots are plotted in Figures 8 and 9 to comprehend the influence of progression variables on the responses. In the surface plot, the progression variables of bamboo fibre, jute fibre, and silica fumes were plotted in “x” and “y” directions, and the response was plotted on the “z” axis. From Figure 8, it is learnt that the increase in the percentage by weight of cement of bamboo fibres from 0% to 0.5% and jute fibres from 0% to 0.5% with 5% silica fumes has the extreme compressive strength at 14 days and 28 days curing, and above 0.5%, the strength decreases. Although the addition of jute fibres and silica fumes moderately enhanced the compressive strength of concrete, the influence of jute fibres was more substantial than the bamboo fibres and silica fumes at 14 days and 28 days of curing. In addition, the weight fraction of jute fibres beyond 0.5% and silica fumes beyond 5% has reduced the compressive strength. From the 3D surface plot, it is understood that the maximum compressive strength of fcs14 and fcs28 was obtained for the smallest fraction of 0.5% jute fibres, 0.5% bamboo fibres, and 5% silica fumes. The optimised strength under compression of fcs14 and fcs28 is shown in Figure 10(a). The notation “y” and “d” plotted in Figure 10(a) refers the maximum strength value and desirability of the progression variables from zero to one, where zero indicates the undesirable grouping and one represents the desirable grouping. From Figure 10(a), it can be seen that to attain the highest compressive strength at 14 days and 28 days, the optimum value of silica fumes, bamboo fibres, and jute fibres was 6.060%, 0.4141%, and 0.2826%, respectively. The validation test was executed to confirm the outcomes as shown in Table 7. From Table 7, the percentage of error for fcs14 and fcs28 was 3.35% and 3.03%, respectively.
| Strength properties | Silica fumes | Jute fibres | Bamboo fibres | Predicted result RSM | Confirmation results | Error (%) |
|---|---|---|---|---|---|---|
| fcs14 | 6.0606 | 0.2826 | 0.4141 | 27.50 | 26.58 | 3.35 |
| fcs28 | 6.0606 | 0.2826 | 0.4141 | 31.64 | 30.68 | 3.03 |
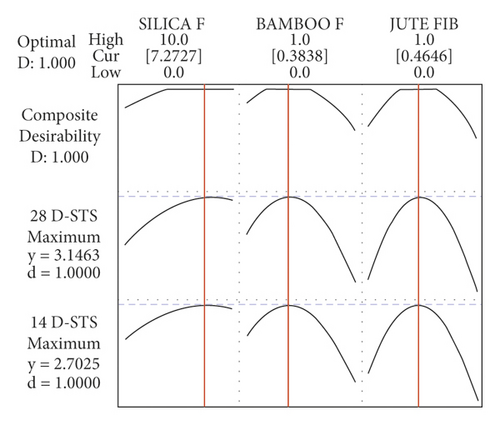
| fSTS14 | 7.2727 | 0.4646 | 0.3838 | 2.39 | 2.32 | 2.93 |
| fSTS28 | 7.2727 | 0.4646 | 0.3838 | 2.75 | 2.69 | 2.18 |
Figure 9 depicts that an increase in the percentage of jute fibres and bamboo fibres increases the tensile strength of concrete at 14 days and 28 days. However, the influence of both jute and bamboo fibres played a major role in increasing the tensile strength. Moreover, beyond 0.5% of jute fibres and 0.5% of bamboo fibres weight fraction, the split tensile strength of concrete reduces. From figure 10(b), the optimum value of silica fumes, bamboo fibres, and jute fibres to reach the maximum tensile strength at 14 days and 28days were 7.2727%, 0.3838%, and 0.4646%, correspondingly. The validation test was conducted to confirm the results (Table 7), and the error percentage at 14 days and 28 days tensile strength were 2.93% and 2.18%, respectively.
5. Conclusion
- (i)
The addition of jute and bamboo fibre to concrete has moderately enhanced the mechanical properties of concrete. Nevertheless, for a higher level of fibre addition, the tensile strength of concrete is reduced.
- (ii)
Inclusion of bamboo and jute fibre of 0.5% has improved the strength properties of concrete under compression and beyond, whose strength reduces. Moreover, the test results show that bamboo fibre has contributed to compressive strength when compared with tensile strength.
- (iii)
A total of four responses fcs14 ,fcs28, fSTS14 , and fSTS28 were considered in the Box–Behnken design of the RSM examination, and the factors and the level of each response were 3 and 4, respectively.
- (iv)
The analysis of variance results shows that the most contributing factor for 14 days and 28 days compressive strength was bamboo fibres, and similarly for split tensile strength, significant factors were a combination of jute and bamboo fibres.
- (v)
The model established using regression analysis to predict fcs14 ,fcs28,fSTS14 , and fSTS28 shows that forecasted values go hand in hand with the experimental results.
- (vi)
The ANOVA and Pareto chart examination showed that the regression models for fcs14,fcs28, fSTS14 , and fSTS28 are highly significant. The mathematical outputs of the models are of high precision as the p value of the models was less than 0.005.
- (vii)
The outputs of regression analysis, Pareto chart, and surface plot analysis exposed that the most substantial factor for fcs14,fcs28, fSTS14 , and fSTS28 is the linear term jute fibre (X2) and bamboo fibre (X3)
- (viii)
The optimum response design variables for (fcs14, fcs28, fSTS14 , and fSTS28) were attained, which is highly substantial to the design of concrete.
Conflicts of Interest
The authors declare that they have no conflicts of interest.
Open Research
Data Availability
The datasets used in this research are available upon request from the corresponding author.


