Combined Evaluation of mRNA and Protein Expression, Promoter Methylation, and Immune Infiltration of UBE2I in Pan-Digestive System Tumors
Abstract
Background. Digestive system tumors (DSTs) have high morbidity and mortality worldwide. This study explored the potential value of ubiquitin-conjugating enzyme E2 I (UBE2I) in pan-digestive system tumors (pan-DSTs). Methods. Differential expression, tumor stages, and survival outcomes of UBE2I in pan-DSTs were determined using the GEPIA database. The TIMER database was used to confirm the correlation of UBE2I expression with pan-DSTs and immune infiltrates. Differential analyses of UBE2I promoter methylation and protein levels were performed using the UALCAN database. The underlying mechanisms of UBE2I involvement in pan-DSTs were visualized using interaction networks. The diagnostic value of UBE2I in pan-DSTs was identified using the Oncomine database. Results. UBE2I was differentially and highly expressed in cholangiocarcinoma (CHOL), pancreatic adenocarcinoma (PAAD), colon adenocarcinoma (COAD), rectal adenocarcinoma (READ), liver hepatocellular carcinoma (LIHC), and stomach adenocarcinoma (STAD). According to survival analysis, upregulated UBE2I was associated with adverse overall and disease-free survival in PAAD and favorable overall survival in READ. UBE2I expression was partially linked to the purity of immune infiltration in COAD, LIHC, PAAD, READ, and STAD, as indicated by the immune infiltration analysis. Promoter methylation analysis showed differential and high methylation of UBE2I in PAAD as well as stratified analysis by gender, nodal metastasis, and race. Protein expression analysis in colon cancer revealed that UBE2I had differential and high expression in tumors as well as stratified analysis by gender, tumor histology, race, and tumor stage. Mechanism explorations demonstrated that in COAD and PAAD, UBE2I was involved in spliceosomal snRNP complex, Notch signaling pathway, etc. Diagnostic analysis indicated that UBE2I had consistent diagnostic value for COAD and PAAD. Conclusions. Upregulated UBE2I may be a diagnostic and surveillance predictive signature for PAAD and COAD. The potential significance of immune infiltrates and promoter methylation in PAAD and COAD needs further exploration.
1. Introduction
The term digestive system tumor (DST) describes a group of tumors that affect diverse digestive system tissues, involving esophagus, stomach, liver, pancreas, colon, and rectum [1]. The majority of these neoplasms are carcinomas (>90%) [2]. DST remains a leading cause of tumor-related mortality, causing approximately three million deaths worldwide each year [3, 4]. In recent years, the number of DST cases has significantly increased, highlighting the urgent requirement for more effective treatment strategies [5]. Despite significant advances in molecular medicine in disease prevention, diagnosis, and treatment, the prognosis of DSTs remains poor due to their increasing prevalence, diagnosis at advanced stages, tumor recurrence, and drug resistance [6]. Identification of novel molecular targets for DSTs may therefore provide insights into the development of effective therapeutic drugs.
SUMOylation is a reversible protein posttranslational modification process in which small ubiquitin-like modifier (SUMO) proteins are covalently bound to target proteins’ lysine residues [7]. The SUMO system modulates a wide range of cellular processes, including cell division, chromatin segregation, transcription, signal transduction, protein stability, and translocation [7]. Ubiquitin conjugating enzyme E2 I (UBE2I) is a crucial component of this system, augmenting the ubiquitination and proteasomal flux of target proteins [7]. SUMOylation is an important posttranslational modification that fine-tunes almost all cellular functions and pathological processes, playing an important role in human tumorigenesis [8]. The SUMO pathway can induce cell proliferation, antiapoptosis, and metastatic potential by regulating proteins involved in carcinogenesis [9–13].
siRNA-mediated suppression of UBE2I is reported to inhibit LC3-II, an autophagy marker protein, and conversely promote the expression of SQSTM1/p62, which translocates ubiquitinated proteins to the proteasome and the autophagosome precursor—phagophore [7]. Furthermore, increased SUMOylation exerts a cardioprotective effect and decreases morbidity in proteotoxic cardiac disease [7]. UBE2I was significantly downregulated in patients with chromosome 9 open reading frame 72 and neurological progranulin mutations as well as sporadic frontotemporal dementia and age-matched controls [14]. Knockdown of UBE2I, also known as UBC9, impairs Notch 1-activated breast epithelial cell proliferation, indicating the potential value of UBE2I in targeted treatment of Notch-driven breast cancer [15]. In addition, differentially expressed UBE2I was observed in all four (clear cell, endometrioid, mucinous, and serous) subtypes of epithelial ovarian cancer [16]. Another study by Poleshko et al. [17] demonstrated that enzymes of the SUMO pathway are critical for the maintenance of epigenetic silencing. Furthermore, UBE2I upregulation was reported to be linked to disease development in a mouse model of necrotizing enterocolitis [18]. However, limited knowledge is available regarding the expression patterns and functions of UBE2I in digestive disorders, in particular, DSTs. Accordingly, the motivation and novelty of the study is to investigate the potential roles played by UBE2I and its underlying mechanism in pan-DSTs.
2. Materials and Methods
2.1. UBE2I Expression Patterns in Different Types of Cancers and Normal Tissue Specimens
UBE2I mRNA levels in pan-cancerous and normal tissue specimens from the UALCAN database (http://ualcan.path.uab.edu/) [19], a comprehensive, user-friendly, and interactive web resource for cancer omics data analyses, were examined. Then, the Gene Expression Profiling Interactive Analysis (GEPIA; URL: http://gepia2.cancer-pku.cn/#index) [20], a newly developed server for RNA sequencing expression data analyses of 9736 carcinoma tissues and 8587 normal counterparts from the TCGA and GTEx projects, was utilized to determine differential expression patterns of UBE2I in pan-DSTs using standard processing pipelines. Correlations of UBE2I expression patterns with tumor stages in pan-DSTs from the GEPIA database were further explored.
2.2. Survival and Immune Infiltrate Analyses in Pan-DSTs
Survival analyses, including overall survival (OS) and disease-free survival (DFS), of pan-DSTs from the GEPIA database were conducted. UBE2I expression in pan-DST samples was subdivided into either low or high group based on the median value. Next, we analyzed immune infiltrates in pan-DSTs in terms of gene expression, survival outcomes, and somatic copy number alterations (SCNAs) using the Tumor Immune Estimation Resource (TIMER; URL: https://cistrome.shinyapps.io/timer/) database [21, 22]. Specifically, the gene module mainly focused on the correlation of UBE2I expression with the abundance of immune infiltrates (B, CD4+ T, and CD8+ T cells, as well as neutrophils (NP), macrophages (MP) and dendritic cells (DC)), the survival module primarily discussed the correlation of survival outcomes with UBE2I expression and immune infiltrate abundance, and the SCNA module mainly investigated the correlation of somatic CNA with immune infiltrate abundance.
2.3. Promoter Methylation and Protein Expression Analyses in Pan-DSTs
Differential promoter methylation of UBE2I was evaluated by types as well as stratified analyses additionally conducted by gender, race and nodal metastasis in pan-DSTs. Subsequently, protein levels of UBE2I were analyzed by types and stratification of colon cancer by gender, race, tumor stage, and tumor histology (information on other pan-DSTs was not available from the database).
2.4. Interaction Networks Involving UBE2I in Pan-DSTs
The potential mechanisms underlying the prognostic significance of UBE2I in pan-DSTs were further explored. Related genes coexpressed with UBE2I in these tumors were identified from the cBioPortal database (URL: https://www.cbioportal.org/), and the top 100 were used for interaction network construction [23, 24]. Interaction networks of pathways (bioprocesses, cellular composition, molecular functions, immune processes, KEGG pathways, reactome pathways, and diseases, etc.) were generated with ClueGO plugin of Cytoscape software v3.7.2 [25, 26]. Gene-gene interaction (GGI) as well as protein-protein interaction (PPI) networks were constructed to explore potential interactions at gene and protein levels using geneMANIA (URL: http://genemania.org/) [27] and STRING (URL: https://string-db.org/) [28] databases, respectively.
2.5. Diagnostic Significance of UBE21 in Survival of DSTs
The diagnostic significance of UBE2I was determined based on the expression of UBE2I in pan-DSTs obtained from the Oncomine database (URL: https://www.oncomine.org/resource/main.html). Specifically, diagnostic significance was evaluated via receiver operating characteristic (ROC) curves constructed using both tumor and nontumor data. The criteria for the identification of potential diagnostic biomarkers were as follows: (1) those showing differential expression in tumor and nontumors and (2) those with an area under curve (AUC) ≥ 0.700 and a P ≤ 0.050. The Cancer Genome Atlas (TCGA) datasets, including COAD and PAAD, Alon colon cancer [29], and Logsdon pancreas [30] datasets, were used for evaluating the diagnostic value of UBE2I.
2.6. Statistical Analysis
One-way ANOVA was applied for gene expression analysis of UBE2I in different tumor stages. Analyses of differential expression patterns of UBE2I between carcinoma specimens and normal counterparts, as well as promoter methylation between groups, including differences between tumor and normal, male and female, different races, node metastasis and tumor grade categories, were performed via the Mann–Whitney U test. Survival analysis and the correlation of UBE2I expression with immune infiltrates were made via the log-rank test and the Spearman’s correlation coefficients, respectively. The Cox proportional hazard ratio (HR) with a 95% confidence interval (95% CI) was calculated from the survival plots. P ≤ 0.05 indicated the presence of statistical significance.
3. Results
3.1. Differential UBE2I mRNA Expression in Pan-DSTs
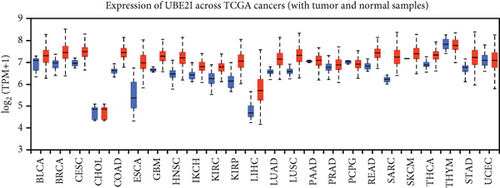
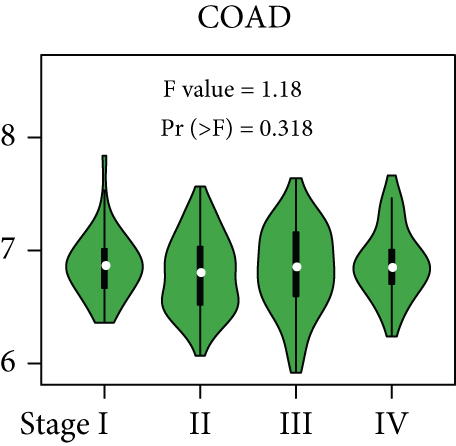
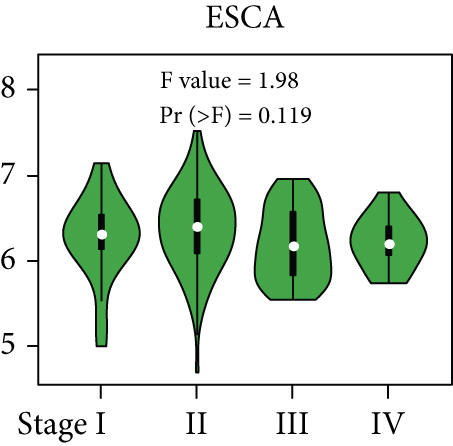
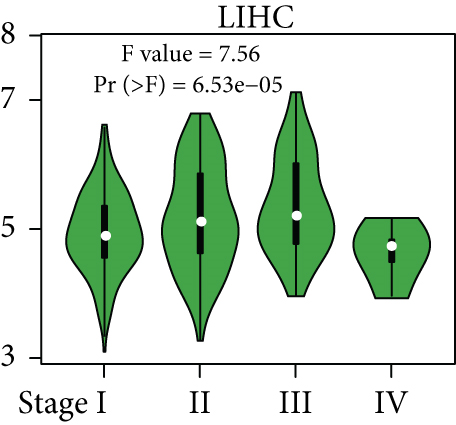
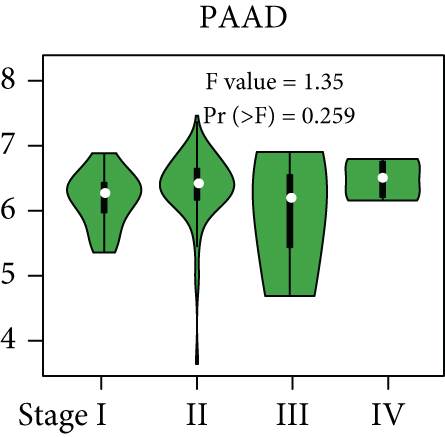
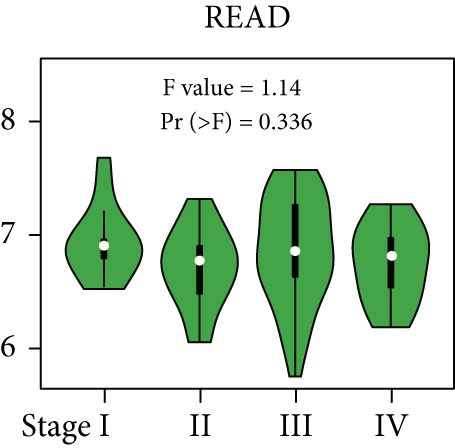
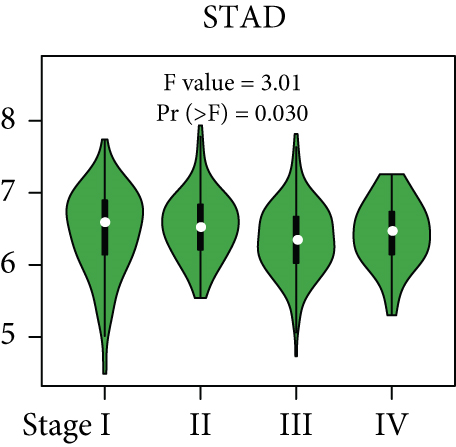
From the TCGA database, we obtained data of 7 different types of digestive system cancers, namely, cholangiocarcinoma (CHOL), colon adenocarcinoma (COAD), esophageal carcinoma (ESCA), liver hepatocellular carcinoma (LIHC), pancreatic adenocarcinoma (PAAD), rectal adenocarcinoma (READ), and stomach adenocarcinoma (STAD). Evaluation of UBE2I mRNA expression across TCGA cancers revealed upregulated UBE2I in carcinomas, versus normal counterparts, in most cases (Figure 1(a)). Except ESCA, differentially expressed UBE2I was observed across all other pan-DST types (all P ≤ 0.05, Figure 1(b)). Evaluation of expression by pan-DST staging showed that UBE2I was differentially expressed in the diver stage in LIHC and STAD (P < 0.0001, 0.030; Figures 1(f) and 1(i)) but not in other DST types (all P > 0.05, Figures 1(c)–1(e), 1(g), and 1(h)). Specifically, UBE2I expression was increased in stages I-III while decreased in stage IV in LIHC; however, the converse expression pattern was observed in STAD.


3.2. Survival Analysis of UBE2I in Pan-DSTs
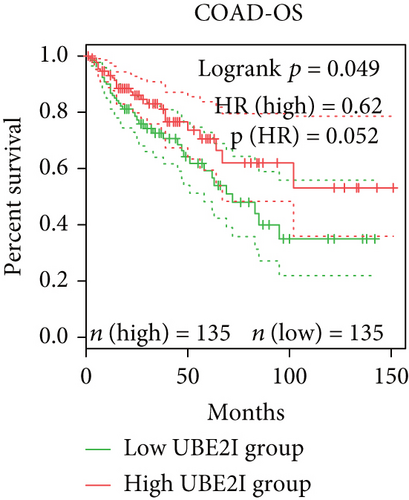
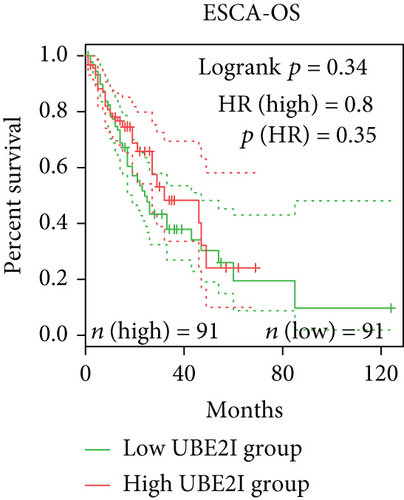
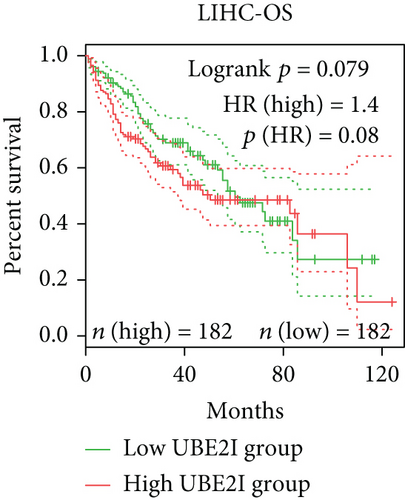
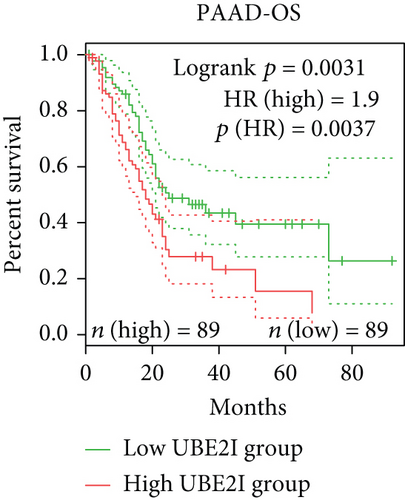
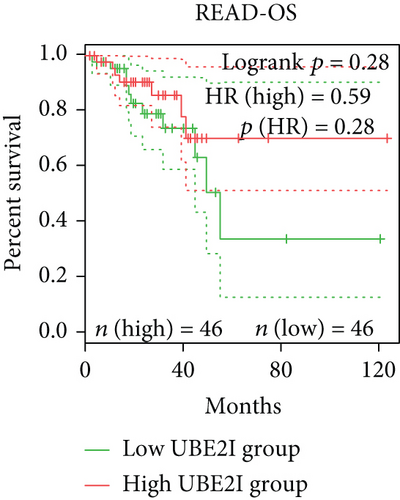
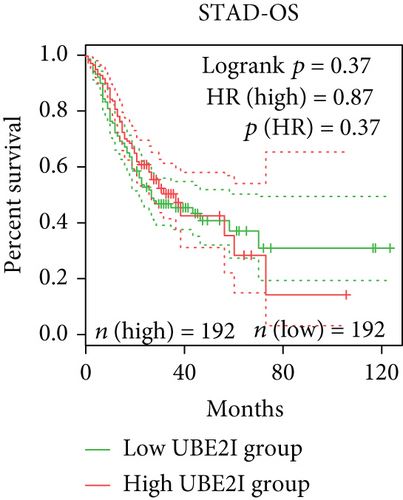
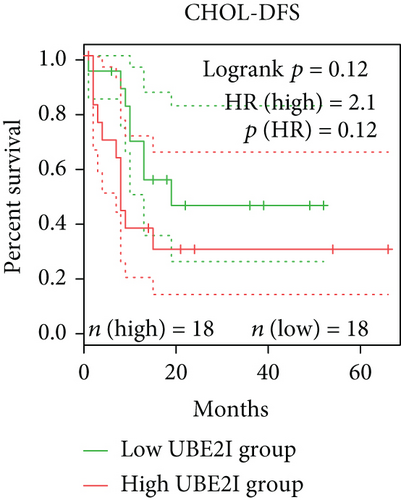
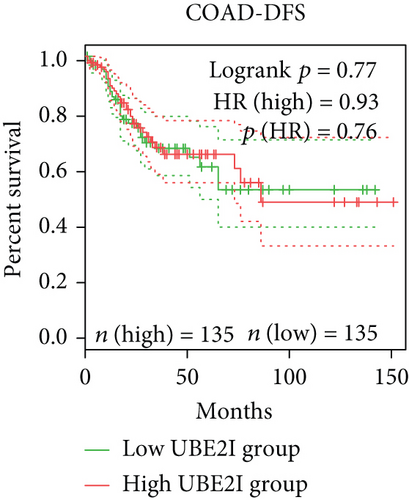
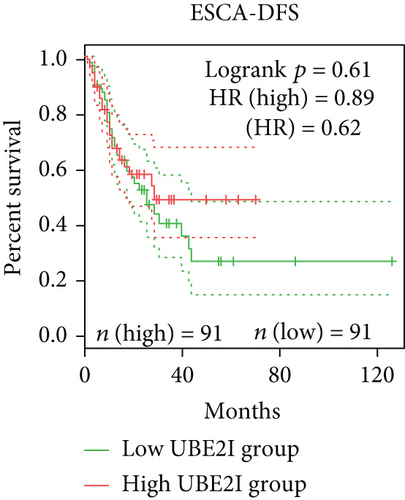
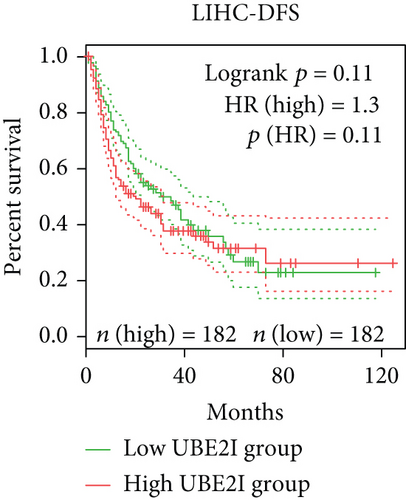
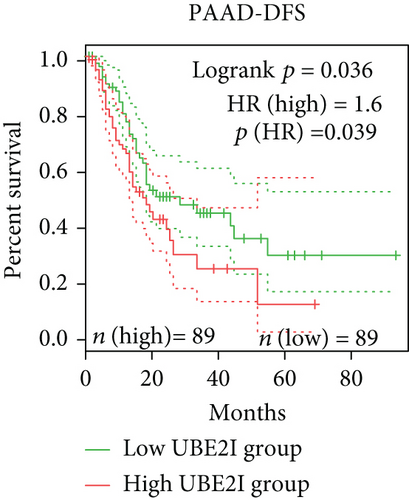
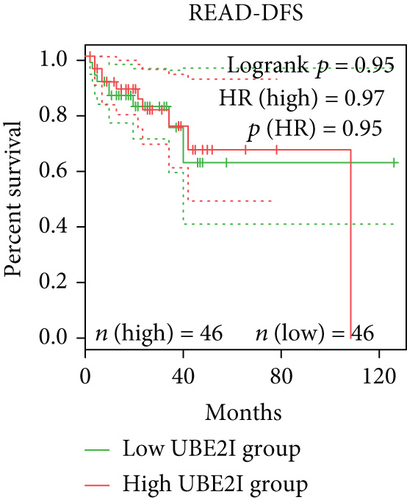
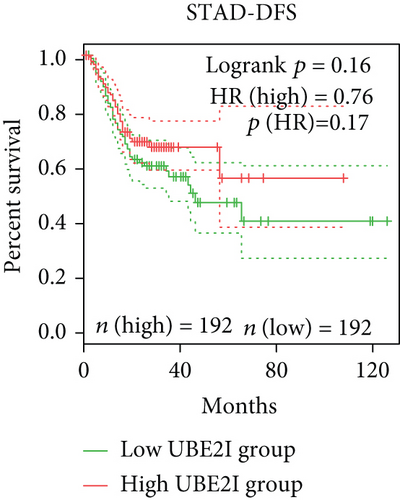
Survival analyses, including OS and DFS, were carried out to determine the role of UBE2I expression in the prognosis of pan-DSTs. We observed favorable prognostic significance of UBE2I for OS in COAD and PAAD (log-rank [11] P = 0.049, HR (high) = 0.620; LR P = 0.003, HR (high) = 1.900; Figures 2(b) and 2(e)) but not in other DSTs examined (all LP P > 0.050; Figures 2(a), 2(c), 2(d), 2(f), and 2(g)). In terms of DFS, UBE2I showed favorable prognostic significance in PAAD only (LP P = 0.036, HR (high) = 1.600; Figure 2(l)). It suggests that upregulated UBE2I is beneficial for COAD but not for PAAD in terms of both OS and DFS.

3.3. Immune Infiltrate Analysis of UBE21 in Pan-DSTs
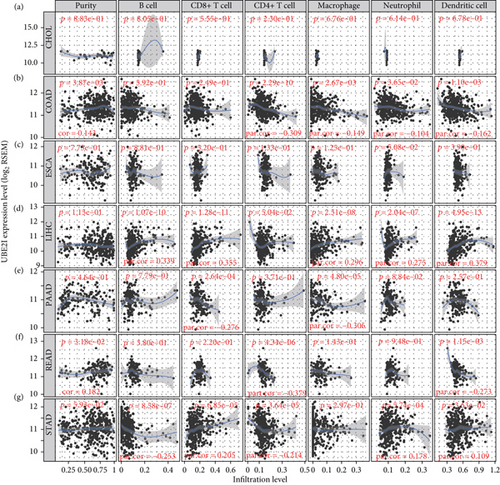
Spearman’s correlation coefficients were used to evaluate the correlation of UBE2I expression with immune infiltrates in a range of pan-DSTs. The data showed no connection between UBE2I expression and purity or immune infiltrates (B cells, CD4+, and CD8+ T cells, as well as NP, MP, and DC) in CHOL and ESCA (all P > 0.050, Figures 3(a) and 3(c)). In COAD, UBE2I was positively associated with purity but negatively with CD4+ T cells, MP, NP, and DC (all P < 0.050, R = 0.143, -0.309, -0.149, -0.104, and -0.162; Figure 3(b)). In LIHC, a positive association between UBE2I and B cells, CD8+ T cells, MP, NP, and DC was determined (all P < 0.050, R = 0.339, 0.355, 0.296, 0.275, and 0.379; Figure 3(d)). In PAAD, an inverse connection was found between UBE2I and CD8+ T cells and MP (both P < 0.050, R = −0.276 and -0.306; Figure 3(e)). In READ, UBE2I was positively linked to purity but negatively to CD4+ T and DC (all P < 0.050, R = 0.182, -0.37, and -0.273; Figure 3(f)). And in STAD, UBE2I was found to be positively correlated with CD8+ T cells, NP, and DC but had an inverse association with B and CD4+ T cells (all P < 0.050, R = 0.205, 0.178, 0.109, -0.253, and -0.214; Figure 3(g)).
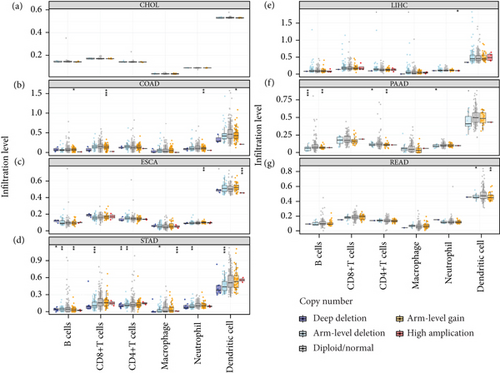
The potential connection between SCNAs of UBE21 and immune infiltrates was further examined. Notably, no significant associations were observed between UBE21 and all the six types of immune infiltrates (B cells, CD4+ T cells, CD8+ T cells, NP, MP, and DC) in CHOL (Figure 4(a)). In contrast, SCNAs of UBE2I (deep deletion, arm-level deletion and arm-level gain) were strongly linked to all the above six immune infiltrate types in STAD (Figure 4(g)). While in LIHC, SCNAs of UBE2I were significant only in relation to neutrophil amplification (Figure 4(d)). In READ, SCNAs of UBE2I (arm-level deletion and gain) showed statistical significance in relation to DC (Figure 4(f)). In COAD, SCNAs of UBE2I were strongly related to B cells, CD8+ T cells, NP, and DC in terms of arm-level gain (Figure 4(b)). In PAAD, a close connection between the arm-level deletion and gain of UBE2I and B cells, CD8+ T cells, and NP was determined (Figure 4(e)). In ESCA, arm-level gain of UBE2I showed a significant correlation with the high amplification of NP and DC (Figure 4(c)).
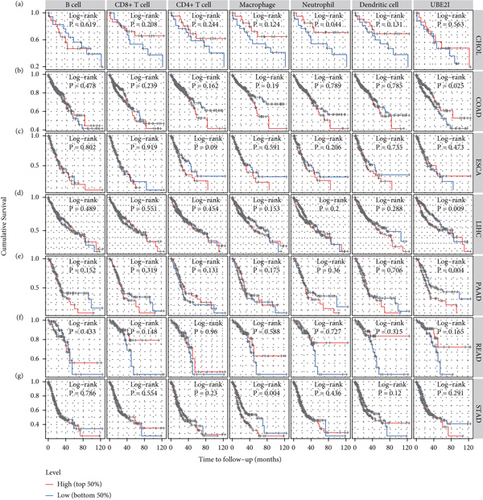
Next, prognostic analysis was performed based on immune infiltrates and UBE2I expression in pan-DSTs. The results showed that neutrophil infiltration was significantly correlated with CHOL while macrophage infiltration was correlated with STAD (log-rank P = 0.044, 0.004; Figures 5(a) and 5(g)). UBE2I expression showed favorable prognostic value in COAD, LIHC, and PAAD (log-rank P = 0.025, 0.009, and 0.004; Figures 5(b), 5(d), and 5(e)), but not in other cancer types.
3.4. Promoter Methylation Analysis of UBE2I in Pan-DSTs
Promoter methylation analysis was initially applied to validate differential expression of UBE2I in tumor and normal samples. Differential methylation of UBE2I was observed in PAAD, with high methylation in tumor and low methylation in normal cells (P = 0.003; Figure 6(e)), but not in other DSTs (all P > 0.050; Figures 6(a)–6(d), 6(f), and 6(g)). Furthermore, upon stratification by gender, differential methylation of UBE2I was consistently observed in the PAAD subtype, with high methylation levels in both male and female populations, compared to their control counterparts (P = 0.007, 0.005; Figure 6(e)). Stratified analysis by nodal metastasis showed differential methylation of UBE2I in ESCA, PAAD, and STAD. Consistently, differential levels of methylated UBE2I were detected in nodal metastasis groups of ESCA and STAD, with high methylation at N0 and low methylation at N3 (P = 0.047, 0.029; Figures 6(c) and 6(g)). In PAAD, high methylated UBE2I levels were observed at both N0 and N1 stages, compared to normal samples (both P = 0.005; Figure 6(e)). Upon stratification by race, differential methylation of UBE2I was detected in COAD, ESCA, LIHC, and PAAD subtypes. Specifically, UBE2I methylation levels in COAD and ESCA were significantly higher in Asians and Caucasians than in African-Americans (P = 0.014, 0.036; 0.004, 0.046; Figures 6(b) and 6(c)). Higher methylation in Caucasians and lower methylation in Asians with LIHC were detected, compared to the corresponding control groups (P = 0.030, 0.003), with significant differences between the two races (P = 1.257∗E − 9; Figure 6(d)). The Caucasian subgroup of PAAD displayed high UBE2I methylation, compared to the corresponding control group (P = 0.004; Figure 6(e)).


3.5. Protein Expression Analysis of UBE2I in Colon Cancer
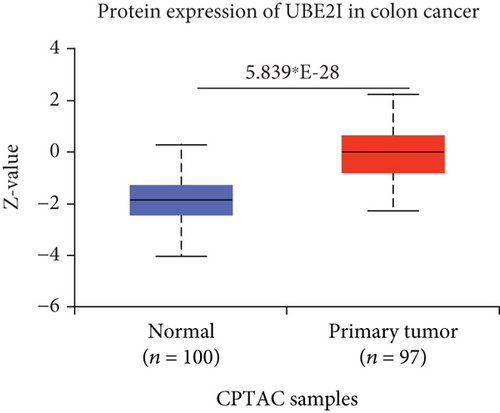
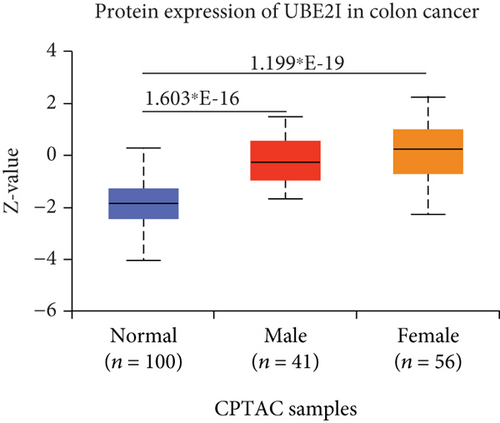
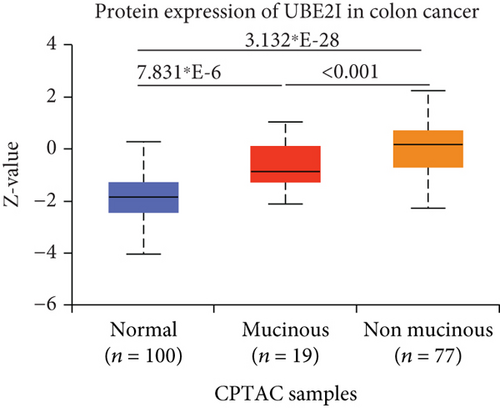
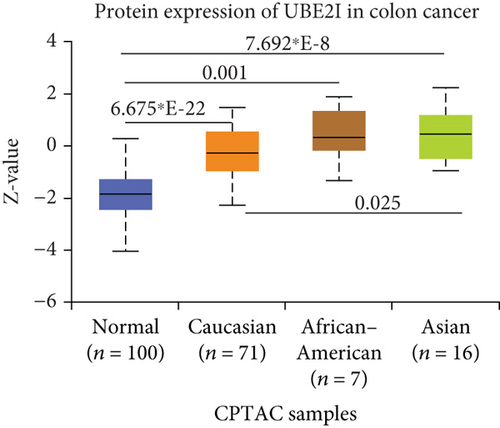
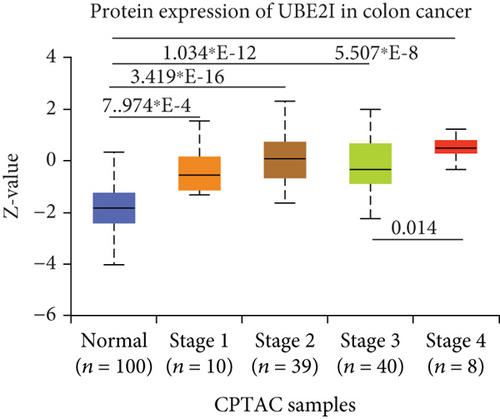
UBE2I was highly expressed in primary colon tumors, versus normal counterparts (P = 5.839∗E − 28, Figure 7(a)). Stratified analyses by gender, tumor histology, race, and tumor staging consistently disclosed higher expression in tumor versus normal tissue. Both sexes in the tumor groups displayed higher UBE21 expression than their control counterparts (P = 1.603∗E − 16, 1.199∗E − 19; Figure 7(b)). High expression was detected in both mucinous and nonmucinous types, compared to normal tissue (P = 7.831∗E − 6, 3.132∗E − 28; Figure 7(c)), which was more marked in nonmucinous than mucinous tumors (P < 0.001). We also detected high expression in Caucasian, Franco-American, and Asian populations with colon cancer, compared to their control counterparts (P = 6.675∗E − 22, 0.001, 7.692∗E − 8; Figure 7(d)), with even higher expression in Asians versus Caucasians (P = 0.025). UBE21 was upregulated in tumor stages I-IV (P = 7.974∗E − 4, 3.419∗E − 16, 1.034∗E − 12, and 5.507∗E − 8; Figure 7(e)), with higher expression in stage IV, compared to stage III carcinoma (P = 0.014).
3.6. Interaction Networks of Potential Pathways Involving UBE2I in COAD and PAAD
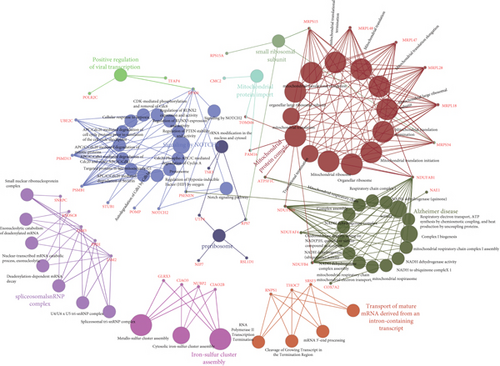
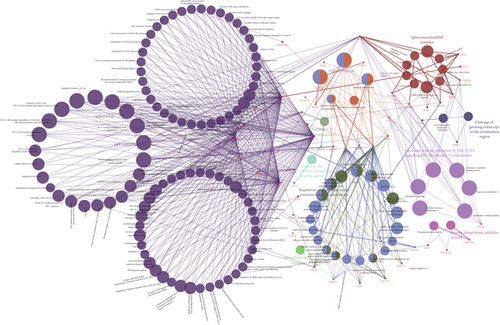
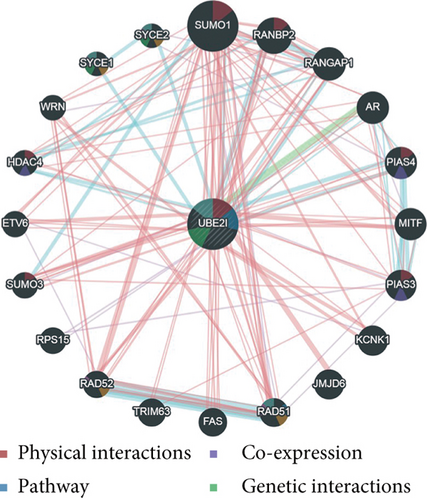
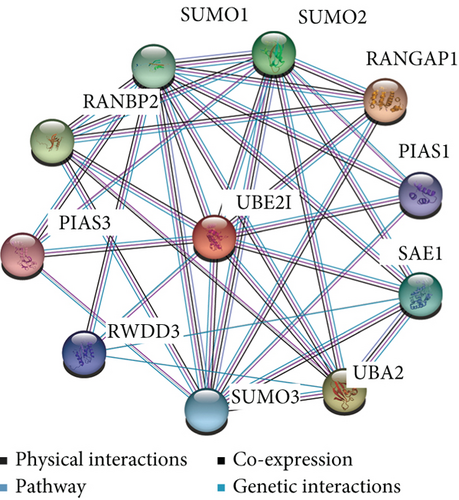
UBE2I coexpressed genes in the cBioPortal database were first identified for analysis. The top 100 genes related to UBE2I in COAD and PAAD are presented in Tables 1 and 2, respectively, based on which the interaction networks involving UBE2I in COAD were constructed (Figure 8). Associated genes were found to be involved in preribosome, transport of mature mRNAs derived from intron-containing transcripts, spliceosomal snRNP complexes, Notch signaling, mitochondrial protein complexes, small ribosomal subunits, and Alzheimer’s disease. The interaction network of UBE2I in PAAD included genes involved in ruffle membrane, regulation of cellular senescence, spliceosomal snRNP complex, gene, and protein expression by JAK-STAT axis after interleukin-12 stimulation, protein phosphatase inhibitor activity, and HIV infection (Figure 9). Finally, GGI and PPI networks were constructed to visualize these relationships. GGI analysis showed physical, coexpression, pathway, and genetic interactions of UBE21 with SUMO1, SUMO3, RANBP2, SYCE2, SYCE1, PIAS3, PIAS4, RAD51, and RAD52 (Figure 10(a)). In PPI analysis, physical, coexpression, pathway, and genetic interactions of UBE21 with SUMO1-3, SAE1, PIAS1, PIAS3, UBA2, and RWDD3 were detected (Figure 10(b)).
| Correlated gene | Cytoband | Spearman’s correlation | P value | q value |
|---|---|---|---|---|
| RNPS1 | 16p13.3 | 0.652 | 4.92E − 73 | 9.85E − 69 |
| NDUFAB1 | 16p12.2 | 0.639 | 2.76E − 69 | 2.77E − 65 |
| JPT2 | 16p13.3 | 0.626 | 7.87E − 66 | 5.25E − 62 |
| PAM16 | 16p13.3 | 0.552 | 1.81E − 48 | 9.05E − 45 |
| C16ORF91 | 16p13.3 | 0.542 | 1.40E − 46 | 5.59E − 43 |
| NIP7 | 16q22.1 | 0.531 | 2.23E − 44 | 7.45E − 41 |
| FOPNL | 16p13.11 | 0.518 | 5.71E − 42 | 1.63E − 38 |
| HSBP1 | 16q23.3 | 0.516 | 1.35E − 41 | 3.37E − 38 |
| DNAJA2 | 16q11.2 | 0.516 | 1.52E − 41 | 3.39E − 38 |
| KCTD5 | 16p13.3 | 0.512 | 6.05E − 41 | 1.21E − 37 |
| PMM2 | 16p13.2 | 0.509 | 2.88E − 40 | 4.81E − 37 |
| LYRM1 | 16p12.3 | 0.509 | 2.88E − 40 | 4.81E − 37 |
| DNAJA3 | 16p13.3 | 0.507 | 6.38E − 40 | 9.82E − 37 |
| CFAP20 | 16q21 | 0.506 | 7.81E − 40 | 1.12E − 36 |
| KARS | 16q23.1 | 0.5 | 1.07E − 38 | 1.43E − 35 |
| RSL1D1 | 16p13.13 | 0.498 | 1.95E − 38 | 2.44E − 35 |
| NDUFB4 | 3q13.33 | 0.496 | 4.52E − 38 | 5.32E − 35 |
| GINS2 | 16q24.1 | 0.495 | 5.90E − 38 | 6.57E − 35 |
| NUTF2 | 16q22.1 | 0.493 | 1.58E − 37 | 1.67E − 34 |
| MRPS34 | 16p13.3 | 0.491 | 3.54E − 37 | 3.54E − 34 |
| NUBP2 | 16p13.3 | 0.488 | 1.07E − 36 | 1.02E − 33 |
| POMP | 13q12.3 | 0.487 | 1.52E − 36 | 1.39E − 33 |
| TOMM6 | 6p21.1 | 0.484 | 5.17E − 36 | 4.50E − 33 |
| SNRPC | 6p21.31 | 0.483 | 6.16E − 36 | 5.14E − 33 |
| PSMB1 | 6q27 | 0.48 | 1.68E − 35 | 1.35E − 32 |
| EEF2KMT | 16p13.3 | 0.475 | 1.24E − 34 | 9.55E − 32 |
| EXOSC8 | 13q13.3 | 0.473 | 2.57E − 34 | 1.91E − 31 |
| NAE1 | 16q22.1 | 0.471 | 4.38E − 34 | 3.13E − 31 |
| EP300 | 22q13.2 | -0.47 | 7.31E − 34 | 5.05E − 31 |
| HEBP2 | 6q24.1 | 0.467 | 2.00E − 33 | 1.33E − 30 |
| METTL9 | 16p12.2 | 0.467 | 2.09E − 33 | 1.33E − 30 |
| CMC2 | 16q23.2 | 0.467 | 2.13E − 33 | 1.33E − 30 |
| MSRB1 | 16p13.3 | 0.465 | 4.67E − 33 | 2.83E − 30 |
| CENPN | 16q23.2 | 0.465 | 5.04E − 33 | 2.97E − 30 |
| METTL26 | 16p13.3 | 0.464 | 5.65E − 33 | 3.23E − 30 |
| CLIC1 | 6p21.33 | 0.463 | 9.56E − 33 | 5.32E − 30 |
| MRPL18 | 6q25.3 | 0.462 | 1.03E − 32 | 5.59E − 30 |
| RPS15A | 16p12.3 | 0.459 | 4.01E − 32 | 2.11E − 29 |
| EMC8 | 16q24.1 | 0.457 | 8.05E − 32 | 4.13E − 29 |
| HERC1 | 15q22.31 | -0.454 | 1.65E − 31 | 8.28E − 29 |
| NDUFB10 | 16p13.3 | 0.454 | 2.01E − 31 | 9.84E − 29 |
| THOC7 | 3p14.1 | 0.454 | 2.13E − 31 | 1.02E − 28 |
| CIAO2B | 16q22.1 | 0.452 | 3.81E − 31 | 1.77E − 28 |
| CYB5B | 16q22.1 | 0.451 | 4.67E − 31 | 2.12E − 28 |
| TSR3 | 16p13.3 | 0.451 | 5.35E − 31 | 2.38E − 28 |
| NOTCH2 | 1p12 | -0.45 | 6.77E − 31 | 2.95E − 28 |
| FAM192A | 16q13 | 0.45 | 7.97E − 31 | 3.39E − 28 |
| MTMR3 | 22q12.2 | -0.45 | 8.43E − 31 | 3.52E − 28 |
| PSMD13 | 11p15.5 | 0.449 | 8.87E − 31 | 3.62E − 28 |
| NBPF10 | 1q21.1 | -0.449 | 1.12E − 30 | 4.47E − 28 |
| UCHL3 | 13q22.2 | 0.449 | 1.17E − 30 | 4.61E − 28 |
| POLR2C | 16q21 | 0.448 | 1.70E − 30 | 6.56E − 28 |
| TMEM208 | 16q22.1 | 0.447 | 2.03E − 30 | 7.66E − 28 |
| MRPS15 | 1p34.3 | 0.446 | 2.62E − 30 | 9.72E − 28 |
| HMGB1 | 13q12.3 | 0.446 | 3.08E − 30 | 1.12E − 27 |
| DIP2A | 21q22.3 | -0.444 | 5.29E − 30 | 1.89E − 27 |
| ZSWIM8 | 10q22.2 | -0.444 | 6.15E − 30 | 2.16E − 27 |
| NDUFAF4 | 6q16.1 | 0.443 | 7.55E − 30 | 2.61E − 27 |
| ARPC4 | 3p25.3 | 0.442 | 9.40E − 30 | 3.19E − 27 |
| PI4KA | 22q11.21 | -0.442 | 1.02E − 29 | 3.39E − 27 |
| MRPL47 | 3q26.33 | 0.442 | 1.12E − 29 | 3.69E − 27 |
| ZNF263 | 16p13.3 | 0.441 | 1.67E − 29 | 5.40E − 27 |
| STUB1 | 16p13.3 | 0.44 | 1.81E − 29 | 5.75E − 27 |
| RPUSD1 | 16p13.3 | 0.44 | 2.17E − 29 | 6.69E − 27 |
| FAM168A | 11q13.4 | -0.44 | 2.17E − 29 | 6.69E − 27 |
| UBE2C | 20q13.12 | 0.439 | 2.65E − 29 | 8.04E − 27 |
| ZFYVE1 | 14q24.2 | -0.438 | 3.28E − 29 | 9.80E − 27 |
| SRSF3 | 6p21.31-p21.2 | 0.438 | 3.62E − 29 | 1.07E − 26 |
| PRDX1 | 1p34.1 | 0.437 | 4.54E − 29 | 1.32E − 26 |
| PSENEN | 19q13.12 | 0.436 | 6.31E − 29 | 1.80E − 26 |
| BCL7C | 16p11.2 | 0.436 | 7.23E − 29 | 2.04E − 26 |
| TMEM186 | 16p13.2 | 0.434 | 1.56E − 28 | 4.35E − 26 |
| UTP4 | 16q22.1 | 0.434 | 1.61E − 28 | 4.42E − 26 |
| PPIH | 1p34.2 | 0.433 | 1.84E − 28 | 4.97E − 26 |
| BFAR | 16p13.12 | 0.432 | 2.31E − 28 | 6.17E − 26 |
| LSM2 | 6p21.33 | 0.431 | 3.36E − 28 | 8.86E − 26 |
| GLRX3 | 10q26.3 | 0.431 | 3.72E − 28 | 9.67E − 26 |
| BANF1 | 11q13.1 | 0.429 | 5.85E − 28 | 1.50E − 25 |
| BCL2L2 | 14q11.2 | -0.429 | 6.01E − 28 | 1.52E − 25 |
| COX7A2 | 6q14.1 | 0.429 | 6.73E − 28 | 1.68E − 25 |
| MRPL28 | 16p13.3 | 0.429 | 7.08E − 28 | 1.75E − 25 |
| DCTPP1 | 16p11.2 | 0.429 | 7.54E − 28 | 1.84E − 25 |
| PTMA | 2q37.1 | 0.427 | 1.44E − 27 | 3.48E − 25 |
| ATP5F1C | 10p14 | 0.426 | 1.58E − 27 | 3.78E − 25 |
| DYNC1H1 | 14q32.31 | -0.425 | 2.13E − 27 | 5.02E − 25 |
| RPS7 | 2p25.3 | 0.425 | 2.24E − 27 | 5.21E − 25 |
| MCRIP2 | 16p13.3 | 0.424 | 3.50E − 27 | 8.07E − 25 |
| ZNF236 | 18q23 | -0.423 | 3.76E − 27 | 8.56E − 25 |
| TFAP4 | 16p13.3 | 0.422 | 5.43E − 27 | 1.22E − 24 |
| AKAP13 | 15q25.3 | -0.422 | 5.96E − 27 | 1.33E − 24 |
| ZFYVE26 | 14q24.1 | -0.421 | 7.79E − 27 | 1.71E − 24 |
| GOT2 | 16q21 | 0.421 | 8.77E − 27 | 1.91E − 24 |
| COPS9 | 2q37.3 | 0.42 | 1.19E − 26 | 2.57E − 24 |
| TECPR2 | 14q32.31 | -0.419 | 1.41E − 26 | 3.00E − 24 |
| HECTD4 | 12q24.13 | -0.419 | 1.67E − 26 | 3.52E − 24 |
| CIAO3 | 16p13.3 | 0.418 | 1.69E − 26 | 3.52E − 24 |
| FYCO1 | 3p21.31 | -0.418 | 1.76E − 26 | 3.63E − 24 |
| MRPL48 | 11q13.4 | 0.418 | 1.97E − 26 | 4.02E − 24 |
| LSM3 | 3p25.1 | 0.417 | 2.53E − 26 | 5.12E − 24 |
| ANKRD52 | 12q13.3 | -0.417 | 2.58E − 26 | 5.16E − 24 |
| Correlated gene | Cytoband | Spearman’s correlation | P value | q value |
|---|---|---|---|---|
| TMSB10 | 2p11.2 | 0.75 | 3.44E − 33 | 6.87E − 29 |
| PTMA | 2q37.1 | 0.678 | 3.91E − 25 | 2.75E − 21 |
| EIF6 | 20q11.22 | 0.677 | 4.13E − 25 | 2.75E − 21 |
| PPIA | 7p13 | 0.673 | 1.13E − 24 | 5.10E − 21 |
| MFSD2B | 2p23.3 | 0.672 | 1.28E − 24 | 5.10E − 21 |
| PFDN2 | 1q23.3 | 0.671 | 1.53E − 24 | 5.10E − 21 |
| SNRPA1 | 15q26.3 | 0.671 | 1.82E − 24 | 5.20E − 21 |
| PPP4C | 16p11.2 | 0.664 | 6.75E − 24 | 1.69E − 20 |
| NUTF2 | 16q22.1 | 0.66 | 1.71E − 23 | 3.80E − 20 |
| CFL1 | 11q13.1 | 0.657 | 3.06E − 23 | 6.12E − 20 |
| RNF181 | 2p11.2 | 0.653 | 7.23E − 23 | 1.31E − 19 |
| PPIH | 1p34.2 | 0.652 | 9.20E − 23 | 1.53E − 19 |
| RNPS1 | 16p13.3 | 0.649 | 1.61E − 22 | 2.48E − 19 |
| PSMD13 | 11p15.5 | 0.638 | 1.20E − 21 | 1.71E − 18 |
| S100A16 | 1q21.3 | 0.638 | 1.35E − 21 | 1.80E − 18 |
| BANF1 | 11q13.1 | 0.634 | 2.74E − 21 | 3.43E − 18 |
| KANK1 | 9p24.3 | -0.633 | 3.12E − 21 | 3.67E − 18 |
| CLASP2 | 3p22.3 | -0.632 | 3.82E − 21 | 4.02E − 18 |
| NOP10 | 15q14 | 0.632 | 3.82E − 21 | 4.02E − 18 |
| S100A11 | 1q21.3 | 0.629 | 6.69E − 21 | 6.68E − 18 |
| CKS1B | 1q21.3 | 0.626 | 1.19E − 20 | 1.13E − 17 |
| HMGA1 | 6p21.31 | 0.626 | 1.24E − 20 | 1.13E − 17 |
| BOLA2 | 16p11.2 | 0.62 | 3.42E − 20 | 2.97E − 17 |
| NUDT1 | 7p22.3 | 0.619 | 4.09E − 20 | 3.41E − 17 |
| PPP1R14B | 11q13.1 | 0.618 | 4.66E − 20 | 3.73E − 17 |
| MRGBP | 20q13.33 | 0.618 | 5.15E − 20 | 3.96E − 17 |
| SNRPG | 2p13.3 | 0.617 | 5.81E − 20 | 4.30E − 17 |
| MBLAC2 | 5q14.3 | -0.617 | 6.18E − 20 | 4.41E − 17 |
| RALY | 20q11.22 | 0.617 | 6.40E − 20 | 4.41E − 17 |
| KCTD5 | 16p13.3 | 0.616 | 6.81E − 20 | 4.54E − 17 |
| NCOA1 | 2p23.3 | -0.611 | 1.57E − 19 | 9.87E − 17 |
| S100A10 | 1q21.3 | 0.611 | 1.58E − 19 | 9.87E − 17 |
| UBE2C | 20q13.12 | 0.61 | 1.87E − 19 | 1.13E − 16 |
| ZNF420 | 19q13.12 | -0.61 | 2.01E − 19 | 1.18E − 16 |
| ICA1L | 2q33.2 | -0.61 | 2.12E − 19 | 1.21E − 16 |
| FNDC3A | 13q14.2 | -0.609 | 2.44E − 19 | 1.36E − 16 |
| ELOB | 16p13.3 | 0.608 | 3.02E − 19 | 1.63E − 16 |
| CHMP4B | 20q11.22 | 0.606 | 3.92E − 19 | 2.06E − 16 |
| METTL7A | 12q13.12 | -0.605 | 4.38E − 19 | 2.25E − 16 |
| C16ORF91 | 16p13.3 | 0.605 | 4.53E − 19 | 2.26E − 16 |
| CPEB4 | 5q35.2 | -0.604 | 5.29E − 19 | 2.58E − 16 |
| STX4 | 16p11.2 | 0.604 | 5.56E − 19 | 2.65E − 16 |
| TMEM189 | 20q13.13 | 0.602 | 7.50E − 19 | 3.48E − 16 |
| SYNJ1 | 21q22.11 | -0.602 | 8.40E − 19 | 3.82E − 16 |
| CKS2 | 9q22.2 | 0.599 | 1.33E − 18 | 5.87E − 16 |
| CIB1 | 15q26.1 | 0.599 | 1.35E − 18 | 5.87E − 16 |
| ZNF471 | 19q13.43 | -0.597 | 1.70E − 18 | 7.21E − 16 |
| FAM122A | 9q21.11 | -0.597 | 1.91E − 18 | 7.95E − 16 |
| AMIGO1 | 1p13.3 | -0.596 | 2.13E − 18 | 8.69E − 16 |
| PTTG1 | 5q33.3 | 0.595 | 2.32E − 18 | 9.28E − 16 |
| ZNF37A | 10p11.1 | -0.595 | 2.58E − 18 | 9.93E − 16 |
| SMARCA2 | 9p24.3 | -0.595 | 2.58E − 18 | 9.93E − 16 |
| PSMA7 | 20q13.33 | 0.594 | 2.83E − 18 | 1.07E − 15 |
| THOC6 | 16p13.3 | 0.593 | 3.49E − 18 | 1.29E − 15 |
| TNFRSF12A | 16p13.3 | 0.592 | 3.73E − 18 | 1.34E − 15 |
| RNF7 | 3q23 | 0.592 | 3.74E − 18 | 1.34E − 15 |
| RNF180 | 5q12.3 | -0.591 | 4.38E − 18 | 1.54E − 15 |
| WASF3 | 13q12.13 | -0.59 | 5.81E − 18 | 1.98E − 15 |
| SCNM1 | 1q21.3 | 0.59 | 5.84E − 18 | 1.98E − 15 |
| PSMD4 | 1q21.3 | 0.589 | 6.07E − 18 | 2.02E − 15 |
| PSMA1 | 11p15.2 | 0.589 | 6.15E − 18 | 2.02E − 15 |
| BCL2L12 | 19q13.33 | 0.588 | 7.19E − 18 | 2.32E − 15 |
| MRPL28 | 16p13.3 | 0.588 | 7.80E − 18 | 2.48E − 15 |
| REV3L | 6q21 | -0.587 | 8.64E − 18 | 2.70E − 15 |
| NBEA | 13q13.3 | -0.586 | 9.74E − 18 | 3.00E − 15 |
| TSTD2 | 9q22.33 | -0.586 | 9.96E − 18 | 3.02E − 15 |
| HCFC2 | 12q23.3 | -0.586 | 1.13E − 17 | 3.37E − 15 |
| ACADSB | 10q26.13 | -0.585 | 1.22E − 17 | 3.59E − 15 |
| SETBP1 | 18q12.3 | -0.585 | 1.30E − 17 | 3.78E − 15 |
| C19ORF33 | 19q13.2 | 0.583 | 1.64E − 17 | 4.68E − 15 |
| ZNF429 | 19p12 | -0.583 | 1.72E − 17 | 4.79E − 15 |
| ACACB | 12q24.11 | -0.583 | 1.73E − 17 | 4.79E − 15 |
| PKMYT1 | 16p13.3 | 0.583 | 1.77E − 17 | 4.85E − 15 |
| ANXA2 | 15q22.2 | 0.582 | 1.83E − 17 | 4.94E − 15 |
| EIF3M | 11p13 | 0.582 | 1.94E − 17 | 5.17E − 15 |
| FTSJ1 | Xp11.23 | 0.582 | 2.09E − 17 | 5.48E − 15 |
| KAT2B | 3p24.3 | -0.581 | 2.32E − 17 | 6.01E − 15 |
| CTTNBP2 | 7q31.31 | -0.58 | 2.78E − 17 | 7.12E − 15 |
| SLC2A13 | 12q12 | -0.58 | 2.86E − 17 | 7.23E − 15 |
| LONRF2 | 2q11.2 | -0.579 | 2.98E − 17 | 7.35E − 15 |
| ANKFY1 | 17p13.2 | -0.579 | 2.98E − 17 | 7.35E − 15 |
| TAF10 | 11p15.4 | 0.579 | 3.08E − 17 | 7.50E − 15 |
| ADAMTSL3 | 15q25.2 | -0.578 | 3.51E − 17 | 8.41E − 15 |
| MRPS6 | 21q22.11 | 0.578 | 3.53E − 17 | 8.41E − 15 |
| MAML3 | 4q31.1 | -0.578 | 3.69E − 17 | 8.67E − 15 |
| ZBED3 | 5q13.3 | -0.576 | 4.61E − 17 | 1.06E − 14 |
| LEMD1 | 1q32.1 | 0.576 | 4.62E − 17 | 1.06E − 14 |
| TRMT112 | 11q13.1 | 0.576 | 4.81E − 17 | 1.09E − 14 |
| PEG3 | 19q13.43 | -0.576 | 4.92E − 17 | 1.10E − 14 |
| OST4 | 2p23.3 | 0.576 | 4.93E − 17 | 1.10E − 14 |
| APC | 5q22.2 | -0.575 | 5.37E − 17 | 1.17E − 14 |
| LYPLA2 | 1p36.11 | 0.575 | 5.38E − 17 | 1.17E − 14 |
| SF3B6 | 2p23.3 | 0.575 | 5.72E − 17 | 1.23E − 14 |
| KLHDC1 | 14q21.3 | -0.575 | 5.91E − 17 | 1.26E − 14 |
| SELENOH | 11q12.1 | 0.575 | 6.09E − 17 | 1.28E − 14 |
| ULK2 | 17p11.2 | -0.574 | 6.44E − 17 | 1.34E − 14 |
| TALDO1 | 11p15.5 | 0.574 | 6.61E − 17 | 1.36E − 14 |
| PREPL | 2p21 | -0.574 | 6.70E − 17 | 1.37E − 14 |
| APPBP2 | 17q23.2 | -0.574 | 6.80E − 17 | 1.37E − 14 |
| KCNJ3 | 2q24.1 | -0.573 | 7.98E − 17 | 1.59E − 14 |
3.7. Diagnostic Value of UBE2I in Pan-DSTs
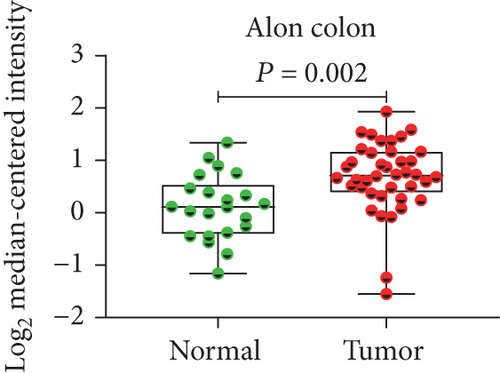
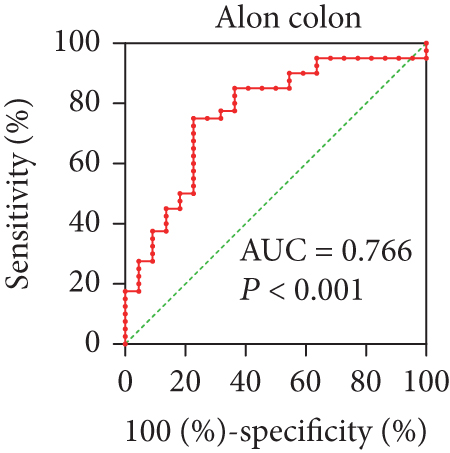
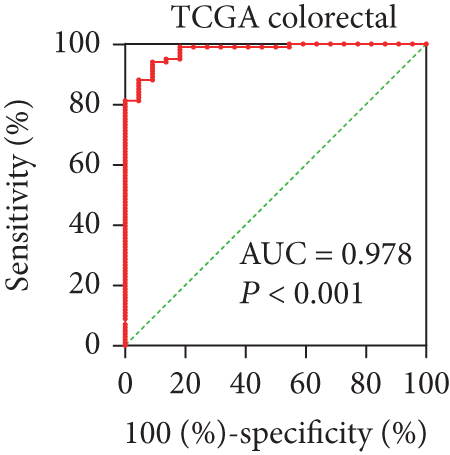
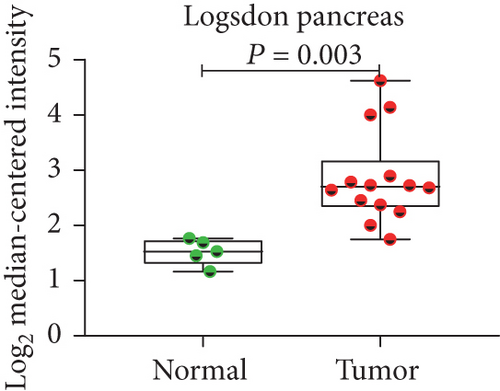
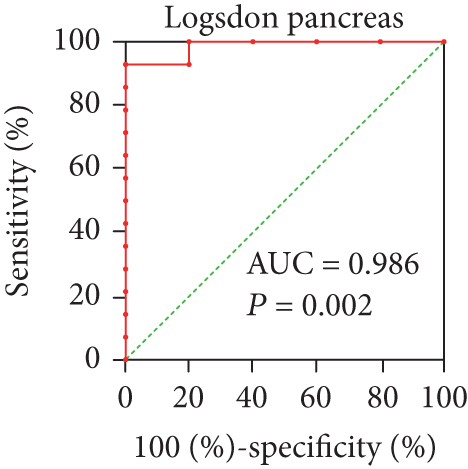
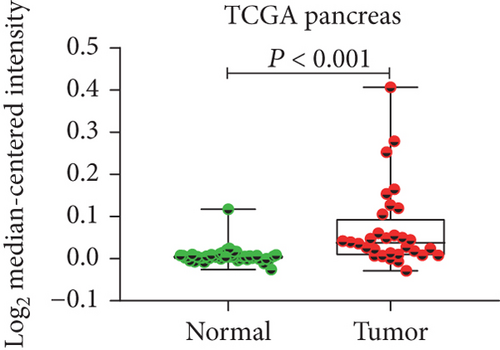
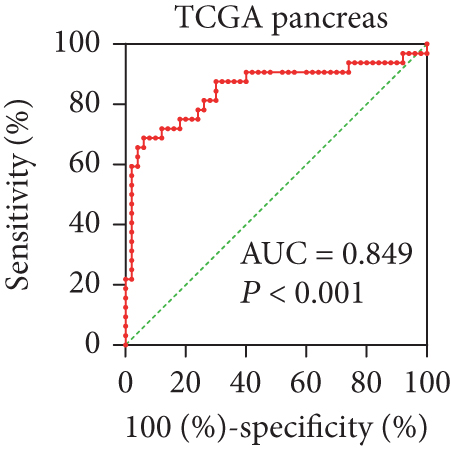
In view of the prognostic significance of UBE2I in COAD and PAAD, its diagnostic value in these cancer types was further explored. UBE2I displayed differential expression and favorable diagnostic value in COAD of TCGA colorectal and Alon datasets (AUC = 0.766 and 0.978, P = 0.002, <0.001, <0.001, and <0.001; Figures 11(a)–11(d)). Moreover, UBE2I showed differential expression and good diagnostic value in PAAD of TCGA pancreas and Logsdon datasets (AUC = 0.986 and 0.849, P = 0.003, 0.002, <0.001, and <0.001; Figures 11(e)–11(h)).

4. Discussion
The current research explored the potential correlation of UBE2I expression with a range of pan-DSTs, including CHOL, COAD, ESCA, LIHC, PAAD, READ, and STAD. Our data preliminary revealed differential expression of UBE2I, with higher expression in all tumor types, except ESCA. Interestingly, survival analysis indicated that high UBE2I expression was associated with adverse OS and DFS in PAAD but improved OS in READ. In immune infiltrate analysis, UBE2I expression was partially associated with purity or B cells, CD8+ and CD4+ T cells, MP, NP, and DC in COAD, LIHC, PAAD, READ, and STAD. Evaluation of the correlation between SCNAs and immune infiltrates revealed that UBE2I was associated with all six immune infiltrate types in STAD but partially associated with specific immune cell types in the other five pan-DST types. Differential promoter methylation of UBE2I was observed in PAAD only, with high methylation in tumor and low methylation in normal tissues. Consistently, stratified analyses by gender, nodal metastasis, and race showed differential methylation in PAAD, which was also partially observed in COAD, ESCA, and STAD. In colon cancer, differential UBE2I protein expression was observed as well as following stratification by gender, tumor histology, race, and tumor stage. Analysis of the interaction networks of potential pathways disclosed involvement of UBE2I in the spliceosomal snRNP complex, Notch signaling pathway, mitochondrial protein complex, small ribosomal subunit, Alzheimer’s disease, protein phosphatase inhibitor activity, and HIV infection in COAD and PAAD. Furthermore, UBE2I showed differential expression and favorable diagnostic value in COAD and PAAD from two separate datasets.
Digestive system carcinomas comprise many types of neoplasms including esophageal cancer, gastric cancer, small and large bowel cancers, and cancers from liver and bile duct system, pancreas, and anal regions [31], which are reported to contribute to more than 3.2 billion deaths worldwide [2]. In addition, digestive system malignancies account for ~40% of cancer-related deaths worldwide with substantial adverse effects on both developed and developing countries [4]. Thus, identifying novel biomarkers for early diagnosis and survival surveillance for high-risk populations and postsurgical patients remains an urgent medical requirement. Digestive system carcinoma subtypes in the TCGA database include CHOL, ESCA, LIHC, PAAD, COAD, READ, and STAD. To our knowledge, no studies to date have determined the expression profiles and clinical implications of UBE2I, also known as UBC9, in these pan-DSTs.
UBC9, the unique E2-conjugating enzyme needed for SUMOylation, is a core modulator of essential cellular functions and changes frequently in cancer, contributing substantially to the progression of human tumors [32]. Mattoscio and Chiocca [33] previously suggested that upregulation of UBC9 in HGSOC cells with BRCA1 mutations leads to loss of caveolin-1 and induction of vascular epithelial growth factor, supporting a pathway linking BRCA1 mutation in HGSOC with peritoneal permeability and ascites formation. The same group reported that knockdown of UBC9 in BRCA1 mutant triple-negative breast cancer and HGSOC cells inhibited cell proliferation and migration, indicating the pivotal role of UBC9 in endothelial-mesenchymal transition in such cancer type [34]. Epithelial-mesenchymal transition is a biological phenomenon whereby epithelial cells show enhanced migration ability to distal sites, facilitating tumor metastasis [35]. These findings support critical roles of UBC9 expression and dependent pathways in metastasis of triple-negative breast cancer. Similarly, our results suggest association of high UBC9 expression with poor prognosis in PAAD as well as differential levels (low in normal samples) of promoter methylation concerning lymph node metastasis. The role of UBC9 in PAAD in our study is consistent with that reported in other studies across diverse tumor types, including lung, colorectal, prostate, ovarian, and breast cancers as well as melanoma [36–41]. In addition, we determined the diagnostic potential of UBE2I in PAAD and COAD, which has rarely been reported in cancers. Our data showed favorable prognostic value of UBE2I in COAD but not in PAAD. A previous study on 602 early-stage colorectal cancer patients by Fridman et al. [42] revealed the presence of high memory T-cell (CD45RO+ and CD8+) infiltrates in tumors. In our experiments, UBE2I expression was positively correlated with purity and inversely with CD4+ T cells, MP, NP, and DC rather than CD8+ T cells, regardless of tumor stages. However, whether this inconsistency is associated with tumor staging or other influencing factors is yet to be elucidated.
Promoter methylation is the most extensively characterized type of epigenetic alteration; in particular, DNA methylation in CpG islands is predominantly present in the upstream promoter region that takes responsibility for inhibitory protein complex recruitment, inducing transcriptional repression of downstream genes [43]. There was once a proposal that DNA methylation alterations may contribute to oncogenesis, as the cytosine base of DNA was initially found to be methylated to 5-methylcytosine, or the fifth base [44]. Recent evidence has shown that 5-methylcytosine distribution alterations can help effectively differentiate cancer from normal cells, with focal hypermethylation of tumor suppressor gene promoters identified as one of the main mechanisms [44]. Homeostasis alterations of epigenetic mechanisms are crucial to the development of human cancers [44]. Consistently, our experiments showed increased promoter hypermethylation of UBE2I in PAAD tumors relative to control, which retained significance upon stratification by gender, race, and nodal metastasis, supporting the involvement of UBE2I hypermethylation in the development of PAAD. However, no data on methylation levels and prognostic significance on UBE2I were available for other pan-DST types.
Marked advances in tumor immunotherapy have been attributed to the increasing awareness of the importance of the tumor immune microenvironment in inhibiting antitumor immunity [45]. Overcoming the ability of cancer cells to evade immune detection allows the available treatment approaches for multiple cancer types to attack tumors via harnessing the “non-self”-directed specificity of the immune system [45]. One of the most promising therapeutic strategies for antitumor immunity reactivation is pharmacological manipulation of physiological immune checkpoints [45]. Exploiting immune checkpoint pathways is a major mechanism for tumors to escape immune surveillance, so immune checkpoint blockade underlies the antineoplasmic activity of most approved agents targeting CTLA-4, as well as programmed cell death protein-1/ligand-1 [46]. Additionally, a number of predictive biomarkers, such as abundance and location of tumor-infiltrating lymphocytes, have been explored for immune-oncology applications [42]. Established findings suggest that local inflammation significantly affects tumor progression. The group further showed that highly adaptive immune infiltrates of intratumoral lymphocytes present a crucial prognostic marker for solid tumors [42].
Solid tumors are often infiltrated by immune cells, including T and B lymphocytes, natural killer cells, DC, MP, NP, eosinophils, and mast cells [42]. Dunn and coworkers reported an association of immune deficiency with tumor proliferation and aggressiveness in a mouse model [47]. Clinical, experimental and epidemiological studies have indicated chronic inflammation as an important inducer of various cancer types [48], such as Helicobacter pylori infection in gastric cancer [49] and mucosal lymphoma [50]. The presence of lymphocytes in large quantities, especially T cells, in contrast to infiltration of cells responsible for chronic inflammation, is considered a beneficial prognostic marker for diverse cancer types, including melanoma, non-Hodgkin’s lymphoma, head-and-neck cancer, non-small-cell lung cancer, and breast, ovarian, esophageal, and urothelial carcinomas [42, 51–53]. Data from the current study indicate that UBE2I expression is associated with six immune infiltrate cell types and purity in COAD, LIHC, PAAD, READ, and STAD. Similar to earlier findings, a high NP count was associated with favorable prognosis in CHOL while a high MP count indicated adverse prognosis in STAD. Further research is warranted to explain this differential prognostic relevance.
This study has a number of limitations that should be taken into consideration. First, the findings obtained require further validation in other cohorts on a larger scale. Second, it is essential to clarify the mechanisms of UBE2I in COAD and PAAD in vivo and in vitro. Third, clinical translation needs to be explored for optimizing therapeutic application.
Conflicts of Interest
The authors declare no competing interests.
Authors’ Contributions
Shuai Huang and Xiangkun Wang contributed equally to this work and are co-first authors.
Acknowledgments
This work was supported by the Henan Province Key R&D and Promotion Special Support Project and Henan Province Medical Science and Technology Joint Construction Project (LHGJ20220317).
Open Research
Data Availability
The authors confirm that the data supporting the findings of this study are available within the article.


