Research on Failure Characteristics of Concrete Three-Point Bending Beams with Preexisting Cracks in Different Positions Based on Numerical Simulation
Abstract
Concrete three-point bending beams with preexisting cracks are widely used to study the growth process of I-II mixed mode cracks. Studying the failure characteristics of preexisting cracks at different locations on concrete three-point bending beams not only has important scientific significance but also has a wide range of engineering application backgrounds in the safety assessment of engineering structures. In this paper, through several numerical experiments, the influence of preexisting cracks at different positions on the failure characteristics of concrete three-point bending beams is studied, and three typical failure modes are obtained. The failure process of the specimens with three typical failure modes is discussed in detail, and it is pointed out that the crack failure mode is tensile failure. The change trends of bearing capacity, acoustic emission quantity, and acoustic emission energy of three typical failure modes are analyzed. The maximum bearing capacity, the maximum acoustic emission quantity, and energy of three failure modes of concrete three-point bending beams generally show an increasing trend.
1. Introduction
Concrete materials are always accompanied by cracks during construction, maintenance, and service periods. The nonlinear deformation of concrete when subjected to external force is due to the continuous occurrence of microcracks in the concrete during the loading process, and the continuous development of this microcracking leads to the final macrofracture [1, 2]. Although the commonly used finite element method can simulate the nonlinear deformation of concrete, it is only a kind of “shape similarity” in the macrobehavior and does not simulate the microfailure process of concrete in the deformation process, so it can not achieve “spirit similarity” [3–6].
Many scholars have studied the fracture behavior of concrete. Zhao et al. had investigated the rheological fracture behavior and established a simple and practical model for rheological fracture of rock cracks under the combined effect of hydraulic pressure and far field stresses [7]. Lin et al. pointed that the modified Burgers model can reflect the mechanical properties of rock in three creep stages [8]. Zhao et al. studied fracture toughness and subcritical crack growth of marble, lherzolite, and amphibolite under different environments [9]. Mubaraki et al. used three-dimensional finite element analysis (3D FEA) to study the effect of specimen thickness and crack length on the variations of mode I and mode II stress intensity factors (SIFs) [10]. Mubaraki and Sallam examined reliability of semicircular bending (SCB) specimen for measuring the fracture behavior of pavement materials under static and cyclic loadings [11].
The successful numerical simulation of the macromechanical behavior and failure process of concrete can reproduce the laboratory experiment process and failure mechanism, so that people can understand the occurrence mechanism of concrete failure process more clearly [12–15]. In addition, the numerical experiment can speed up the research process and make up for the lack of the laboratory experiment research. Insufficient, it can also replace some indoor experiments; for example, it can obtain the full-field information of stress and strain and the development law of real cracks simultaneously [16–19].
In order to analyze the fracture process of concrete, this paper adopts the real failure process analysis software (RFPA) developed by Tang Chunan’s team. The RFPA software mainly has the following characteristics: (1) It is considered that the macrofailure of material is the accumulation process of unit destruction by introducing the material nonuniformity parameter into the calculation unit [20, 21]. (2) It is considered that the properties of the unit are linear elastic-brittle or brittle-plastic, and other parameters such as the elastic modulus and strength of the element obey a certain distribution, such as normal distribution, Weber distribution, and uniform distribution. (3) It is believed that failure occurs when the unit stress reaches the failure criterion, and the stiffness degradation of the damaged unit is performed, so the continuum mechanics method can be used to deal with the physical discontinuous medium problem [22, 23]. (4) It is considered that the damage amount and acoustic emission of materials are proportional to the number of failure units [24, 25].
In this paper, the numerical simulation method is used to study the influence of preexisting cracks on the deformation and failure process of concrete when they are located at different positions of the beam, and the whole process of crack initiation, propagation, and fracture of the specimen is reproduced after the sample is loaded, and the fracture mechanism of three-point bending beam with preexisting cracks under static load is revealed.
2. Numerical Model
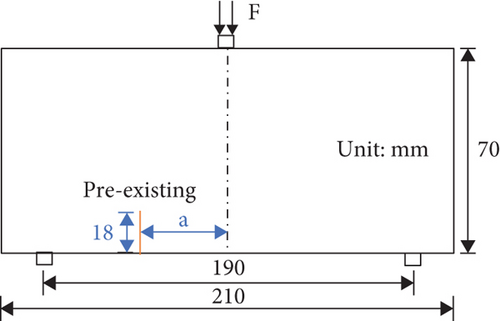
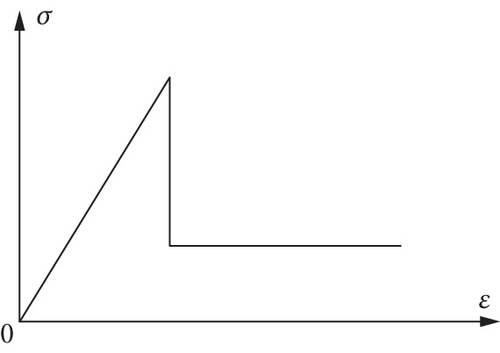
In this paper, the three-point bending numerical test of concrete beam is carried out, and the numerical model is shown in Figure 1. The size of the concrete beam is 210 mm × 70 mm. The numerical model is composed of 210 × 70 mesoscopic units. The mechanical parameters of the units obey the Weibull distribution. The mechanical model of the concrete three-point bending beam is simplified as a plane stress problem in the RFPA software. The distance between the two supporting points is 190 mm, the width of the preexisting crack is a meso unit size, and the length is 18 mm; a is the distance from the preexisting crack to the beam centerline, a = 0, 10, 20, 30, 40, 50, 60, 70, 80, 90 mm. The physical and mechanical parameters of concrete three-point bending beams are shown in Table 1. The displacement loading method is adopted, and the displacement increment of each step is 0.002 mm. Because concrete is a brittle material, it is compressive and not tensile, so the constitutive relationship of concrete in the numerical test is simplified as elastic brittleness, as shown in Figure 2.
| Parameter | Concrete three-point bending beam |
|---|---|
| Homogeneity index (m) | 5 |
| Uniaxial compressive strength (MPa) | 79.56 |
| Young’s modulus (MPa) | 30170 |
| Poisson’s ratio | 0.2 |
| Density (kg/m3) | 2450 |
| Friction angle (°) | 47 |
3. Analysis of Numerical Calculation Results
3.1. Failure Mode Analysis
The stress symbol in the RFPA software is the same as that in rock mechanics; that is, the tensile stress is negative, and the compressive stress is positive; therefore, the minimum principal stress cloud diagram reflects the tensile stress distribution characteristics and failure characteristics of the numerical model after each load. In this paper, the influence of different values of a on the failure mode of the beam is studied by several simulations, and three typical failure modes are obtained through numerical simulation. As shown in Figure 3, when a = 0 ~ 60 mm, the concrete three-point bending beam produces a crack that penetrates the entire specimen at the preexisting crack. When a = 70, 80 mm, the concrete three-point bending beam produces two cracks. One crack is at the preexisting crack, but the length of the crack is limited, and the other crack is located at the center of the specimen and penetrates the entire specimen. When a = 90 mm, the concrete three-point bending beam produces a crack that penetrates the entire specimen at the center of the specimen. The following three failure modes with a = 50 mm, a = 80 mm, and a = 90 mm are taken as examples to discuss each failure model in detail.
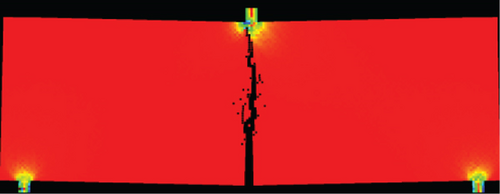
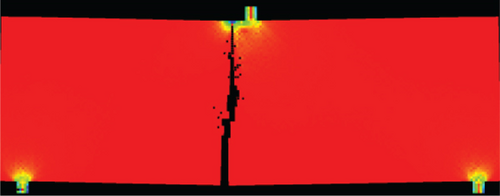
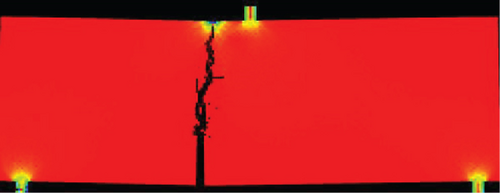
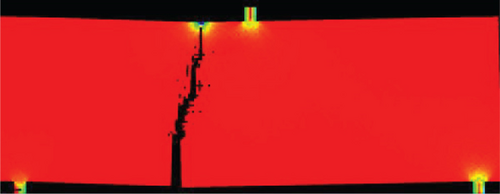
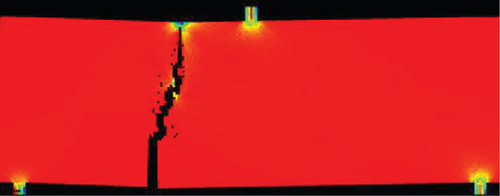
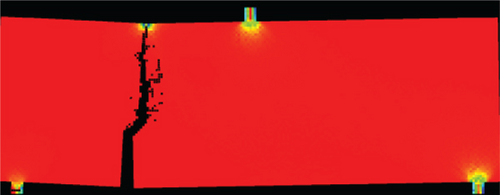
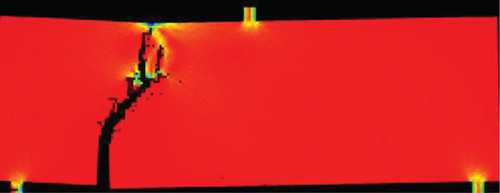
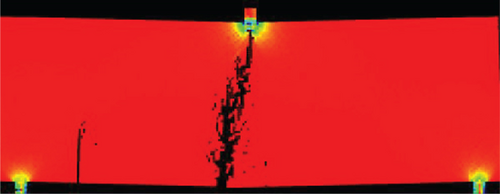
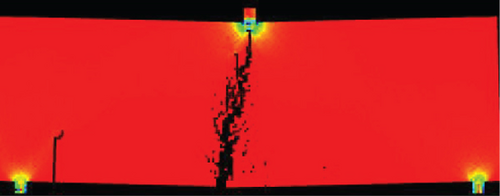
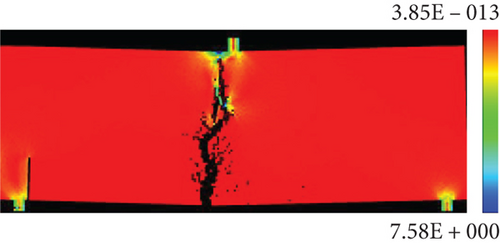
Figure 4 is the failure process diagram of a = 50 mm concrete three-point bending beam. The figure shows the minimum principal stress cloud diagram and the acoustic emission diagram of partial loading steps. When the load of the specimen reaches a certain value, there will be microcracks in the specimen, which will produce acoustic emission. The acoustic emission diagram can directly reflect the microcracking form of the numerical model. The white circle in the acoustic emission diagram in this paper represents shear failure, the red circle represents tensile failure, and the black circle represents the damaged unit. When the specimen is loaded, the tensile stress at the crack tip is concentrated, and the new crack begins to crack at the preexisting crack. As the crack expands, the tensile stress concentration area also shifts, causing the crack to expand along a certain angle toward the upper end of the sample near the point of concentrated load and finally penetrate the entire height of the specimen. However, the crack does not pass through the point of concentrated load, and there is a certain distance between the top of the crack and the point of concentrated load. It can be seen from the acoustic emission diagram that the failure mode of the crack tip is tensile fracture.
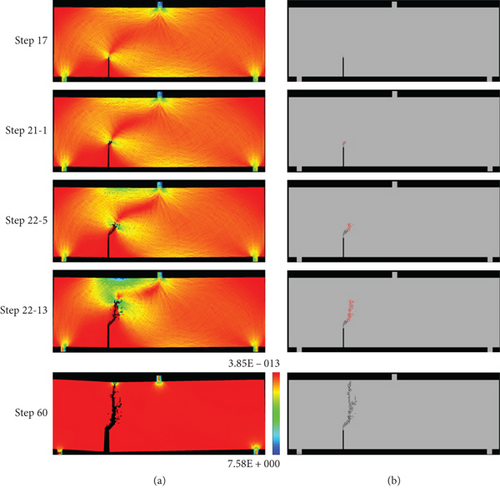
Figure 5 shows the failure process of a = 80 mm concrete three-point bending beam. Under the action of compound stress, the concrete three-point bending beam first begins to crack at the tip of the preexisting crack. When the loading continues, new cracks start to grow near the center of the lower end surface of the beam, and they propagate upwards at the same time as the preexisting cracks, but the propagation speed of the central crack is faster than that of the preexisting cracks. After loading to a certain value, the crack at the preexisting crack stopped to propagate, while the central crack continued to propagate. Finally, the vertical crack at the center of the beam penetrated the entire height of the specimen, resulting in the loss of bearing capacity of the concrete three-point bending beam. It can be seen from the acoustic emission diagram that the failure mode of the crack tip is tensile failure.
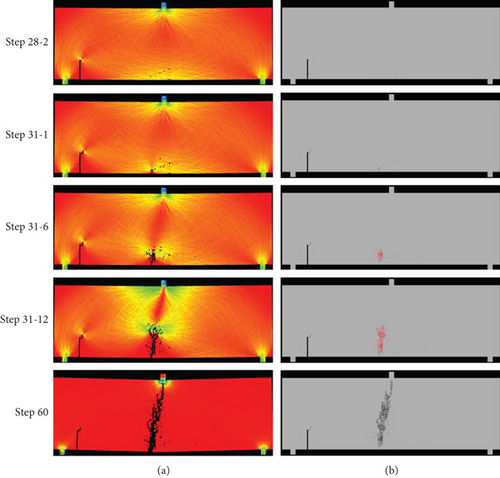
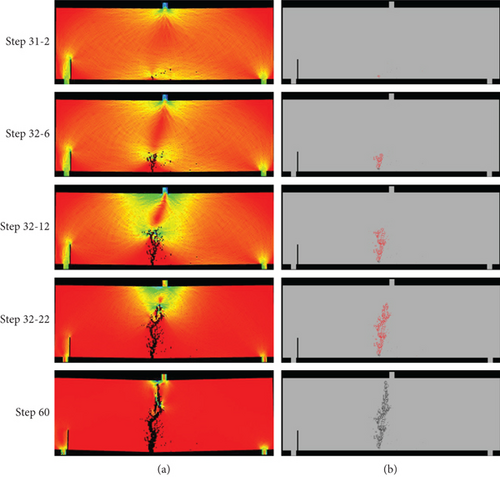
Figure 6 shows the failure process of a = 90 mm concrete three-point bending beam. After the specimen is loaded, new cracks begin to initiate near the center of the lower end surface of the beam. Affected by the nonuniformity of the concrete, the crack propagation path is tortuous and finally penetrates the entire specimen, while no crack occurs at the precrack. It can be seen from the AE diagram that the rupture mode of the crack tip is tensile rupture.
3.2. Changing Trend of Bearing Capacity
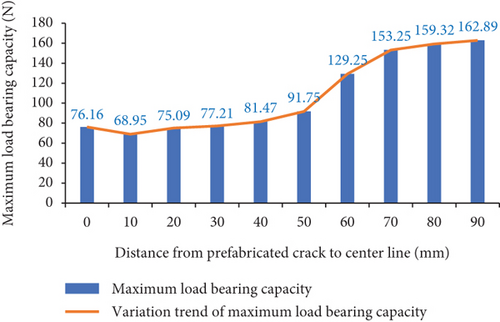
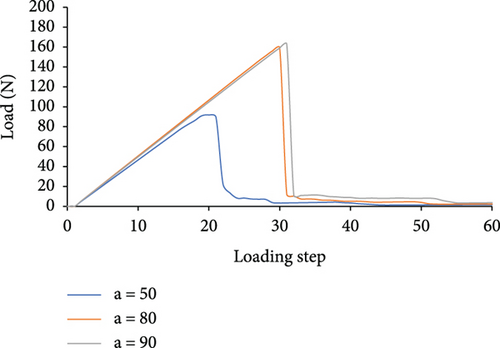
It can be seen from Figure 7 that when 0 ≤ a ≤ 10, the maximum bearing capacity of the specimen decreases slightly. When 20 ≤ a ≤ 90, the maximum bearing capacity increases in sequence; when a = 90, the maximum bearing capacity reaches the maximum value of 162.89 N. Figure 8 shows the full-process force-loading step curve of the three failure modes of concrete three-point bending beams. From this figure, it can be seen that the entire deformation process of the concrete specimen shows obvious nonlinear phenomena; the slope of the three failure modes in the linear deformation stage is basically the same; that is, the number of failure elements in each loading step is basically the same. The bearing capacity of the three failure modes all showed a sudden drop after reaching the maximum value, which indicated that the specimen quickly lost the bearing capacity.
3.3. Change Trend of Acoustic Emission
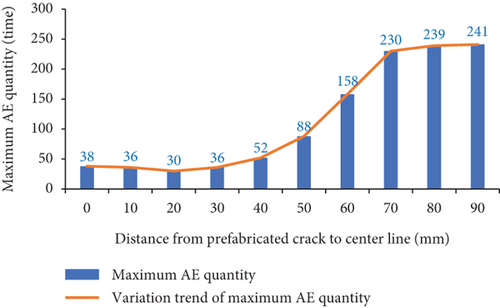
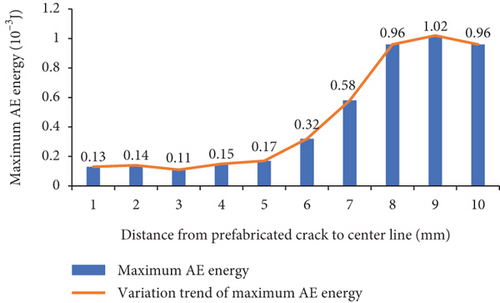
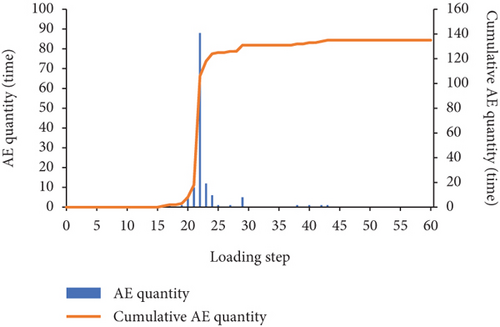
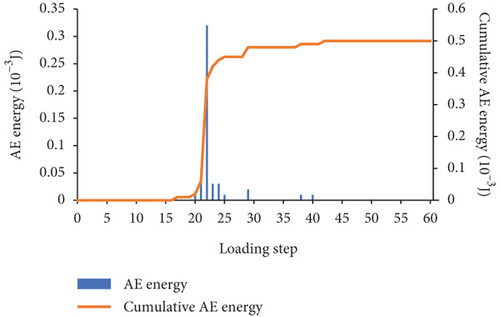
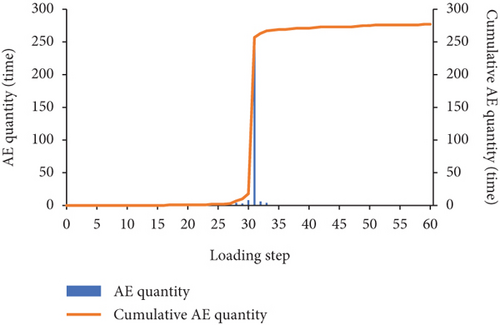
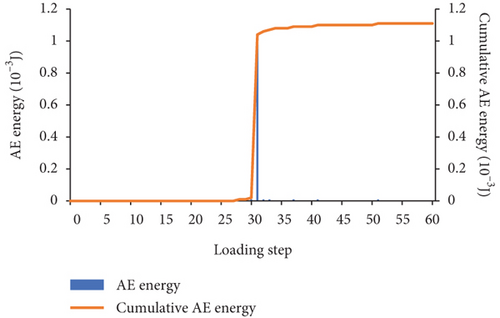
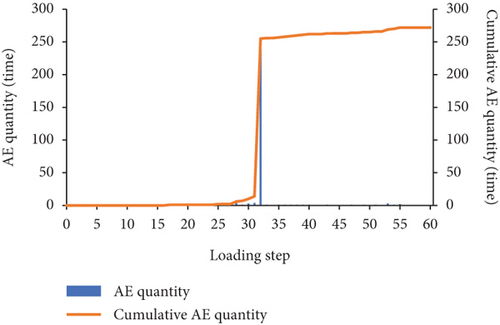
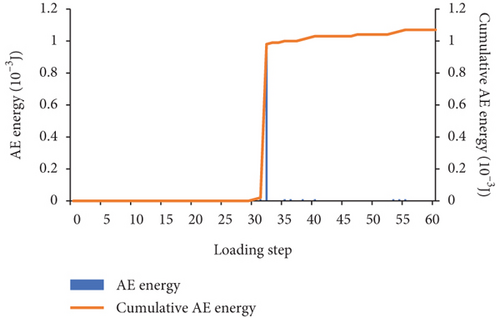
In the RFPA software, the destruction of the unit is accompanied by the generation of AE, the quantity of AE is counted according to the number of destroyed units, and the cumulative number of AE is the total number of AE up to this step. It can be seen from Figure 9(a) that when 0 ≤ a ≤ 20, the maximum number of AE decreases slightly. When 30 ≤ a ≤ 90, the maximum number of AE increases in turn; when a = 90, the maximum number of AE reaches 241. It can be seen from Figure 9(b) that the maximum AE energy is basically consistent with the variation law of the maximum AE quantity. When 0 ≤ a ≤ 20, the maximum AE energy generally shows a decrease. When 30 ≤ a ≤ 80, the maximum AE energy appears to increase sequentially; when a = 80, the maximum AE energy reaches the maximum value of 1.02 × 10⁻³ J; When a = 90, the maximum AE energy has a small decrease, which is equivalent to the AE energy when a = 70. Figures 10–12, respectively, show the AE-loading step curves of three failure modes of concrete three-point bending beam in the whole process. The AE quantity and AE energy of three failure modes all suddenly increase and then drastically decrease at a certain loading step, and the accumulated AE quantity and energy both suddenly have a sudden jump.
4. Conclusion
- (1)
The location of the preexisting crack has a significant impact on the failure characteristics of the beam. When a ≤ 60 mm, the crack starts from the tip of the preexisting crack and eventually expands toward the upper end of the specimen along a certain angle. When a = 70 and 80 mm, two cracks appear in the beam, one crack is a nonpenetrating sample crack at the preexisting crack, and the other crack originates from near the center of the bottom of the beam and expands toward the loading position, which will eventually lead to the whole sample to lose its bearing capacity. When a = 90 mm, the beam has only one through crack from the center of the bottom of the beam to the center of the top of the beam, and there is no crack at the preexisting crack. It can be seen from the AE diagram that tensile fracture occurs at the crack tip of three failure modes
- (2)
The maximum bearing capacity of the three failure modes of concrete three-point bending beams generally shows an increasing trend, and the change trend of the bearing capacity of the three failure modes of the specimens from the force to the failure is basically the same. The slopes of bearing capacity-loading step curve at the prepeak stage are approximately the same, and the “cliff-like” decline appears in the postpeak stage, and the specimen quickly loses its load-bearing capacity
- (3)
The maximum AE quantity and energy of the three failure modes of concrete three-point bending beams generally show an increasing trend, the quantity and energy of AE increase sharply in a certain loading step, and the accumulated quantity and energy of AE increase suddenly
Conflicts of Interest
We declare that we have no financial and personal relationships with other people or organizations that can inappropriately influence our work.
Authors’ Contributions
Zhe Zhang and Li Zheng contributed to the conceptualization. Tiesuo Geng and Hui Qin contributed to the methodology. Yonggang Tan contributed to the data curation. Liuqun Zhao contributed to the writing of the paper.
Acknowledgments
This study was supported by the Special Funds for Central Government Guidance to Local Governments for Science and Technology Development in Shenzhen (2021Szvup020).
Open Research
Data Availability
The data used to support the findings of this study are available from the corresponding author upon request.


