Influence of Water-Cement Ratio on Viscosity Variation of Cement Grout in Permeation Grouting
Abstract
Diffusion radius is an important construction parameter, because it can significantly influence the grouting effectiveness. Theoretical models in predicting diffusion radius have been practiced, but there are still significant discrepancies between theoretical calculations and realistic results in the practical construction. One of the critical reasons for the misprediction is the time-dependent behavior of the cement grout, which is significantly affected by the water-cement ratio (W/C). Therefore, this paper experimentally and numerically studies the influence of W/C on the viscosity variation of the grout and grouting process. Firstly, the apparent viscosity of the cement grout under different W/C is tested by a rotational viscometer in a laboratory experiment. Subsequently, based on the laboratory tests, numerical models are established to investigate the influence of W/C on the diffusion process of cement grout in sand layers. According to the laboratory results, the apparent viscosity of cement grouts decreases with the increase of W/C. Besides, the apparent viscosity increases with time, while the increasing range of apparent viscosity firstly increases and then decreases as W/C increases. Based on the simulated results, when W/C changes from 0.8 to 1.1, the diffusion radius at 60 min experiences a less and less obvious increase under the given grouting pressure for permeation grouting in the sand layer. When W/C is 0.9, the relative error reaches to 37.65% at 60 min, which is slightly lower than that of 0.8. However, when W/C changes from 0.9 to 1.0, the relative error becomes very narrow (21.36%), and this figure is much lower than that of 0.8 or 0.9. The simulation results are verified by field test, and the relative error is 6%, which proves the effectiveness of the analysis. Therefore, the cement permeation model considering viscosity variation of the grout is a reasonable alternative in the real project. At the same time, the time-dependent behavior of cement grouts should be considered, especially when using cement grouts with a low water-cement ratio in the practical engineering.
1. Introduction
Unfavorable foundation is a common problem in civil engineering and transport engineering. The cost for foundation treatment sometimes can make up more than half of the total cost in engineering construction, so that the foundation improvement becomes critically important. Permeation grouting with cement grouts has been widely utilized for foundation improvement because of its simple construction and high efficiency [1–3]. However, grouting effectiveness in practical engineering is significantly affected by the properties of grouting materials and geological conditions [4]. In addition, a reasonable estimation of grouting parameters before practical engineering will help grouting construction meet requirements at a relatively low price. In order to improve the accuracy of calculation, scholars have investigated permeation grouting from different points of view. For example, some put forward theoretical calculations based on a few assumptions and simplifications. Yang et al. [5] and Ye et al. [6] established theoretical models based on different constitutive models of flow pattern and deduced the calculation formulas for diffusion range or grouting pressure for permeation grouting. Besides, some researchers studied permeation grouting using experimental and numerical methods. For example, Celik [7] investigated the features of cement-based permeation grout based on some important grout parameters, such as the rheological properties, coefficient of permeability to grout, and injectability of cement grout. Similarly, based on the immiscible multiphase flow theory, Coskun and Tokdemir [8] established the mathematical model of permeable grouting in fully saturated soil. Furthermore, Fu et al. [9] proposed a mathematical model of seepage grouting according to the self-weight effect of slurry and established a prediction model of Bingham cement slurry setting size. Apart from that, Fu et al. developed a set of grouting test devices, which consist of a power device, pressure-bearing slurry tank, and several test frames [9]. The compressive strength, deformation modulus, and permeability coefficient were selected as the evaluation indexes of the grouting reinforcement effect.
On the other hand, researchers attach importance to the influence of grouts on grouting effectiveness. Among others, some scholars have tried to improve the theoretical formulas by using new methods in order to obtain more accurate rheological parameters. Dai and Bird [10] provided another approach to the establishment of a Reynolds-type equation in lubrication theory by variational theory. Beyond that, Rahman et al. [11, 12] measured the static and dynamic yield stresses with different measurement techniques. In addition, other scholars explored the influence of grouting materials on the diffusion process. Indeed, the power expended by the injection mechanism is the energy dissipated by viscous effects. Based on this fact, El Tani [13] obtained the radial flow rate of cement grout in a rock fracture from Bingham’s relation. Zhang et al. [14] regarded the quick setting slurry as a Bingham liquid of time-dependent behavior and employed an even capillary group model to describe the porous flow process. They suggested that the spatial uneven distribution of viscosity should be considered carefully in the grouting design. At present, researches focus on either viscosity measurement or viscosity variation under single W/C. Investigation on the influence of W/C on viscosity variation and the diffusion process is relatively rare. Besides, the discrepancy between the diffusion radius considering time-dependent behavior and that not considering different W/C has not been quantitatively studied.
Therefore, in this work, laboratory experiments and numerical simulations are carried out to investigate the influence of W/C on the diffusion radius of cement grouts in the sand layer as well as the discrepancies between the diffusion radius considering time-dependent behavior and that not considering. In particular, firstly, a laboratory test was performed to measure the apparent viscosity of cement grouts under different W/C, after which the viscosity variation characteristics were investigated by fitting the measured apparent viscosity with ORIGIN. Subsequently, based on the obtained time-dependent behavior of cement grouts, calculation models were established by COMSOL to simulate the diffusion process of the cement grout in the sand layer. Apart from that, the simulated results considering and not considering time-dependent behavior under different W/C were compared, and the influence of W/C on cement permeation grouting was analyzed.
2. Laboratory Experiment on Viscosity of Cement Grout
2.1. Experiment Instruments and Testing Material
The laboratory experiments focus on investigating the rheological properties of pure cement grouts, and the concerned W/C range is 0.5-1.1, widely used in practical engineering. According to Ruan [15], cement grouts under W/C 0.5-0.7 can be classified as power-law fluid, while grouts under W/C 0.8-1.0 are generally classified as Bingham fluid.
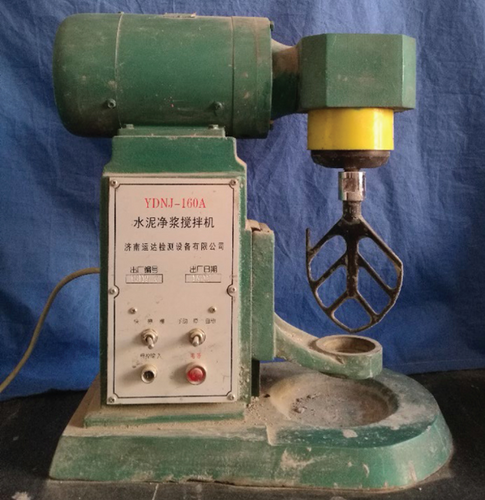
In the experiment, the YDNJ-160A-type mixer (Figure 1) was employed in preparing the fresh cement grouts. In order to accurately measure the apparent viscosity, the NXS-11B-type rotational viscometer (Figure 2) was adopted, and the main technique indexes of the viscometer are shown in Table 1.
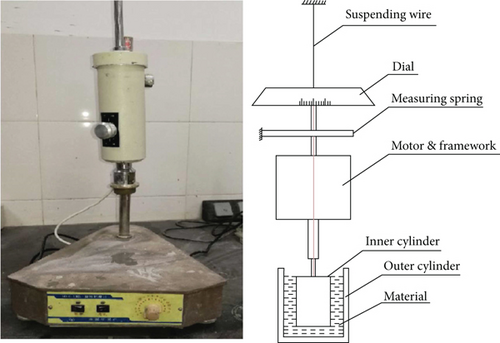
| Technique indexes | Parameters |
|---|---|
| Measurement range (η) | 2.8 ~ 1.78 × 10⁷ mPa · s |
| Shear stress range (τ) | 27.67 ~ 21970 Pa |
| Shear rate range (DS) | 1.23 ~ 996 s−1 |
| Rotational speed | 5.6 ~ 360 r/min |
| Reproducibility | ±1% (FS) |
| Environmental temperature | +5~35° |
The cement used in the experiment is Portland cement (PC) graded 42.5 produced by Sunnsy Group in Jinan. The main chemical composition is shown in Table 2.
| Material | CaO (%) | SiO2 (%) | Al2O3 (%) | Fe2O3 (%) | Fineness (m2/kg) | Specific gravity (kg/m3) |
|---|---|---|---|---|---|---|
| PC | 62.60 | 22.61 | 4.35 | 2.46 | 342 | 2980 |
2.2. Test Procedure
Fresh cement grouts under W/C 0.5~1.1 were firstly produced and kept in the thermostat with temperature of 20°. Subsequently, the apparent viscosity of grouts was measured from the very beginning to 40 min every 10 minutes. Then, the viscosity variation characteristics of cement grouts under different W/C were analyzed by fitting the measured apparent viscosity with ORIGIN software. Finally, mathematical equations describing the time-dependent behavior of cement grouts under different W/C were formed (specification for geotechnical tests).
2.3. Discussion of Experimental Result
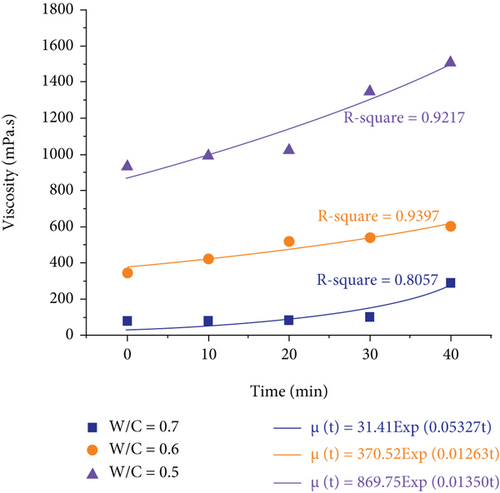
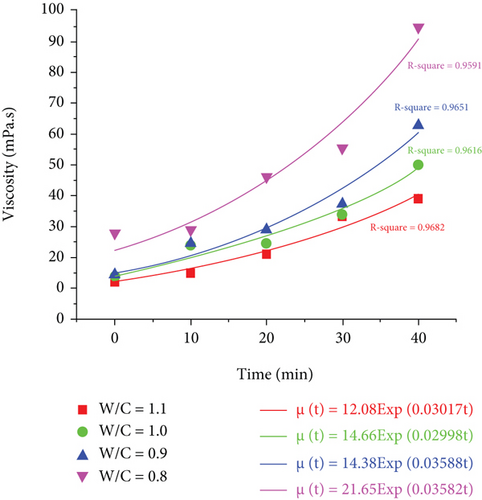
The apparent viscosity of cement grouts under different W/C is shown in Table 3. Based on previous researches [16], the relationship between apparent viscosity of cement grouting materials and time could be fitted as a natural logarithm function.
| W/C | Apparent viscosity (mPa·s) | ||||
|---|---|---|---|---|---|
| 0 min | 10 min | 20 min | 30 min | 40 min | |
| 0.5 | 932.54 | 992.06 | 1021.83 | 1349.21 | 1507.94 |
| 0.6 | 344.41 | 422.18 | 516.62 | 538.84 | 599.94 |
| 0.7 | 77.23 | 80.01 | 83.34 | 10.00 | 288.86 |
| 0.8 | 27.78 | 28.89 | 46.12 | 55.56 | 94.57 |
| 0.9 | 14.29 | 24.61 | 28.89 | 37.23 | 62.79 |
| 1.0 | 12.24 | 23.89 | 24.61 | 33.89 | 49.99 |
| 1.1 | 12.22 | 15.00 | 27.23 | 33.34 | 40.56 |
The fitting curves are shown in Figures 3 and 4. According to Figures 3 and 4, at the same moment, the apparent viscosity of grouts decreases when W/C increases from 0.5 to 1.1, and the apparent viscosity under W/C 0.5-0.7 is an order of magnitude higher than that of 0.8~1.1. Besides, the increasing range of apparent viscosity firstly increases and then decreases as W/C increases. When W/C is 0.5 and 0.6, the increasing range is less than 2 times of the initial viscosity. As W/C increases from 0.7 to 0.9, the increasing range increases from 3.74 times to 4.39 times. However, the increasing range drops from 4.08 times to 3.32 times when W/C increases from 1.0 to 1.1. In conclusion, the influence of W/C on time-dependent behavior firstly increases and then decreases as W/C increases.
Consequently, the time-dependent behavior of the cement grout must be considered to ensure the grouting effectiveness during the design and construction period.
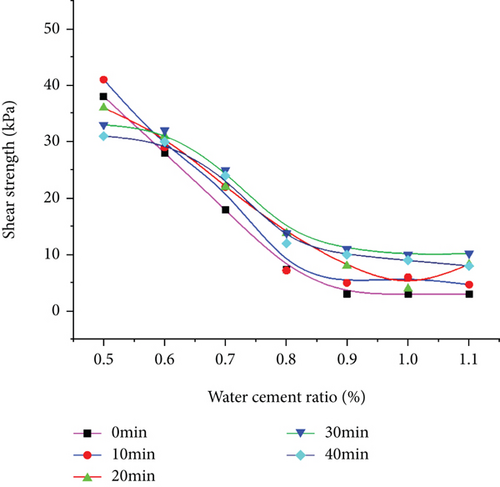
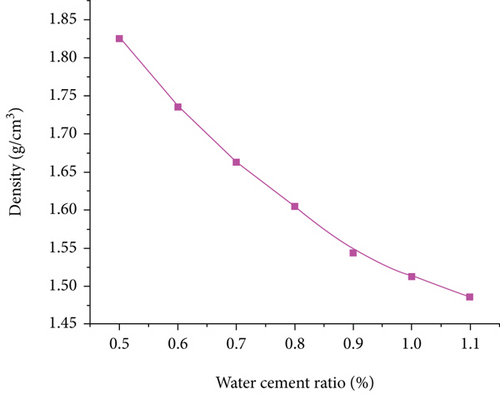
According to the test results, the variation rules of shear strength and density of slurry under different water-cement ratios are analyzed, as shown in Figures 5 and 6. Obviously, with the increase of the water-cement ratio, the density decreases linearly, and the shear strength also decreases. When the W/C is greater than 0.9, the change trend decreases.
3. Numerical Simulation Analysis
Based on the obtained time-dependent behavior of cement grouts, COMSOL is employed to simulate the diffusion process of cement grouts and calculate the diffusion radius under different W/C. Given that permeation grouting under constant grouting pressure is widely used in practical engineering, this research focuses on the influence of W/C on the grouting process under the given grouting pressure. The concerned subjects are the cement grout under W/C 0.8~1.1 because there are many related theoretical analyses about Bingham fluid [17], and it is convenient to compare with the simulated results. In fact, cement grout with W/C in the vicinity of 1.0 has been widely used in practical engineering.
3.1. Parameter Setting
- (1)
Gravity is negligible during the grouting process
- (2)
The yield strength is regarded as a constant with a value of 3 Pa
- (3)
The permeation grouting starts from the grouting pipe bottom, and the grout penetrates into the sand layer spherically under a grouting pressure of 300 kPa
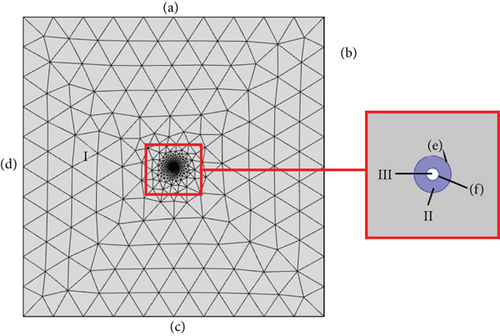
In the solid mechanics module, the surface is set as a free deformation boundary. The left and right boundaries of the model are set as the roller support boundaries, which only allow vertical displacement, rather than lateral displacement. The lower boundary of the calculation model is set as a fixed boundary. In the seepage mechanics module, the height of the groundwater level is set to be consistent with the surface height, and the left and right boundaries and the lower boundary of the calculation model are set as a no-flow boundary, that is, the seepage velocity ≠ 0.
The model of the numerical simulation is displayed in Figure 7, and the main parameters of the numerical model are presented in Table 4. The right part in Figure 7 is the local enlarged drawing of the grouting hole. In the initial condition, Part I and Part II are full of water and cement slurry, respectively, and Part III is the grouting hole with a radius of 30 mm. The entrance of the grout is Boundary (F), and the exit is Boundaries (A), (B), (C), and (D).
| Parameters | Value |
|---|---|
| Density of cement grout | 1520 kg/m3 |
| Viscosity of cement grout | Calculated by Equation (1) |
| Density of water | 1000 kg/m3 |
| Permeability of soil (K1) | 6.31e-11 m2 |
| Porosity of soil | 0.35 |
| Water-cement ratio | 0.97 |
3.2. Validity of Numerical Model
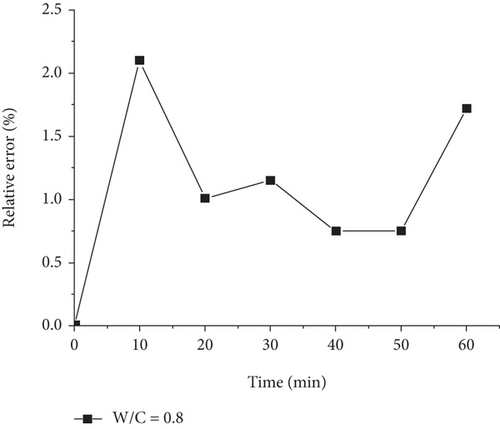
Based on the obtained results, the relative error between the diffusion radius obtained by theoretical calculation and the numerical simulation when W/C is 0.8 is shown in Figure 8. It is noteworthy that the relative errors are within 3%, manifesting that numerical simulation can well reflect the diffusion process. Thus, it is a reasonable alternative to use COMSOL to further analyze the influence of W/C on the grouting process.
After proving the validity of the calculation model, comprehensive investigations are carried out to explore the influence of W/C on the diffusion radius of permeation grouting in the sand layer. Besides, the relative error with regard to considering the time-dependent behavior of viscosity under different W/C is quantitatively analyzed.
3.3. Discussion of Simulated Result
3.3.1. Influence of W/C on Diffusion Radius
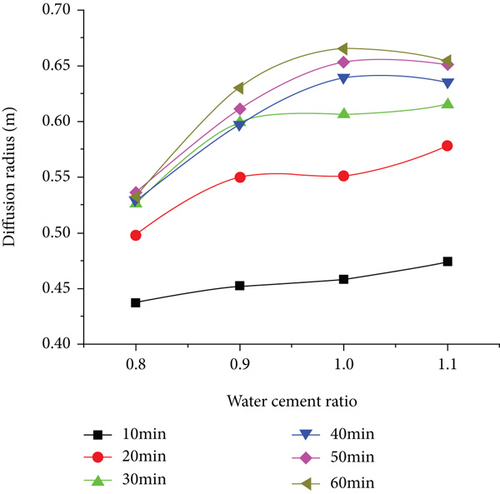
The diffusion radius of cement grouts under different W/C is shown in Figure 7. According to Figure 9, the diffusion radius increases as W/C increases from 0.8 to 1.1, indicating that larger W/C will lead to a larger diffusion radius. In particular, when W/C changes from 0.8 to 0.9, the diffusion radius at 60 min experiences a dramatic increase with the increasing range of 18%. The increasing trend becomes less obvious when W/C rises from 0.9 to 1.1. In addition, the diffusion radius under the same W/C increases with time and the growth rate becomes small. The attenuation rate decreases as W/C increases from 0.8 to 1.1. One possible reason lies in that the grouting pressure attenuates faster for cement grouts with higher W/C, because high-concentration cement grouts need more energy when diffusing in the sand layer.
3.3.2. Influence of W/C on the Relative Error of Diffusion Radius with Regard to Considering Time-Dependent Behavior
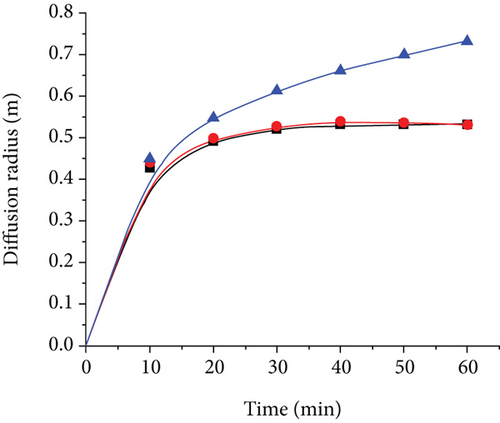
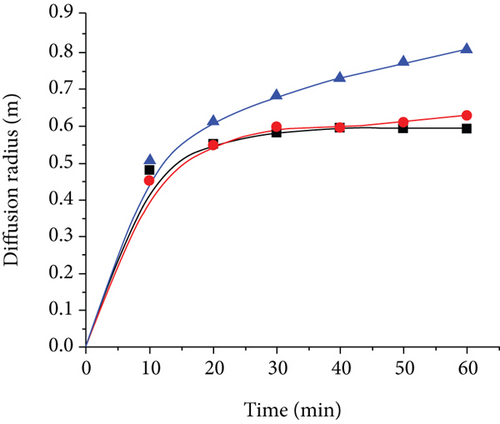
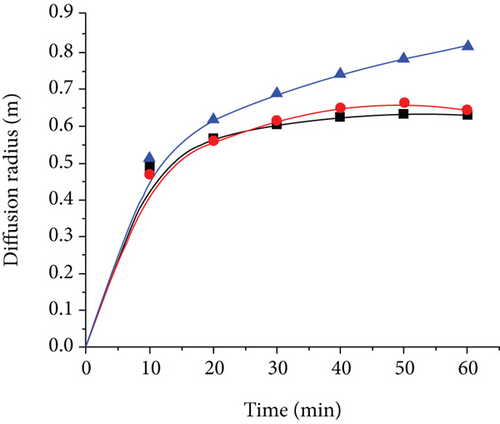
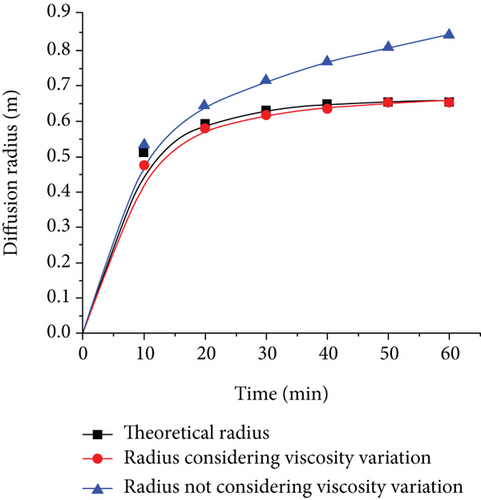
The simulated results considering time-dependent behavior and not considering time-dependent behavior and the theoretical diffusion radius under different W/C are compared. Based on the obtained results, the diffusion radius under the water-cement ratios of 0.8-1.1 is shown in Figure 10. Notably, theoretical radiuses and simulated results considering time-dependent behavior under all W/C show good agreements and keep steady after 40 min, which tallies with the actual conditions. With the attenuation of the grouting pressure, the diffusion radius marginally increases and eventually approaches a constant value. By contrast, the diffusion radius not considering a time-dependent behavior dramatically rises with time, resulting in an increasing gap with the theoretical radius or simulated result considering the viscosity variation of cement grouts.
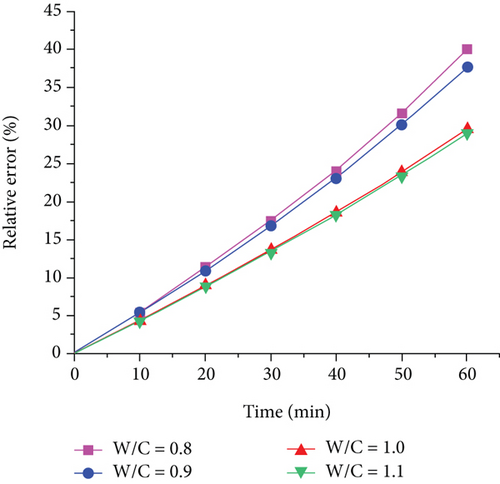
In order to quantitatively investigate the influence of W/C, the relative errors between simulated results not considering viscosity variation and the theoretical radius under different W/C are obtained (see the result in Figure 11). The influence of W/C on the relative error of the diffusion radius with regard to considering the viscosity variation decreases as W/C increases from 0.8 to 1.1. When W/C is 0.8, the relative error sharply enlarges with time, reaching to nearly 40% at 60 min. Similarly, when W/C is 0.9, the relative error reaches to 37.65% at 60 min, which is slightly lower than that of 0.8. However, when W/C varies from 0.9 to 1.0, the relative error becomes more narrow (21.36%), and this figure is much lower than that of 0.8 or 0.9. The relative error experiences a slight drop when W/C increases to 1.1, possibly because the time-dependent behavior weakens when W/C increases.
3.3.3. Field Test of Grouting Diffusion Radius
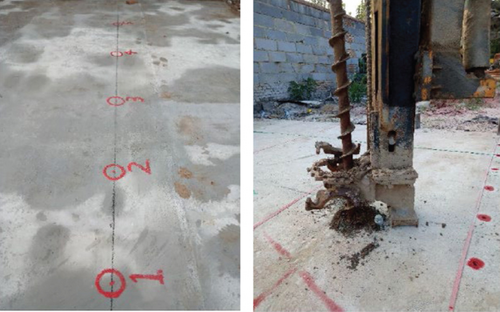
In order to verify the analysis and numerical simulation results, this paper conducted field grouting tests in the Yellow River impact area. According to the above simulation parameters, the slurry of different water-cement ratio is set, and the grouting time is 60 minutes (technical specification for earth dam grouting). In the wake of grouting, after 72 hours, the grouting part is excavated (see Figure 12).
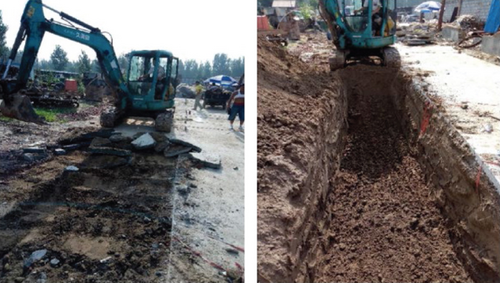
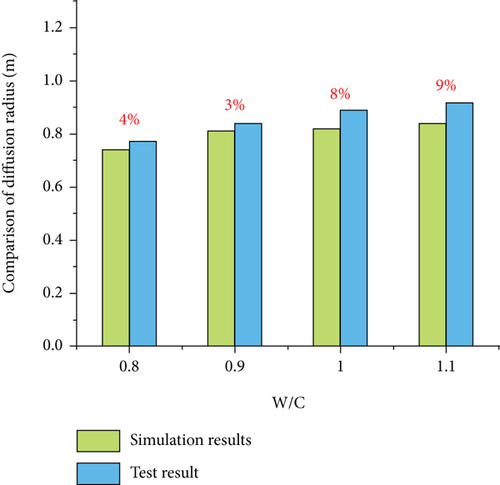
After excavation, the grouting radius under different water-cement ratios is calculated in detail (see the specific parameters in Table 5).
| Water-cement ratio | 0.8 | 0.9 | 1 | 1.1 |
| Simulation results (m) | 0.74 | 0.81 | 0.82 | 0.84 |
| Test result (m) | 0.77 | 0.84 | 0.89 | 0.92 |
The field test results reveal that with the increase of the water-cement ratio, the grouting diffusion radius increases gradually. Moreover, the test and simulation results are compared. It is found that the average error of the slurry diffusion radius between the simulation results and the field test results is 6% (see Figure 13), and the simulation results are in good agreement with the test results, which verifies the analysis conclusions in this paper.
4. Conclusion
- (1)
The apparent viscosity of cement grouts decreases with the increase of W/C. The apparent viscosity increases with time. Besides, the increasing range of apparent viscosity firstly increases and then decreased as W/C increases
- (2)
When W/C changes from 0.8 to 1.1, the diffusion radius of cement grouts at 60 min experiences a less and less obvious increase under a given grouting pressure for permeation grouting in the sand layer
- (3)
For the investigated cases, the relative error of the diffusion radius obtained by theoretical analysis and numerical simulation not considering viscosity variation drops when W/C increases
- (4)
According to the test results, the grouting diffusion radius increases gradually, and the test and simulation results are compared. It is found that the average error of the slurry diffusion radius between the simulation results and the field test results is 6%, and the simulation results are in good agreement with the test results
Conflicts of Interest
We declare that we do not have any commercial or associative interest that represents a conflict of interest in connection with the work submitted.
Acknowledgments
This work was supported by the Shandong Key Research and Development Plan (2019JZZY010429) and the Science and Technology Plan of the Shandong Transportation Department (2019B48).
Open Research
Data Availability
Some or all data, models, or code generated or used during the study are available from the corresponding author upon request.


