Molecular Dynamics Simulations of the Thermal Conductivity of Silicon-Germanium and Silicon-Germanium-Tin Alloys
Abstract
In this work, we investigate the thermal conductivity properties of Si1−xGex and Si0.8Ge0Sn2y alloys. The equilibrium molecular dynamics (EMD) is employed to calculate the thermal conductivities of Si1−xGex alloys when x is different at temperatures ranging from 100 K to 1100 K. Then nonequilibrium molecular dynamics (NEMD) is used to study the relationships between y and the thermal conductivities of Si0.8Ge0.2Sn2y alloys. In this paper, Ge atoms are randomly doped, and tin atoms are doped in three distributing ways: random doping, complete doping, and bridge doping. The results show that the thermal conductivities of Si1−xGex alloys decrease first, then increase with the rise of x, and reach the lowest value when x changes from 0.4 to 0.5. No matter what the value of x is, the thermal conductivities of Si1−xGex alloys decrease with the increase of temperature. Thermal conductivities of Si0.8Ge0.2 alloys can be significantly inhibited by doping an appropriate number of Sn atoms. For the random doping model, thermal conductivities of Si0.8Ge0.2Sny alloys approach the lowest level when y is 0.10. Whether it is complete doping or bridge doping, thermal conductivities decrease with the increase of the number of doped layers. In addition, in the bridge doping model, both the number of Sn atoms in the [001] direction and the penetration distance of Sn atoms strongly influence thermal conductivities. The thermal conductivities of Si0.8Ge0.2Sny alloys are positively associated with the number of Sn atoms in the [001] direction and the penetration distance of Sn atoms.
1. Introduction
Attention to metal nanomaterials and their applications can be creating a new approach in science [1–3]. Besides thermoelectric materials, nanomaterials are widely used to modify properties of composite materials, such as pharmaceutical material [4] and electrolyte material [4–12]. Due to the high thermal conductivity of Si and Ge, they are not suitable to be used as thermoelectric materials alone. However, when the two materials are completely alloyed, the thermal conductivities of the alloys are significantly lower than that of the two materials themselves. Researchers usually use Si as matrix materials to prepare SiGe alloys by doping Ge into Si. In SiGe alloys, by controlling the ratio of Ge to Si, the thermal conductivities can be modulated artificially. Since SiGe alloys have the advantages of good stability, high melting point, and strong oxidation resistance, they are widely used in spacecraft radioisotope batteries, power generators for micro devices, etc. To improve their thermoelectric performance, it is necessary to reduce thermal conductivities of SiGe alloys. Doping other elements into SiGe alloys is an effective way to reduce thermal conductivities. Because of the limitations of preparation methods and experimental measurements, several numerical tools including lattice dynamics, molecular dynamics, the Boltzmann transport equation, and the Monte Carlo method are often employed to investigate the behaviors of heat transfer in nanoscale materials.
Molecular dynamics (MD) is a feasible micro-nanoscale research method based on classical Newtonian mechanics [13, 14] and is suitable for the study of heat conduction of SiGe alloys with dopants at the micro-nanoscale [15–23]. MD can be divided into equilibrium molecular dynamics (EMD) and nonequilibrium molecular dynamics (NEMD). Basing on the linear response theory, EMD is good at the system in equilibrium state. The latter is fit for the nonequilibrium state and can be further categorized into homogeneous and inhomogeneous modes in terms of the application conditions of periodic boundary.
2. Molecular Dynamics Simulations of the Thermal Conductivity of SiGe Alloys and SiGeSn Alloys
For SiGe alloys, the parameters required to simulate the thermal conductivities of SiGe alloys are given in Table 1 [26].
| — | m (10-26 kg) |
ε (eV) | σ (10-10 m) |
a (10-10 m) |
A | B | λ | γ | rc |
|---|---|---|---|---|---|---|---|---|---|
| Si-Si | 4.66 | 1.41992 | 2.105 | 5.431 | 7.05 | 0.6022 | 29.53 | 1.20 | 1.8 |
| Ge-Ge | 12.05 | 1.30665 | 2.221 | 5.658 | 7.05 | 0.6022 | 24.63 | 1.20 | 1.8 |
| Si-Ge | — | 1.45930 | 2.141 | — | 7.05 | 0.6022 | 31.08 | 1.34 | 1.84 |
As to SiGeSn alloys, the values of the SW potential parameters for Sn-Sn, Sn-Ge, and Sn-Si interactions in SiGeSn were determined by using a force-matching method based on the density functional theory (DFT) calculations [28], as shown in Table 2.
| — | σ (10 − 10 m) | ε (eV) | λ | rc | γ | A | B |
|---|---|---|---|---|---|---|---|
| Sn-Sn | 2.5681 | 1.2351 | 19.0031 | 1.8 | 1.2 | 7.05 | 0.6022 |
| Sn-Si | 2.2617 | 1.6435 | 8.7433 | 1.9172 | 1.1 | 7.05 | 0.6022 |
| Ge-Sn | 2.3313 | 1.5592 | 11.9601 | 1.8894 | 1.1 | 7.05 | 0.6022 |
3. Results and Discussion
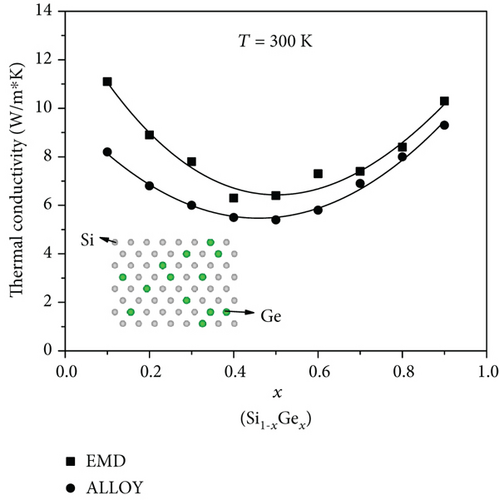
So, to verify the correctness of our model, we studied the thermal conductivities of SiGe alloys by changing the proportion of doped Ge atoms at 300 K in Figure 1. It can be seen that the thermal conductivities of SiGe show parabolic trends with the increasing proportion of Ge atoms. When x locates at 0.1~0.4, the thermal conductivity decreases with the increase of x. This is because the atomic mass and lattice constant of Si and Ge atoms are quite different, which exacerbates the defect scattering of short-wave phonons by lattice point defects. However, when x increases from 0.5 to 1.0, the thermal conductivities increase too, which suggests that the enhancement of thermal conduction of Ge atoms surpasses the hindrance of lattice point defect. In Figure 1, the solid squares are the results of the EMD simulation similar to the experimental results [30] marked as solid circles.
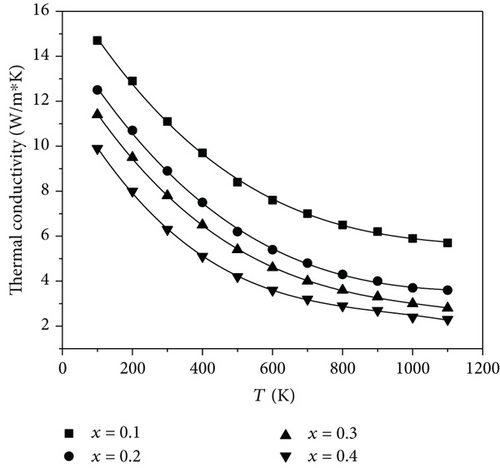
The thermal conductivities of SiGe with different temperatures were calculated in Figure 2. The results show the thermal conductivities of Si0.8Ge0.2 decrease significantly with the increase of temperatures and reach a flat level at about 1000 K. The reason for the decrease of thermal conductivities is that the number of phonons with high frequency increases at high temperatures giving rise to the increase of phonon-phonon inelastic scattering processes.
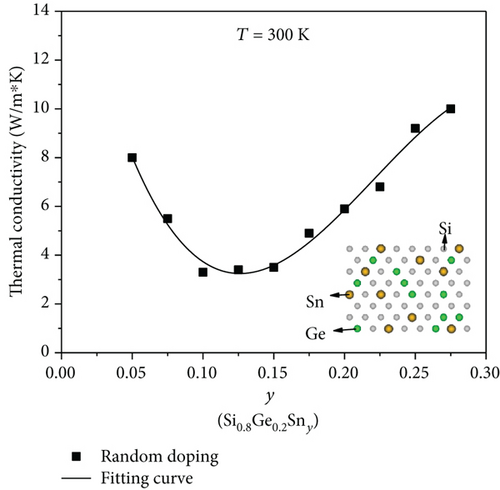
Subsequently, we evaluated the thermal conductivities of Si0.8Ge0.2SnySi0.8Ge0.2Sny by varying the proportion of Sn atoms at 300 K, as illustrated in Figure 3. The thermal conductivities of the random doping model decrease first, then increase with the increase of the proportion of Sn atoms, and reach the lowest value when y equals 0.10. This principle is the same as that shown in Figure 1. Because of the doping of Sn atoms, the lattice is distorted by a large number of point defects, which intensifies the scattering rate of short-wave phonons and lowers the thermal conductivity. But when the proportion of Sn atoms reaches a certain degree, its enhancement of heat transfer becomes predominantly, leading to a gradual increase of the thermal conductivities.
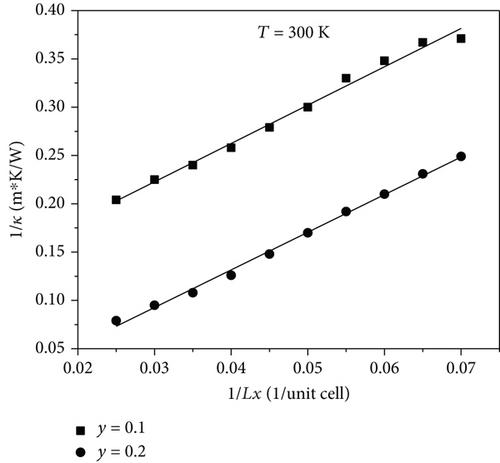
The relationships between the thermal conductivities of Si0.8Ge0.2Sny and the length of the intermediate layer at 300 K are shown in Figure 4. The Sn atoms were doped by random doping. The reciprocal of the thermal conductivities is approximately positively correlated with that of the length of the intermediate layer, and the thermal conductivities increase with the increase of the length of the intermediate layer. The results show an obvious size effect as the reported results [31].
The simulations of the thermal conductivities changing with temperatures under different number of doping layers in complete doping model are shown in Figure 5. Although the number of layers of doped Sn atoms is different, the thermal conductivities decrease as the temperatures increase. This is still because the rate of the Umklapp (U) scattering process increases at high temperatures, and so, the phonon mean free path (MFP) decreases. When the number of doped layers n ≤ 4, the thermal conductivities decrease with the increase of the number of doped layers. As n > 4, the decreasing range becomes smaller, and the simulation results tend to be stable. In Figure 6, the results show that when the bridge doping model is used, the U process still reduces the thermal conductivities, and finally, the thermal conductivities become a constant value at a certain temperature. When the number of doped layers n ≤ 4, the increase of the number of doped layers will lead to an effective decrease of thermal conductivities, but when n > 4, the increase of the number of doped layers will not cause an obvious change of thermal conductivities. In Figures 5 and 6, the thermal conductivities will have a sharp decreasing trend between 250 K and 300 K. Moreover, when the temperature is higher than 700 K, the curves of thermal conductivities begin to converge. The reason may be explained by the fact that the simulated temperature is higher than the melting point of Sn, and the influence of the number of doped layers of Sn atoms on the thermal conductivities becomes weaker than ever.
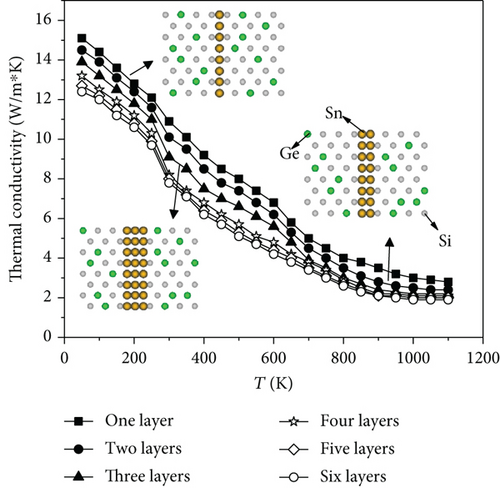
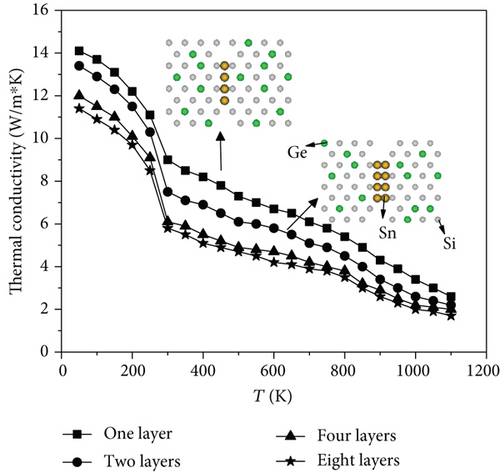
The decrease of thermal conductivities of the two doping modes with the increase of the number of doping layers is presumably due to the doped Sn atoms regularly arranged, and the surrounding lattice structure is torn to form grain boundaries, which intensifies the boundary scattering of phonons and reduces the phonon MFP, leading to the decrease of thermal conductivities. But while the number of layers increases to a special value, the effect of boundary scattering is saturated, and most of the phonons pass through the boundary and continue to transfer heat after overcoming the thermal resistance. Comparing the two doping methods, it is not difficult to find that the thermal conductivities of bridge doping are lower than that of complete doping with the same number of doped layers. The reason for this phenomenon may be attributed to that bridge doping narrows the propagation path of phonons and limits their MFP.
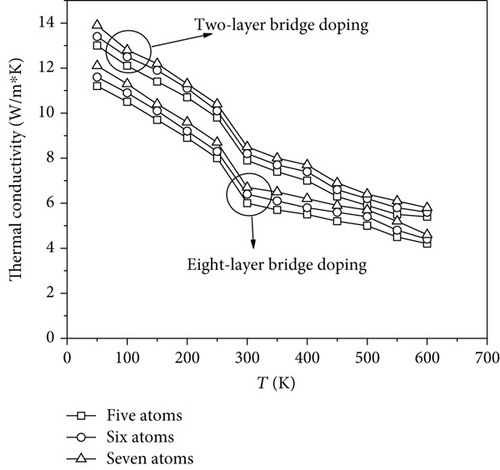
Figure 7 shows the results of thermal conductivities with different atomic numbers in the [001] direction when the number of layers of bridge doping is two and eight. It can be seen that no matter how many layers of Sn atoms are doped, the thermal conductivities increase as the number of atoms increases, which further confirms the above conclusion that the thermal conductivities of bridge doping are lower than that of complete doping.
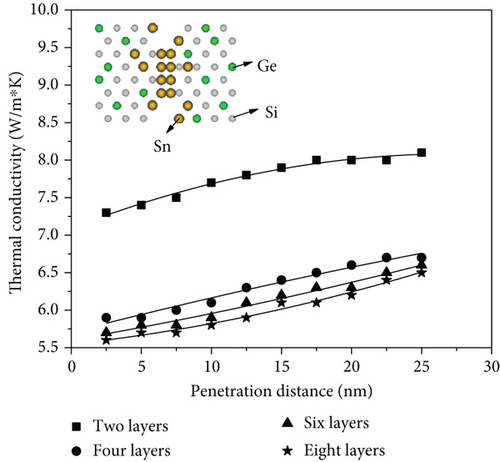
However, when bridge doping model is applied in this simulation, it was found that Sn atoms will penetrate to both sides and cause a certain change in the values of thermal conductivities. Therefore, we have investigated the dependence of the penetration distance of Sn atoms on the thermal conductivities under different doping layers at 300 K. The simulations are shown in Figure 8, which shows the results of two-layer, four-layer, and eight-layer bridge doping models separately, assuming that the penetrative Sn atoms are randomly distributed. It was found the thermal conductivities will increase slowly with the increase of the penetration distance. The reason may be that the scattering effect of point defects generated by random doping on phonons is weaker than that of boundary scattering on phonons.
4. Conclusions
In this work, the MD method is applied to investigate the thermal conduction properties of Si1−xGex alloys and Si0.8Ge0.2SnySi0.8Ge0.2Sny alloys. Some calculations in our work are performed below the Debye temperature of the material. In the simulations of Si1−xGex alloys, Ge atoms are doped randomly. At T = 300 K, the thermal conductivities of Si1−xGex reach the minimum value when x locates at 0.4 to 0.5. And the thermal conductivities decrease with the increase of temperature and tend to be stable at about 1100 K. Further, we investigate the thermal features of alloys with three Sn doping modes as random doping, complete doping, and bridge doping. The results show that in random doping mode at 300 K, the thermal conductivities of Si0.8Ge0.2Sny reach the minimum while y is about 0.1. Compared with the thermal conductivities of Si0.8Ge0.2 alloys, the thermal conductivities after doping with Sn atoms are significantly reduced, indicating that it is feasible to reduce the thermal conductivities by doping an appropriate amount of Sn atoms in actual experiments. In complete doping mode and bridge doping mode at 300 K, when the number of doped layers n ≤ 4, the thermal conductivities decrease significantly with the increase of n. When n > 4, the thermal conductivities hardly change with the increase of n. Besides, when Sn atoms are doped by bridge doping, the more Sn atoms in the [001] direction and the farther Sn atoms penetrate, the higher the thermal conductivities will be.
Disclosure
I confirm that this manuscript is the author’s original work. The article has been written by the stated authors who are all aware of its content and approve its submission. The article has not been published previously. The article is not under consideration for publication elsewhere. If accepted, the article will not be published elsewhere in the same form, in any language, without the written consent of the publisher.
Conflicts of Interest
No conflict of interest exists.
Acknowledgments
This work was supported by the National Natural Science Foundation of China (51106043), the basic research project of Henan Provincial Department of Education Science and Technology (13A470176, 2014GGJS-059), and the special funding project of basic scientific research of Henan University of Technology (2017QNJH26), the opening project of National Facility for Translational Medicine (Shanghai).
Open Research
Data Availability
The data used to support the findings of this study are available from the corresponding author upon request.


