Mechanical Properties of Composite Materials from Waste Poly(ethylene terephthalate) Reinforced with Glass Fibers and Waste Window Glass
Abstract
After primary uses of the plastic product, most developing countries like Ethiopia are facing a shortage of postconsumer disposal waste sites and it became a very serious problem on environmental pollution due to its nonbiodegradable nature. For this reason, regenerating and using the waste product as resources and reducing environmental pollutions are a great opportunity. This research is aimed at the manufacturing of composite materials from waste poly(ethylene terephthalate) (PET) bottles reinforced with glass fibers and filled with waste glass powder for floor tile applications. The tile composites were prepared by the melt-mixing method followed by compression molding. The effect of filler, fiber, and PET matrix loading on the composite was investigated using their tensile, compression, and flexural strength tests. The sample was characterized using a universal testing machine. PerkinElmer FTIR instrument was also used. For this, eleven samples prepared by varying the glass fiber weight % from 0 to 10, PET matrix weight % from 70 to 85, and glass powder filler weight % from 5 to 20. The measurement results of the composite were maximum tensile strength (81.625 MPa) and flexural strength (1067.59 MPa) recorded at 10%weight of glass fiber, 85% weight of PET matrix, and 5%weight of window glass filler. The maximum compressive strength is 1876.14 MPa at 10% weight glass fiber, 70 wt% PET matrix, and 20 wt% window glass filler. Based on this, the tensile strength and flexural strength increased with increased weight % of glass fiber and decreased with increased window glass filler. The FTIR spectrum shows some of the groups that have been removed from the recycled PET; this explains the brittleness of the recycled PET as compared to the waste bottle PET. The microstructure was uniformly distributed, and the material became opaque, probably because the decrease in chain length improves chain packing, increasing the crystallinity degree and crystal size.
1. Introduction
Most developing countries facing a shortage of postconsumer disposal waste sites, and it becomes a very serious problem for environmental pollution. For this reason, regenerating and using waste products as resources and prevent environmental pollutions is a greater concern. Therefore, different researchers, considering the postconsumer waste glass and waste plastics, there is an effort to recover and use waste glass and waste plastics to avoid pollution otherwise it ends up at a disposal landfill. Currently, most of the recovered waste glasses and waste plastics are used by glass and plastic manufactured companies in the production of new glasses and plastics such as bottles and windowpane. But only a limited amount from the waste glass and plastic collected can be used towards the production of new glass and plastic [1].
Wastes are unwanted or discarded materials after primary uses such as plastics and glasses. However, we can produce different products, such as composite, from those waste materials by combining or separately using different recycling methods [2, 3]. Short life packaging materials (bags, bottles, etc.), used goods (computers, cell phones, furniture, cars, etc.), demolition materials from buildings (insulation, flooring, pipes, etc.), and disposables are some of the waste materials [4, 5]. Among municipal wastes, plastics are the most common material that can be easily recycled, and poly(ethylene terephthalate) (PET) is one of its major types. Usually, a recycling process is tailored to a specific material for optimal purification and decontamination to obtain high-grade recyclable material [6].
Recycling also helps in greening our infrastructures by conserving natural resources, making our infrastructures more durable due to high-performance mixtures, reducing greenhouse gas emissions and air pollution, and groundwater contamination [7]. Efficient recycling should provide new opportunities for the reintegration of discarded materials into the economic cycle; increase the added value of products from recycled materials, creating a sustainable solution of the polymer waste problem; and decrease the dependence on businesses utilizing oil to obtain raw materials and energy. The most common recycling methods are mechanical and chemical recycling and combustion [5]. Recycling and incineration are the usual aspects of recovery methods in the case of thermoplastic polymers. The incineration presents some problems like the production of toxic gases and residue ash. Recycling presents advantages such as reduction of environmental problems and saving both material and energy [8–10].
Polymeric composites are formed by combining fibers and polymer resin which is also known as fiber-reinforced plastic (FRP) [11]. Commonly, composites tend to have characteristics such as high strength; high modulus; low density; and excellent fatigue resistance, creep, creep rupture, corrosion, and wear. Each type of glass fiber has unique properties and is used for various applications in the form of polymer composites [12]. Silica, such as fumed silica and quartz, and silicates, such as clay and talc which are widely used as a filler [13, 14] were used.
The existing ceramic tiles are thin slabs of clay or other inorganic materials, hardened by oven firing and usually coated with some kind of glaze. It is most often a great choice for kitchens and bathrooms because it is easy to clean and does not harbor germs. But many homes, especially in warm climates, use tile to great effect in living areas and bedrooms, too. Ceramic tile is rated from zero to five based on hardness; zero through two is suitable for wall tile, three is good for most residential uses, and four and five are hard enough for commercial applications. The existing ceramic tiles are heavy, brittle, expensive, etc.; these are some disadvantages [15].
The most common solid waste is plastic material especially PET, and the other form of solid waste is broken glass. These PET bottle materials are disposed to the environment after the consumer consumes the product and glass products are also discarded as solid waste material if there is some cracking or broken down of the product.
Now, there are a lot of manufacturing companies that produce plastic- and glass-packed products. After the primary uses of the product, the packing plastics and glasses are disposed of everywhere randomly to the environment. Since the living standard of the society increases year in and year out, the amount of solid waste disposal of PET and glass materials also increases. The solid waste is not properly managed, it results in environmental pollution. Consequently, it creates hazard on human life and it affects humans, animals, and many types of ecosystem’s health, socioeconomic conditions, coastal and marine environment, and climate. The impact also increases with the amount of solid waste increasing. However, most developing countries face a shortage of postconsumer disposal waste sites, and it becomes a very serious problem for environmental pollution due to the nonbiodegradability of plastics and glasses [16]. For this reason, regenerating and using waste materials as resources and reducing environmental pollution are a greater concern. Therefore, the objectives of this study were to manufacture and characterize recycled poly(ethylene terephthalate) and waste glass as a filler composite reinforced with glass fiber for floor tile application. In addition, studies the mechanical properties of the composite and the effect of the weight percentage of the composition.
2. Materials and Methods
2.1. Materials and Equipment
The following raw materials were used: glass fiber (GF) is used as reinforcement, waste PET bottle is used as a matrix, waste glasses are used as a filler, stove and casserole (cooker) are used to melt the shredded PET plastic, soap and water are to clean the impurities, sheet metal is used to make the mold, weight balance, jaw crusher, disk miller, sieve analysizer, and basin of water are used to wash the PET bottle and glass wastes.
The following testing device were used: universal testing machine (WAW-600D) was used to test the tensile, compressive, and flexural strength of the composite and PerkinElmer FTIR instrument was used to test the functional groups.
2.2. Methods
The waste PET bottles were collected, cleaned, dried, and shredded for easier melting. After melting, the fibers and fillers were added at the required proportion and stirred until a homogeneous mixture was achieved. The mixture was then poured into the prepared mold and pressed to ensure it spread throughout the mold.
2.2.1. Shredding of PET Bottles
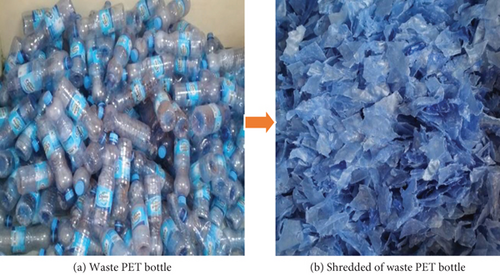
The collected waste PET bottles were prepared for recycling by cleaning them to remove any impurities and drying them to ensure no moisture remains. After which, they were shredded into small sizes as shown in Figure 1. This was done for easier melting.
2.2.2. Grinding of Waste Glasses
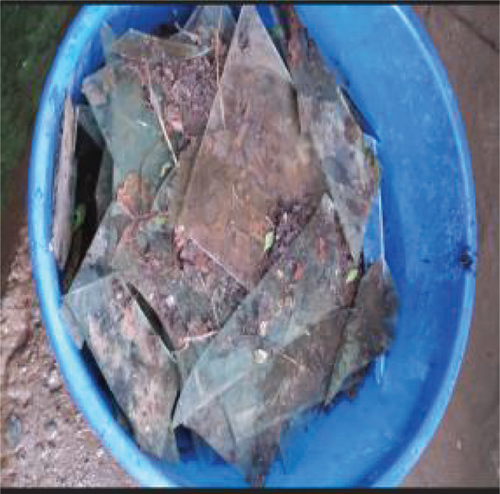
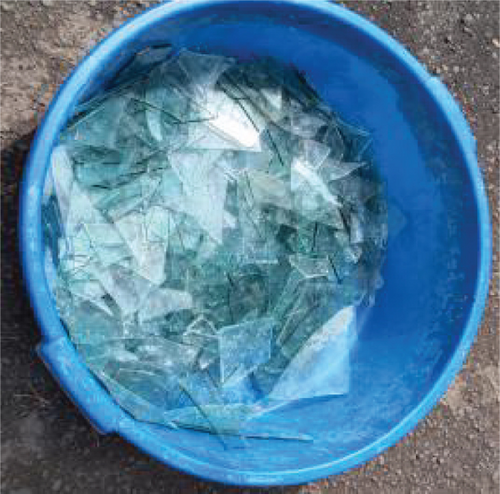
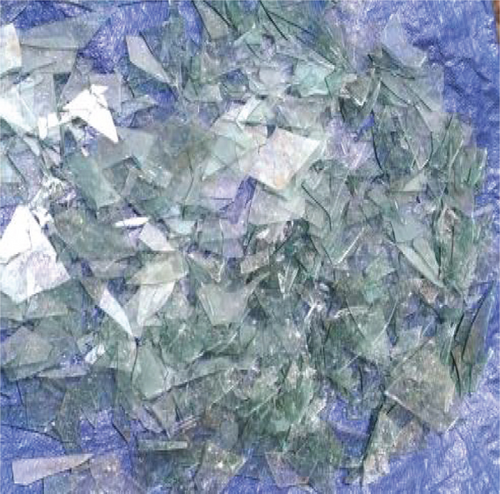
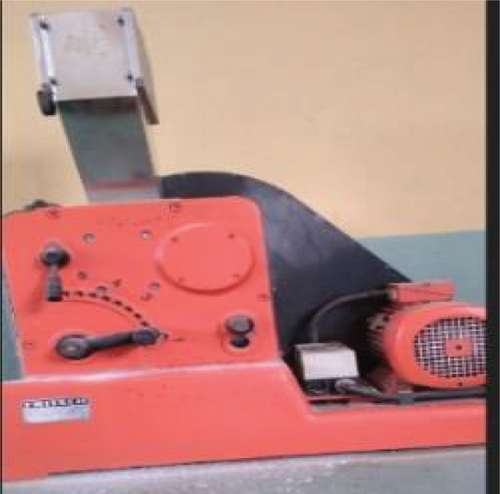
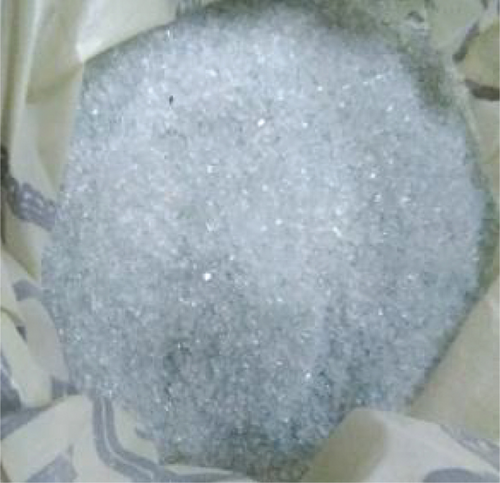
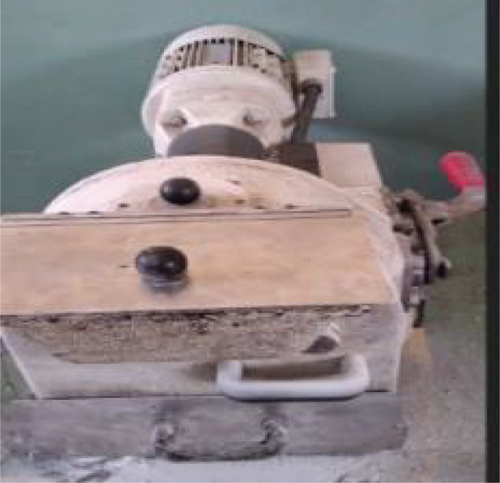
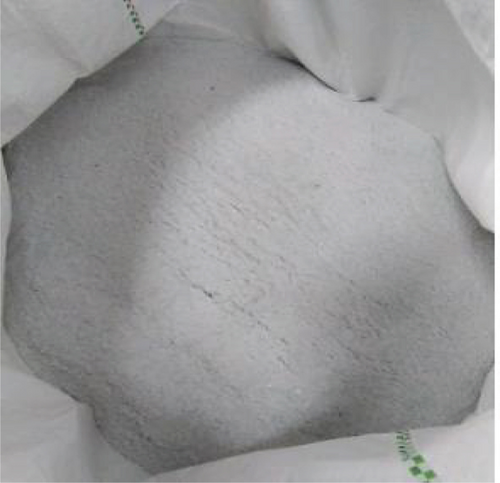
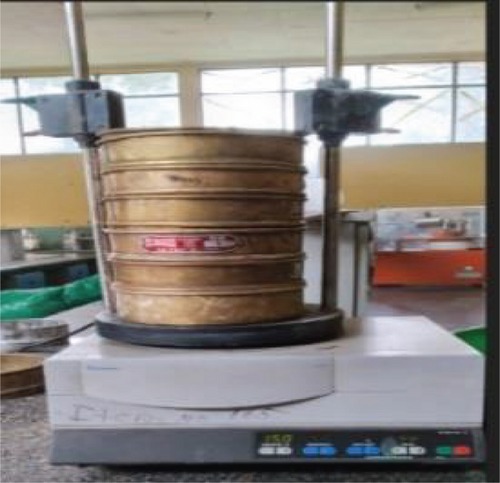
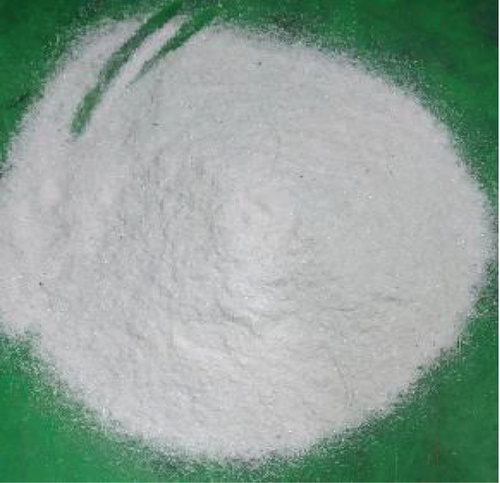
The collected waste glass was prepared for grounding into small sizes by cleaning them to remove any impurities or foreign objects and drying them at room temperature to ensure no moisture remains. After which they were ground into small sizes using jaw crusher and disk miller (to finer) and to get a uniform particle size which is 0.75-1.0 mm; sieve analysis is used (see Figures 2(a)–2(i)). This was done for easier mixing with the melted PET which is called a matrix.
2.2.3. Glass fiber
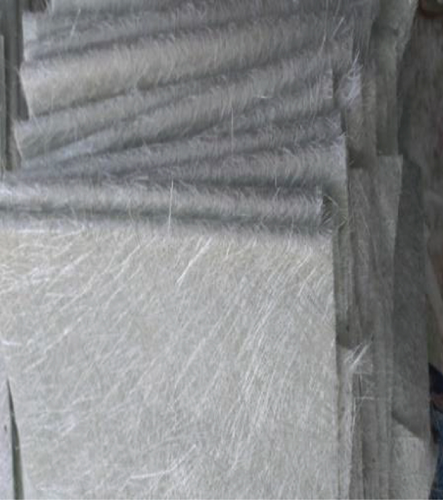
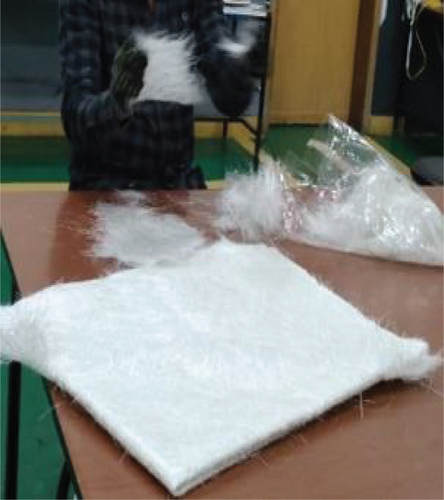
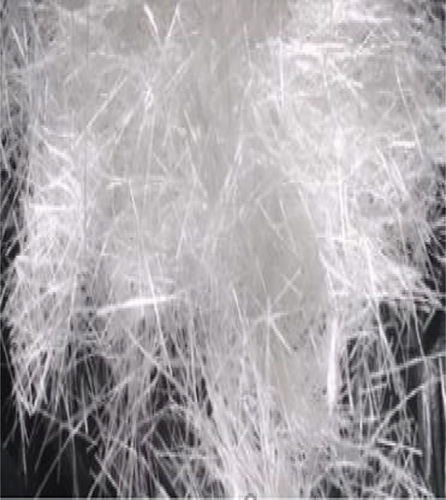
The glass fibers (GF) were bought in the form of a nonwoven mat. It was separated manually into individual fibers of 4 cm length as shown in Figure 3. This was done for easy mixing with the melted PET.
The most suitable processing size for melt mixing which gives effective reinforcement to plastics is from 5 to 36 mm [17]. Glass fibers (GFs) are most widely used among all the synthetic fibers as they offer excellent strength and durability, thermal stability, resistance to impact, chemical, friction, and wear properties.
2.2.4. Manufacture of Mold
The mold was manufactured according to the shape of the composite to be produced. For this work, a square mold of 20 × 20 × 3 cm. The mold was produced with the use of a 3 mm heavy gauge iron sheet so that it was not affected by the high temperature during composite manufacture. Besides, it is not bent during the manufacturing of composite material and gets stabled-shaped products.
2.2.5. Determining the Proportion of the Mixtures
The proportion of the three components was varied until the optimum result was obtained. To get the optimal proportion of ingredients, Design-Expert (DOE) software package was used and estimate the minimum and the maximum value for the factors according to related previous literature (see Table 1). Finally, the test results of the composites at different proportions will be feed to the software, and the software by itself analyzes the feed data and gives the optimum range of the factors with their optimal response value. In this study, three factors, namely, glass fiber, PET matrix, and waste window glass weight percentage variation will be considered and their effect on the performance of the composite will be analyzed.
| Run | %fiber loading | %matrix loading | %filler loading | Sample code |
|---|---|---|---|---|
| 1 | 10 | 85 | 5 | GF10M85F5 |
| 2 | 1 | 85 | 14 | GF1M85F14 |
| 3 | 9 | 78 | 13 | GF9M78F13 |
| 4 | 10 | 80 | 10 | GF10M80F10 |
| 5 | 6 | 81 | 13 | GF6M81F13 |
| 6 | 4 | 85 | 11 | GF4M85F11 |
| 7 | 10 | 74 | 16 | GF10M74F16 |
| 8 | 4 | 76 | 20 | GF4M76F20 |
| 9 | 4 | 79 | 17 | GF4M79F17 |
| 10 | 0 | 82 | 18 | GF0M82F18 |
| 11 | 10 | 70 | 20 | GF10M70F20 |
- Note: GF, M, and F stand for glass fiber, PET Matrix, and filler, respectively. And the subscript number indicates the weight % of each component.
2.3. Composite Sample Preparation
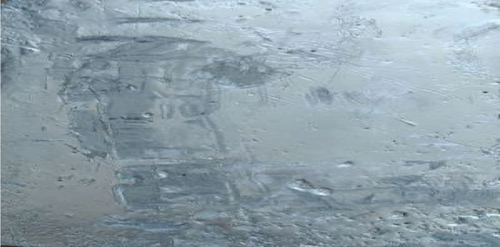
Randomly oriented glass fiber-recycled PET with waste window glass filler composite with varying fiber, matrix, and filler weight proportion were manufactured by the melt-mixing process. The parameters used were a mixing time of 8 min, rotor speed of 60 rpm, and mixing temperature of 265°C based on an early work by Gebremedhin and Rotich [18]. The temperature of 265°C was used because it does not affect the fiber properties. Composite tiles of size 200 × 200 × 10 mm were prepared using a closed mold. The mold was polished with a release agent to avoid PET from sticking to it. The process involved melting of the shredded PET, adding a predetermined proportion of the chopped fibers and fillers, melt-mixing thoroughly to form a homogeneous viscous solution (to get better fixation and uniformity), and pouring (placing) it into the prepared mold. Finally, the mold was closed and the samples were cooled down to room temperature under 12.5 MPa pressure for 30 min and demolding the sample as shownd in Figure 4.
2.4. Characterizations
2.4.1. Functional Group Analysis
The functional groups found in waste glass, bottle PET, and recycle PET were analyzed using the PerkinElmer FTIR instrument. FTIR spectrum outputs were obtained in the range of 4000–500 cm−1 using 5 scans and recorded in the absorbance mode as a function of wavenumber.
2.5. Mechanical Test
2.5.1. Tensile Strength Test
Tensile tests were performed on Universal Testing Machine (WAW-600D) at a cross-head speed of 50 mm/min. The detail dimension is shown in Table 2. The samples (rectangular shape specimen) were prepared for this test according to the ASTM (D 3039) test standard. The specimens were positioned vertically in the grips of the testing machine. The grips were tightened evenly and firmly to prevent any slippage with gauge length kept at 50 mm. At the beginning of the tensile test, the specimen elongates, and the resistance of the specimen increases which was detected using a load cell. This value was recorded until the specimen fractured, and five samples were tested.
| Dimension | Value (mm) |
|---|---|
| Thickness, T | 10 |
| Width overall, WO | 20 |
| Length overall, LO | 200 |
| Gauge length, G | 50 |
| Distance between grips, D | 100 |
2.5.2. Compression Strength Test
The composite will undergo compressive loading and unloading. The tests were performed using a universal tensile machine (WAW-600D), and the specimens were prepared according to the ASTM (D6641) test standard with dimensions 140 x12x10mm. The detail dimension is shown in Table 3. Five samples were tested.
| Specimen dimension | Value (mm) |
|---|---|
| Thickness | 10 |
| Width | 12 |
| Length | 140 |
2.5.3. Flexural Strength Test
Flexural strength is the combination of compressive strength and tensile strength. The tests were done on a universal testing machine (WAW-600D). The flat specimens were prepared according to the ASTM D7264 test standard with dimensions 125 × 12 × 10 mm. The specimens were tested on a support span of 65 mm as per the standard. The three-point system was used, and five samples were tested.
2.6. Microstructures Using Optical Microscope
The physical properties and mechanical behavior of a material depend on the microstructure. In this study, composite samples are subjected to direct microscopic observation using optical microscopes. For this research, a metallurgical optical microscope and 10x image magnification were used. A small piece of a specimen is cut by a metal-cutting-saw. After cutting operation, burrs on the edges of the specimen were carefully removed by a fine grinding paper and then polished the specimen. The purpose of this test is to see the distributions of the components in the crystal.
2.7. Data Analysis
Classical experimental design methods are too complex and are not easy to use. A large number of experiments have to be carried out when the number of parameters increases. To determine the relationship between independent variables (fiber loading, polymer loading, and filler loading) and the response variables (tensile properties, compression, flexural, impact strength, hardness, and water absorbency), the Design-Expert statistical software package was used. In this research study, a mixture optimal was used because it is a more appropriate model for response variables.
3. Results and Discussion
FTIR analysis Figure 5 shows the FTIR spectrum of bottle waste PET (V-PET) and recycled PET (R-PET). The FTIR spectrum shows that there is a difference between the waste bottle PET and the recycled PET. Some of the groups have been removed from the recycled PET; this explains the brittleness of the recycled PET as compared to the waste bottle PET. This could be because of the reduction in PET molecular weight or reduction of the chain length due to moisture absorption, contamination, oxidation, and thermal degradation [19].
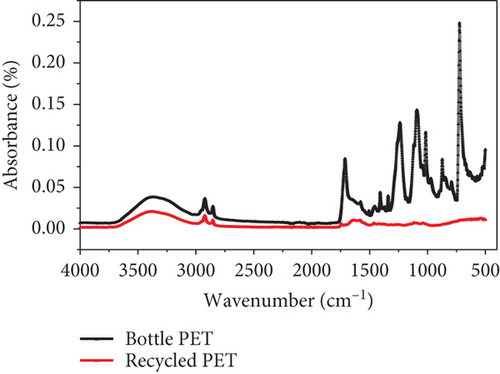
Throughout the recycling process, there is both chemical and mechanical degradations. This affects the mechanical properties and chemical resistance plus the melt viscosity of recycled PET which is less than virgin PET. The factors that cause a reduction in the physical, mechanical, chemical, and rheological properties of recycled PET will also affect the brittleness of the recycled polymer. These factors also make recycled PET lose its melting elasticity behavior [19].
FTIR spectra identified the key chemical compound existing in the waste glass filler as revealed in Figure 6 which shows the FTIR curve of the waste glass which confirms the presence of oxides which is glass formers or glass network former such as SiO2, B2O, and P2O5 and glass modifiers such as Al2O3, TiO2, Na2O, and CO3. In general, it confirms the presence of silica glass, borosilicate, and aluminum silicate. These groups play an important role in determining the interface between glass, glass fiber, and recycled PET.
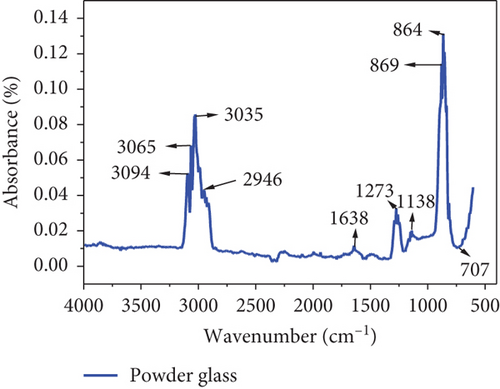
It should be noted that the peaks of waste glasses appeared from 3200 to 2850 cm−1 which corresponds to O–H bending and stretching vibration from the Si-OH silanol groups and are owing to adsorbed H2O molecules on the sample’s surface. Carbonyl stretching C-O very strongly appeared at 1638 cm-1 and mediumly at 869-864 cm-1. Band 1050–1170 cm-1 was owed to the asymmetric stretching vibration network of Si–O–Si. The peak appeared at 1273 cm−1 which corresponds to B-O stretching whereas a small peak at 750-606 cm−1 indicated Si–O–Al was assigned to symmetric stretching vibration network of the gel network [20].
3.1. Mechanical Properties of Manufactured Composites
For the characterization of the manufactured composites, from the experiments, it was found that the manufactured composite contains the following mechanical properties as shown in Table 4. The results of the mechanical test were in maximum force.
| Run | Fiber loading (%) | Matrix loading (%) | Filler loading (%) | Tensile strength (MPa) | Compression strength (MPa) | Flexural strength (MPa) |
|---|---|---|---|---|---|---|
| 1 | 10 | 85 | 5 | 81.625 | 1219.42 | 1067.59 |
| 2 | 1 | 85 | 14 | 21.595 | 424.387 | 834.514 |
| 3 | 9 | 78 | 13 | 73.4725 | 1374.43 | 1041.78 |
| 4 | 10 | 80 | 10 | 76.827 | 1314.04 | 1053.15 |
| 5 | 6 | 81 | 13 | 65.734 | 987.79 | 972.649 |
| 6 | 4 | 85 | 11 | 62.525 | 678.901 | 935.053 |
| 7 | 10 | 74 | 16 | 70.0963 | 1690.82 | 1051.26 |
| 8 | 4 | 76 | 20 | 45.9984 | 898.371 | 920.256 |
| 9 | 4 | 79 | 17 | 57.445 | 788.434 | 910.234 |
| 10 | 0 | 82 | 18 | 12.9205 | 360.867 | 809.754 |
| 11 | 10 | 70 | 20 | 69.9525 | 1876.14 | 1049.74 |
3.1.1. Tensile Strength
The tensile strength of the composite samples is shown in Figure 7. At 10 wt.% of glass fiber, 85 wt.% and 5 wt.% of glass powder (filler), (GF10M85F5), loading, the maximum tensile strength of the composite were 81.625 MPa and the minimum tensile strength was 12.92 MPa when the weight % of glass fiber, PET matrix and window glass powder is (0, 82 & 18), (GF0M82F18), respectively. The tensile strength of the composites increased with an increase in the fiber weight proportion. This increment indicates that there is a better interfacial distribution between glass fiber (GF), PET matrix, and filler and the composite becomes stiff and could withstand higher stress at the same strain portion. This means that, Young’s modulus of the composite is increased.
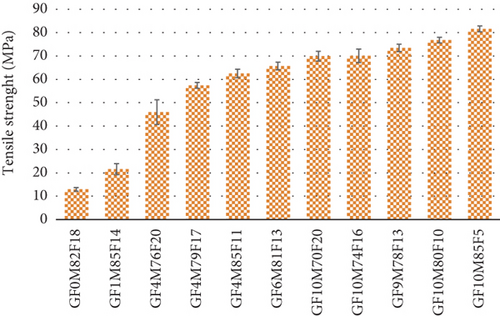
On the other hand, the tensile strength of the composite is decreased with an increase in the weight percentage of the matrix (PET) and the weight % of filler. Because the filler is stiffer and rigid than the matrix and deforms less, causing an overall reduction in the matrix strain and increasing stiffness, especially in the vicinity of the filler as a result of the filler/matrix interface. Fillers were considered additives and could only moderately increase the modulus of the polymer, while tensile strength remained decreased. To conclude, tensile strength decreased because of glomeration because the most reinforced constituent is filler/particle. Fiber agglomerations happened thus causing dispersion problems in PET, which lead to a decrement in tensile strength [21, 22].
(1) The Effect of Fiber, PET Matrix, and Filler Loading on Tensile Strength. In the tensile test, most properties can be represented by Young’s modulus and tensile strength. The fiber served as reinforcement because the major share of the load was taken up by the fibers. As shown in Figures 8(a) and 8(b), the tensile strength of the composite increased drastically with the increase in the fiber weight proportion from 0% to 10% and 12.9205 MPa to 81.625 MPa, respectively. On the other hand, the tensile strength of the composite is decreased with an increase in the weight percentage of the matrix (PET) (70-85 wt. %). In this case, the weight % of filler is fixed (14 wt.%). It can be deduced that the initial linear portion of the graph shows the elastic behavior of the composite specimen, which is consistent as observed in the sharp increments from 0 to 8 weight percentage of fiber loading and from 85 to 78% of matrix loading. This linear increment indicates that there is a better interfacial distribution between glass fiber (GF), PET matrix, and filler and the composite becomes stiff and could withstand higher stress at the same strain portion. This means that, according to Hooke law, Young’s modulus of the composite is increased. The tensile modulus showed a linear increase with glass fiber content in the composites [23–26]. From observation, after 8 wt % fiber loading, the increments of tensile strength become almost the same value and Young’s modulus of the composite is decreased (see Figures 8(a) and 8(b)).
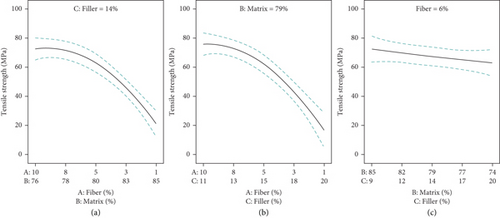
Traditionally, fillers were considered additives, which, due to their unfavorable geometric features, surface area, or surface chemical composition, could only moderately increase the modulus of the polymer, while tensile strength remained decreased. The filler is stiffer and rigid than the matrix and deforms less, causing an overall reduction in the matrix strain and increasing stiffness, especially in the vicinity of the filler as a result of the filler/matrix interface as shown in Figure 8(c).
As seen in Table 4 and Figure 9, the tensile strength (81.625 MPa) of sample 1 (10 wt.% of fiber, 85 wt.% of matrix, and 5 wt.% of filler) is greater than the tensile strength (69.95 MPa) of sample 11 (10 wt.% of fiber, 70 wt.% of matrix, and 20 wt.% of filler). In both cases, the fiber content is the same but the matrix and filler are different. The wt. % of the PET matrix in sample 1 is greater than sample 11. Now in the case of sample 1, a better interfacial distribution between glass fiber (GF), PET matrix, and filler and the composite becomes stiff and could withstand higher stress at the same strain portion [25, 26].
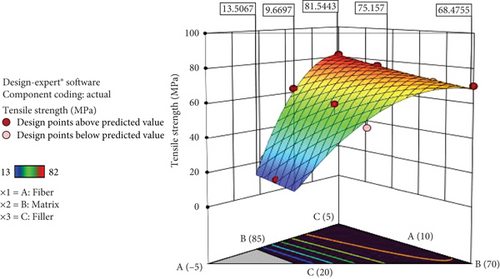
However, in the case of sample 11, the wt.% of the matrix is less and the wt. % of fiber was a bit excessive that the PET matrix was hard enough to flow through every fiber thus leaving voids and fibers were more easily exposed to environmental degradation and the tensile strength is decreased [24]. To conclude, tensile strength decreased because the interfacial adhesion between the fiber and PET was not good; fiber-to-fiber interaction was preferred by the system. Fiber agglomerations happened thus causing dispersion problems in PET, which lead to a decrement in tensile strength [21, 22].
3.1.2. Compressive Strength
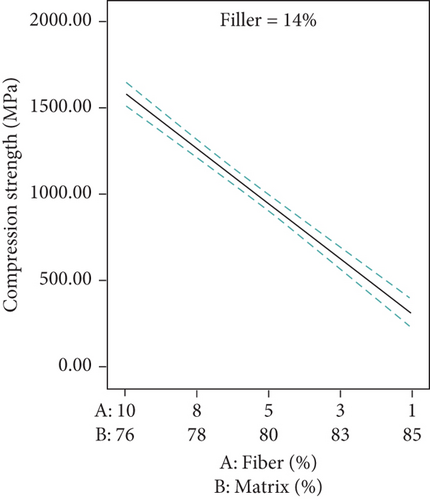
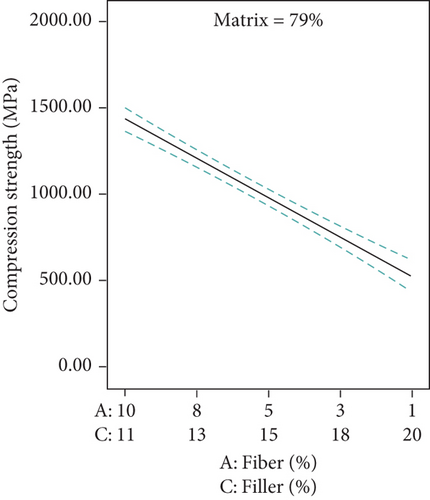
For this study, compressive strength is the most important of mechanical properties. Because the floor tile is mostly exposed to compression loading. Figure 10 shows the compressive strength test results. The maximum and minimum compressive strengths of the composite are 1876.14 MPa and 360.867 MPa, when the weight % of glass fiber, PET matrix and filler are (10, 70, and 20) and (0, 82, and 18), respectively, was achieved. The compressive strength was increased with increased weight % of filler content due to its high rigidity and stiffness properties of window glass filler, and the filler are stiffer and rigid than the matrix and deform less, causing an overall reduction in the matrix strain and increasing stiffness because fillers moderately increase the modulus of the polymer, while compressive strength remained increased. Due to this, the composite becomes stiff and could withstand higher compressive stress. The compressive strength increased with fiber loading increasing and decreased with increased weight % of the PET matrix. However, when the content of the fibers is increased in the composite, the compatibility between the fiber and the PET matrix is decreased because the PET matrix was hard enough to flow through every fiber thus leaving voids; due to this, the compressive strength becomes decreased [24–26].
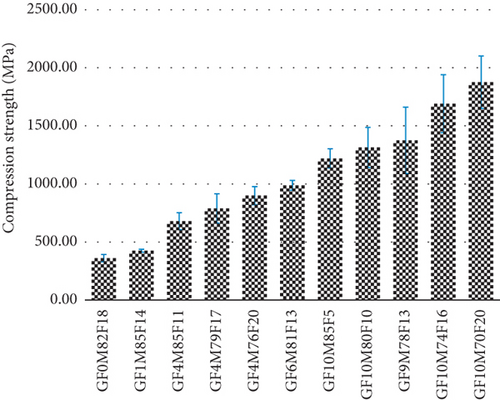
The weight % of the PET matrix is increased; it creates voids, and then, the interfacial adhesion between the filler and PET is not good, which leads to a decrement in compressive strength. Besides, fiber agglomerations happened thus causing dispersion problems in PET, which lead to a decrement in compressive strength [18, 24–26]. In general, the compressive strength is maximum when the weight % of fiber and filler is increased and the PET weight % was decreased.
(1) The Effect of Fiber, Matrix and Filler Loading on Compressive Strength. The compressive strength increased with fiber loading increased. Figures 11(a) and 11(b) shown that the compressive strength increased when the fiber loading is increased and decreased with increased weight % of PET matrix and filler.
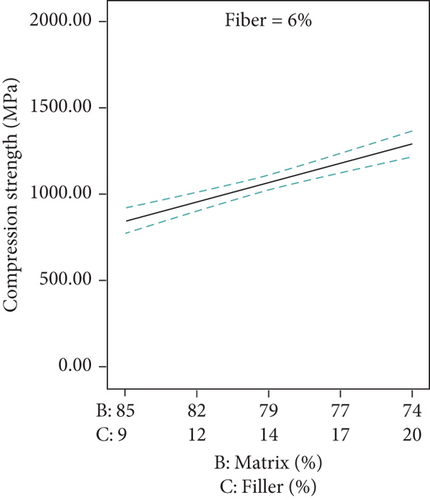
However, seen in Figure 11(c), the compressive strength is increased when the weight % of filler is increased concerning the weight % of the PET matrix because the filler is highly stiffer and rigid and then carrying maximum load than the PET matrix. Also, the filler is very fine (particle size is between 0.75 and 1 mm sieve size) so the ratio of the surface area is higher. Due to these, the filler reduced the thermal expansion and contraction, increased the stiffness, and reduced polymerization shrinkage of the PET matrix, and then strengthens the compressive strength of the composite. On the contrary, the weight % of the PET matrix is increased; it creates voids, and then, the interfacial adhesion between the filler and PET is not good, which leads to a decrement in compressive strength. Besides, fiber agglomerations happened thus causing dispersion problems in PET, which lead to a decrement in compressive strength [18, 24, 25].
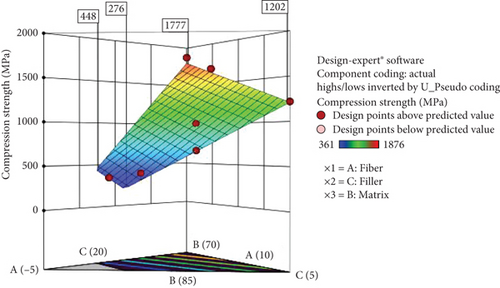
Figure 12 shows the effect of the weight % of fiber, PET matrix, and filler loading on compressive strength. The compressive strength is maximum at 10, 70, and 20 weights % of fiber PET matrix and filler loading, respectively. In general, the compressive strength is maximum when the weight % of fiber and filler is increased and the PET weight % was decreased.
3.1.3. Flexural Properties
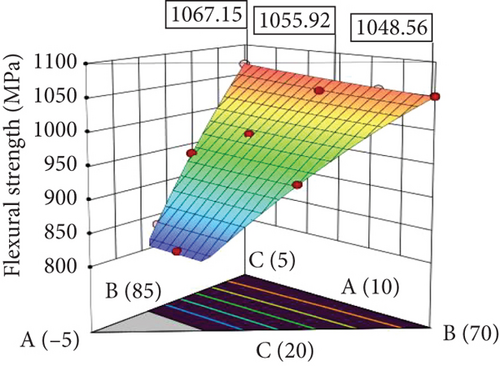
The flexural strength increased when fiber loading increased and decreased with PET matrix and filler proportion increased as shown in Figure 13. When the content of fibers is increased in the composite, the compatibility between the fiber and the PET matrix is decreased.
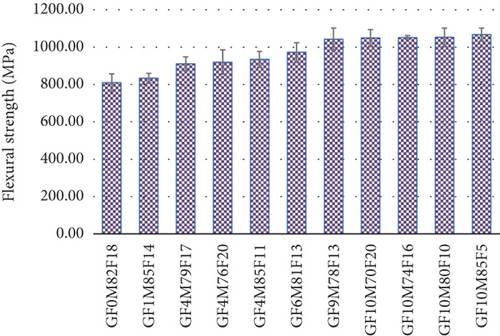
The flexural strength of the composite is maximum (1067.59 MPa) at 10 weight % of fiber, 85 weight % of matrix, and 5 weight % filler, respectively. On the contrary, the minimum (809.754 MPa) flexural strength when the weight % of fiber, matrix, and filler is 10, 70, and 20, respectively, was achieved (see Figure 13). As explained above, the reduction could be associated with poor dispersion of matrix in the fiber and fiber-to-fiber entanglements, and the maximum weight % of filler is used. The more the weight % of filler is associated with the stiffer and brittle property of the composite. As a result, the more the reduction to carry out the flexural loading [18, 27].
(1) The Effect of Fiber, PET Matrix, and Filler Loading on Flexural Strength. Figures 14(a) and 14(b) show that the flexural strength increased when fiber loading increased and decreased with PET matrix and filler proportion increased. The flexural strength of the composite increased linearly with fiber composition. An increase in fiber content from 0 to 10 wt% increases the flexural strength by about 24.15%. This could be due to more fibers being present on a given composite cross-section to carry the load at a higher fiber weight %.
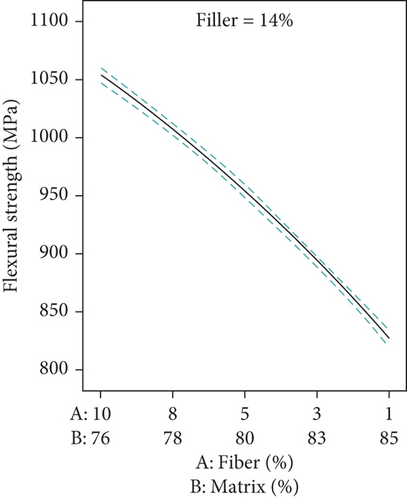
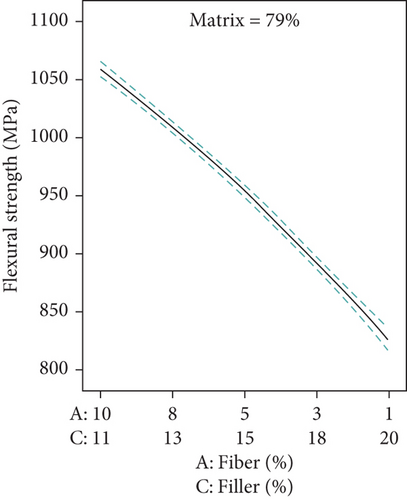
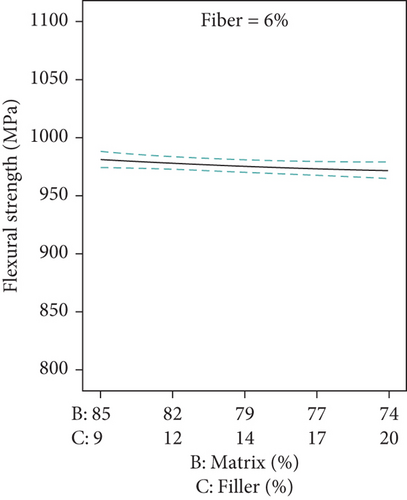
Figure 14(c) shows that the interaction (interfacial effect) between the matrix and filler on flexural strength. Here, the flexural strength is not changed (not significant) when the weight % of matrix and filler proportion is whether increased or decreased concerning one another because the filler is more brittle and stiffer and so it cannot be carried a maximum flexural loading [26]. However, a further increase in fiber content above the maximum value resulted in a lowering of flexural strength. The decrease in flexural strength at higher weight % of fiber loading is due to the increased fiber-to-fiber interactions and dispersion problems. Defect and fail when the stress initiated the defective cells as a result of stress concentration. Consequently, the fiber can withstand bending forces which comprise compressive forces and tensile stress [18, 24–26].
The flexural strength of the composite is higher at 10, 85, and 5 weight % of fiber, matrix, and filler, respectively. On the contrary, minimum flexural strength when the weight % of fiber, matrix, and filler is 10, 70, and 20, respectively (see Figure 15). As explained above, the reduction could be associated with poor dispersion of fiber in the matrix, fiber-to-fiber entanglements, and the maximum weight % of filler is used. The more the weight % of filler is associated with the stiffer and rigid property of the composite. As result, the more the reduction to carry out the flexural loading [18, 27].
3.1.4. The Microstructure of Composites
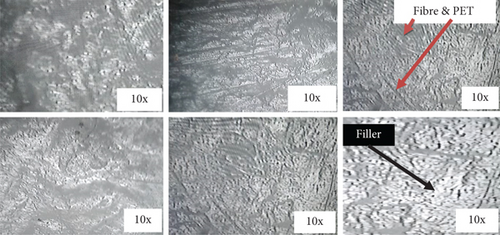
Six samples were selected from manufactured (eleven samples), and the microstructure of composite was seen. As shown in Figure 16, the fiber, PET matrix, and filler components are distributed uniformly. Glass fiber and crystalline PET matrix have opaque properties; due to these, it was a dark part on the microstructure and the white part on the optical microscopic (10x magnifications) image showed the filler which is window glass particles due to its translucent properties. Here, the more window glasses, the whiter surface is observed or detected and the more weight % of glass fiber and PET matrix has the darker surface which was observed or detected uniformly throughout the crystalline structure of composite [24–26]. Because the crystallinity of PET varies from amorphous to fairly high crystalline, poly(ethylene terephthalate) polyester (PETP) can be highly transparent and colorless but thicker sections are usually opaque and off-white. As PET degrades, its color changes, first to yellow then to brown, and finally to black. Virgin PET is transparent, and the reprocessed material shows an increasing coloring after each processing cycle. Chain scission leads to the formation of chromophore substances, which are difficult to isolate and are responsible for light absorption in the near UV and visible range. It was also observed that the material became opaque, probably because the decrease in chain length improves chain packing, increasing the crystallinity degree and crystal size [25, 26, 28].
4. Conclusions
In recent years, plastics (thermoplastics and thermosets) have been a dominant material for different applications, especially the society widely used for packing solid and liquid products. Among the thermoplastic polymer’s poly(ethylene terephthalate) (PET) used abundantly for water packing purposes as a bottle. After primary uses of the product, most of the developing countries face a shortage of postconsumer disposal waste sites and it became a very serious problem on environmental pollution. Waste plastics and glasses cause environmental pollution due to their nonbiodegradability. To mitigate this problem, the waste PET bottles can be reused or recycled into other products. Because of the contaminations, reuse may not be an attractive option but recycling into different products is more appealing. Recycling waste glass is also a good option but it requires energy to crush, melt, and reform or reshape. For this reason, regenerating and using the waste product as resources and prevent environmental pollutions are a greater concern.
This research was given an insight into other ways of recycling of waste PET bottles which will go a long way in preserving the environment and reducing the waste disposed to the landfills. Apart from the environmental issues, it is capable of providing employment opportunities in the collection and manufacture of composites. This also can provide business opportunities to companies in expanding their product line.
And as a conclusion, the results of this study showed that a useful composite with good properties could be successfully developed using glass fiber as a reinforcing agent and waste window glass as a filler and the recycled PET was as a matrix. From this, several conclusions can be drawn regarding the mechanical properties of the composite to the effect of fiber loading, filler loading, and PET matrix loading, namely, tensile strength, compressive strength, and flexural strength properties. To obtain optimum properties of composites, the weight % of fiber, PET matrix, and filler are 8, 72, and 20, respectively. The tensile strength of glass fiber reinforced PET matrix composites increased drastically up to the optimum level of fiber weight fraction, i.e., beyond these there is a leveling off on the tensile strength. At 10 weight % of glass fiber, 85 weight% of PET matrix, and 5 weight % of window glass filler we get maximum tensile strength and flexural strength which is 81.625 MPa and 1067.59 MPa, respectively. The maximum compressive strength is 1876.14 MPa when the weight % of glass fiber, PET matrix, and window glass filler is 10,70, and 20, respectively. Based on this, we can conclude that the tensile strength and flexural strength increased with increased weight % of glass fiber. The compressive strength increased with increased weight % of window glass filler.
The FTIR spectrum shows that there is a difference between the waste bottle PET and the recycled PET. Some of the groups have been removed from the recycled PET; this explains the brittleness of the recycled PET as compared to the waste bottle PET. This could be because of the reduction in PET molecular weight or chain length due to moisture absorption, contamination, oxidation, and thermal degradation. The factors that cause a reduction in physical, mechanical, chemical, and rheological properties of recycled PET also affect the brittleness of the recycled polymer and also make the recycled PET lose its melting elasticity behavior.
Finally, the implementation of this research will achieve two things: will clean the environment and will provide employment.
Conflicts of Interest
The authors declare that they have no conflicts of interest.
Open Research
Data Availability
All relevant data to the manuscript have been included.


