Machine Learning Theory in the Strategic Management of Regional Risk Factors Measurement
Abstract
Under the background of the state’s strong support for entrepreneurship, domestic small- and medium-sized enterprises ushered in the climax of development, but there are still crises coexisting with opportunities. According to statistics, most small- and medium-sized enterprises cannot survive the first three years of the initial stage of entrepreneurship. It can be said that risks exist all the time for enterprises. How to face the risk crisis and effectively avoid these regional risks has become an important factor for enterprises to survive for a long time. The accelerating pace of global economic integration has not only brought opportunities to enterprises but also brought challenges to the survival of enterprises. At present, there are few studies on regional risk in China and most of them are qualitative studies; there is no more specific quantitative study on risk factors. In view of this situation, this paper will study the quantitative evaluation model of regional risk factors based on machine learning. The development of this model adopts the method of support vector machine, which is a more commonly used risk assessment machine learning method. In order to better assess the risk, this paper also establishes a risk assessment index system, which classifies the factors of regional risk in detail and gives the specific evaluation method. Through the combination of modern technologies such as intelligent computing, semisupervised learning, and strategic center organization, the final model is established. After four risk prediction experiments including measuring the net profit margin of total assets of enterprise a, the data shows that the accuracy of the risk assessment model in this paper has been greatly improved compared with the traditional way and shows that the short-term prediction is higher than the long-term prediction and the overall prediction effect is relatively ideal, which can be applied to the practical management of regional risk prediction of enterprises.
1. Introduction
At present, with the further prosperity of the national economy and the continuous reduction in the entry threshold of enterprises, the development of domestic small- and medium-sized enterprises ushered in a new spring, i.e., many small- and medium-sized enterprises are springing up. As the main force of economic development and small- and medium-sized enterprises, the control of costs has always been the primary problem that plagues the sustainable development of small- and medium-sized enterprises. Therefore, the development of modern enterprises must solve the problem of enterprise cost management and control. Their development has become the main driving force for the sustainable development of national economy. In the 1980s, with the further acceleration of reform and opening up, China’s socialist market economy has gradually developed and improved. The 15th National Congress of the Communist Party of China proposed that the private economy, foreign joint venture economy, and individual economy should be regarded as an important part of the socialist market economy and the development of the nonpublic economy should be strongly supported. The 16th and 17th National Congress of the Communist Party of China further proposed that “we should standardize, guide and support the development of small- and medium-sized enterprises, so that small- and medium-sized enterprises become an important part of the socialist market economy.” At present, small- and medium-sized enterprises play an increasingly important role in the national economy of various countries and gradually become a booster to promote the development of the global economy. According to statistics, in developed countries, with the continuous development of science and technology, the contribution rate of small- and medium-sized enterprises to economic growth has reached 75%; in countries like the United States that advocate personal heroism, the contribution of small- and medium-sized enterprises to the national economy has exceeded 80%. The contribution rate of SMEs to GDP in China has reached 55%.
From the above data, it is not difficult to see that SMEs are playing an increasingly important role in China′s economic development. Small- and medium-sized enterprises have become an important driving force for the development of national economy, and their rapid development has become the main source of GDP growth, tax growth, and export trade growth. In addition, the rise and development of small- and medium-sized enterprises have greatly promoted the process of urbanization in China. However, with the continuous promotion of globalization and the spread of the subprime crisis, the competition in the domestic market has become more and more fierce; many small- and medium-sized enterprises have closed down in the financial crisis. In the face of all kinds of sudden attacks of risks and threats, enterprises can survive, effectively deal with all kinds of potential risks, avoid shocks, and ensure the long-term prosperity of their business, so risk management is particularly important. The research and application of risk management have been widely concerned and valued by enterprise managers. In practice, they realize that only by actively avoiding risks and reducing the losses caused by risks can they break through the waves and avoid risks in the fierce market competition. Although enterprise managers realize the importance of risk management and apply the concept of risk management and practical operation of production and operation, under the same objective conditions, different risk managers have significantly different abilities of identifying and analyzing risks and the factors such as knowledge and skills are totally different. Especially in the process of risk identification, as the primary link of risk management, different managers have different emphasis on risk identification. Whether an enterprise can fully and effectively identify potential risks will directly determine the effect of risk management and the success or failure of enterprise management. Therefore, risk identification is the key link to risk management and even the whole management. These factors directly affect the efficiency of enterprise risk identification. Only by accurately measuring these influencing factors can we improve the risk identification ability of enterprises.
At present, the research on regional risk of enterprises started late in China. Compared with foreign countries, the research in China is more focused based on qualitative research, but there are few models that can play a quantitative role. Therefore, this article aims to study the measurement of the influence factors of the enterprise′s regional risk by machine learning theory and hopes to establish a model to carry out quantitative research on the regional risk faced by the enterprise. First of all, this paper comprehensively expounds the definition of regional risk and the main regional risks faced by Chinese enterprises, including four risk elements including regional industrial structure and fields. Aiming at the regional risk factors, this paper establishes a risk evaluation index system, which aims to accurately provide data on the single factor of regional risk and then analyzes the specific risk coefficient through the evaluation criteria and the model. For the risk assessment model, this paper is based on the machine learning theory. Machine learning is a commonly used method for risk research abroad, which has the advantages of high accuracy and simple model establishment. Support vector machine is the main method of machine learning in this paper. Compared with other machine learning methods, it has obvious advantages. Through the combination of intelligent computing and semisupervised learning, the final model is formed. In order to verify the accuracy of the model, at the end of this paper, four experiments including available asset liability ratio, total asset net profit ratio, net asset return ratio, and total asset turnover ratio are carried out based on the reduction results of asset performance index data attributes of enterprise a. The data shows that the regional risk assessment model based on machine learning in this paper has good accuracy and has achieved ideal experimental results [1–3].
2. Core Concept of Regional Risk
2.1. Concept of Regional Risk
Regional finance refers to the spatial distribution of a country’s financial system and financial operation. The essence of regional finance is to study the specific object of finance in a specific regional economic discipline. Due to the imbalance of supply and demand of modern space resources, the development and operation of the financial industry must have regional imbalance. However, with the continuous development of market economy and the emergence of Internet financial instruments, following the physical flow of value has become the mainstream trend of social development and financial development is the main driving force of economic development. Since regional economic development largely operates depending on regional finance and coupling mechanism, regional economy and finance will be more complex. Exchange rate risks, interest rate risks, foreign exchange reserve risks, and liquidity risks and other macro-financial risks are different from micro-financial risks such as management risk, market risk, financial risk, and regional financial risks (also known as the regional risks faced by SMEs in this paper). There are more than two kinds of financial risks. Regional financial risk refers to the financial risk caused by the spread and diffusion of domestic financial risk in a specific economic system, which is mainly caused by the spread and diffusion of the individual or part of micro-individual risk system in the system, or the proliferation of other systems closely related to regional financial risks [4–6].
2.2. Main Regional Risks Faced by Enterprises
The regional risks faced by small- and medium-sized enterprises in China are mainly as follows.
2.2.1. Industrial Structure and Fields in the Region
In recent years, due to the economic downturn in Europe and the United States and the weakening of international demand, the domestic foreign trade industry is generally facing a more serious business crisis. At present, due to the outstanding credit risk, the Yangtze River Delta and Fujian are both regions with high dependence on foreign trade. Although Guangdong is also highly dependent on foreign trade, large-scale credit risk has not yet emerged. This is because since 2008, many small- and medium-sized enterprises in Guangdong have begun to reduce production scale and produce according to orders. These small- and medium-sized enterprises are unlikely to use private funds and bank loans for highly leveraged operations, so even if they fail due to operational difficulties, their impact on the financial industry is relatively limited. In addition, due to the increasingly severe smog in most parts of northern China, heavy pollution industries such as steel, coal, paper making, and chemical industries may be banned, and, the state has issued a series of measures to strengthen supervision and eliminate backward production capacity of polluting industries, which is undoubtedly worse for small -and medium-sized enterprises with weak technology. Some small- and medium-sized enterprises will eventually face the fate of elimination when they invest or transform.
2.2.2. Activity of Commercial Banks in the Region
The common problem of “financing difficult, financing expensive” is the face of small- and medium-sized enterprises in China, and cash flow is the lifeblood of enterprise development. Under normal circumstances, due to the fierce competition among commercial banks in the region, there are many banks, and the number of client projects for their own profit may be reduced; the bank’s credit funds for small and medium-sized enterprises may increase substantially. However, due to many factors such as information asymmetry, many banks often give credit lines to enterprises, which lead to high leverage ratio of enterprises. The most direct consequence of excessive credit expansion is the abuse of funds.
2.2.3. Private Lending Activity in the Region
In theory, if the private lending market in a region is active, the easier it is for enterprises in the region to obtain private funds and the more likely it is for bank funds to enter the field of private financing. From an economic point of view, private loans can often be an important source of financing for enterprises in the region, especially small and micro-enterprises, as well as the banking system. However, there are some risks in private lending, such as the source of funds is difficult to control, the flow of funds is unclear, the financial leverage rate is very high, and the security of funds cannot be guaranteed. In the economic downturn, when the credit resources of the whole society are generally tight, if private lending is involved, it is easy to break the capital chain.
2.2.4. Sensitivity of Investors in the Region
In the history of our country, many different business groups have formed in different areas. Even in modern times, this kind of regional business culture is very obvious. Different regions usually have different business concepts. It is found that the significant characteristics of Zhejiang businessmen’s risk are most of them prefer risk and are willing to take high risk in order to pursue higher interests. In recent years, driven by high profits, a large amount of private capital has been flowing out of Jiangsu and Zhejiang, leading to serious industrial hollowing out [7–9].
3. Regional Risk Assessment Model Based on Machine Learning
3.1. Risk Index Construction
With the rapid growth in data, machine learning is a new interdisciplinary subject. It simulates or realizes human′s learning behavior through the powerful function of a computer, so as to obtain new knowledge, reorganize the existing knowledge structure and technical skills, and constantly improve its performance. Based on the two categories of 26 indicators in Table 1, a series of basic classifiers (submodels) with regional risk assessment capability are generated by combining machine learning theory with model construction. Then, through the model integration of submodels with different risk assessment capabilities, the assessment effect of the model will be enhanced [10, 11].
| First-level indicators | Secondary index | Expected symbol |
|---|---|---|
| Macroeconomic indicators | GDP growth rate | — |
| Proportion of GDP of the primary industry | + | |
| Growth rate of financial expenditure | — | |
| Growth rate of fixed assets | — | |
| Dependence on foreign trade | + | |
| Proportion of loans to GDP | + | |
| Deposit growth rate | — | |
| Loan growth rate | — | |
| Leverage ratio of bank financing | + | |
| Unemployment rate | + | |
| Real estate price index | + | |
| Media-oriented emotional index | — | |
| Netizens’ mood | — | |
| Internal indicators | Loan growth rate | + |
| Overdue rate | + | |
| Proportion of noninterest income | + | |
| Loan to asset ratio | + | |
| Number of users of small and micro-business loans | + | |
| Proportion of regional sales of financial products to total sales | — | |
| Cost income ratio | + | |
| Ratio of net assets to income | — | |
| Capital adequacy ratio | — | |
| Pull-out coverage | — | |
| Number of mobile terminals participating in internet investment and financial management | — | |
| Average loan term of the mobile terminal | + | |
| Customer voice sentiment index | — | |
3.2. Index System Variable Interpretation
We will guard against systemic risks in the financial sector, comprehensively deepen financial reform, orderly advance the reform of the joint-stock system, and improve the market-oriented exit mechanism for financial institutions and enterprises. If an enterprise is on the verge of economic bankruptcy for a long time, it will gradually be legalized for bankruptcy reorganization or disposal. In this paper, economic bankruptcy is defined as a virtual variable and the phenomena studied include the occurrence and nonoccurrence of bank regional risk. In order to carry out regression analysis, Yit is set as a dummy variable, in which i represents the individual and t represents the time. When this phenomenon occurs, Yit is taken as 1, otherwise 0. Since the probability of the event is between 0 and 1, an unobservable variable Zit is introduced to replace Yit. When Zit is greater than 0, Yit is taken as 1, otherwise 0 [12–14].
3.3. SVM-KNN Model
- (1)
The SVM algorithm adopts the strategy of interval maximization rather than the strategy of empirical risk minimization.
- (2)
The computational complexity of SVM algorithm depends on the number of support vectors, not the dimension of sample space. Using kernel technology, we can get a nonlinear SVM classifier.
The basic idea of nonlinear support vector machine problem is to transform the linear nonseparable problem of sample space into the approximate linear separable problem of feature space through nonlinear mapping and then to solve the classification surface with the maximum range in feature space. Moreover, the dual problem only involves the inner product operation between samples; that is, only the inner product operation in the feature space is needed. By using the kernel technique, we can get their inner product values in the feature space without knowing the nonlinear mapping function.
- (1)
The convex quadratic programming problem corresponding to SVM is constructed and solved, and the optimal solution α∗ is obtained as follows:
(5) - (2)
Calculate b as follows:
(6) -
where .
- (3)
Obtain the decision function as follows:
(7)
Support vector machine is mainly used for data classification and pattern recognition. It can predict the classification label by extracting the model describing the data class.
3.4. Distribution Estimation Method
Intelligent calculation is a new type of calculation method in which computer machines simulate the laws of nature to analyze and solve problems. Typical intelligent algorithms include genetic algorithm, ant colony algorithm, particle swarm algorithm, immune algorithm, neural network, etc. This system mainly involves the optimization of the distribution estimation algorithm in the intelligent computing algorithm, which is widely used in the optimization of model parameters. These lines are described in detail as follows [18–20].
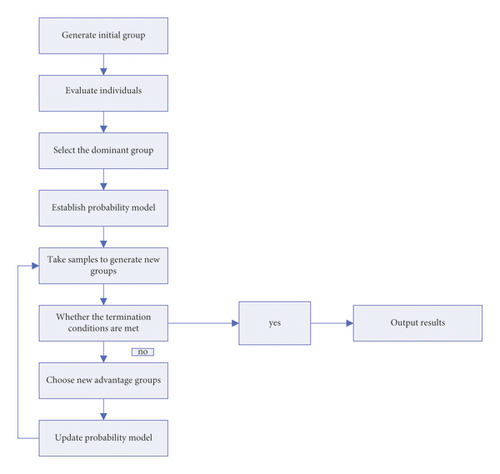
Distributed estimation algorithm (EDA) is a kind of computation method which combines evolutionary computation and statistical learning. It directly establishes a mathematical model for the whole group and establishes good personal information for a better individual through statistical analysis, based on the current population probability distribution model, and then the next generation solution achieves population development through sampling and so on. After repeated statistical modeling and sampling process, the optimal solution of the problem is obtained. EDA has good global search ability.
- (1)
The first generation of medium-sized population was randomly produced in the feasible region.
- (2)
According to the fitness function, the fitness value of each individual is calculated, and according to the specific selection methods (such as rotation selection and sorting selection), the dominant groups with strong fitness are selected. Through the method of mathematical statistics, a new population sample is selected and a population probability model is established.
- (3)
The new species are selected by probability model sampling, the fitness value of new individuals is calculated, the new dominant population is selected, and step d is performed to guide the new species to meet the convergence or termination conditions.
- (4)
Update the probability model and return to step (3).
- (5)
Repeat step (3) and step (4) until the algorithm converges.
The core of EDA is to determine a good probability function which accords with the optimal parameter distribution. When multiple parameters to be optimized are independently correlated, a single variable probability function is established for each parameter. When the parameters to be optimized are correlated, the probability function that conforms to the optimized parameter distribution should be the multivariate joint distribution function. Therefore, when we use EDA algorithm, we must have enough knowledge and experience to solve problems and establish appropriate models to solve specific problems. The advantage of EDA is that it can use the probability graph model to model variables with correlation. In the optimization of multivariable parameter problems, the solution of EDA is closer to the global optimal solution. And, the algorithm is faster [21–23].
The flow chart of standard EDA is shown in Figure 1:
In this paper, we will use the distribution estimation algorithm to optimize the C1 and C2 parameters in the SVM model and find the most suitable parameters for financial data.
3.5. Risk Index Construction
The training sample points of supervised learning include sample input and corresponding output information. Unsupervised learning training sample data only contains sample input, not sample output. Semisupervised learning uses both input data and output data, and only input data is used for training and learning. The main idea of this paper is to use supervised learning classifier to obtain the judge’s class number without class number data and then add the new label’s data + class number to the training set, so as to train the knowledge of the marked data and unmarked data contained in the classifier [24–26].
-
Input: marked training sample set A, unlabeled training sample set B, feature set C, self-training times D, sample confidence threshold E
-
Output: final classifier
-
For = 1,2,3, …, D
-
The labeled training sample set A is used to train the classifier F on the feature set C.
-
The classifier L is used to predict that all samples w without class labels belong to W and calculate their confidence EI.
-
Adding samples with confidence greater than threshold to the training marked as sample set A
-
End
Semisupervised learning theory has a broad application prospect in text classification, image content retrieval, and image and video tag fields.
3.6. Operation Steps of Risk Early Warning
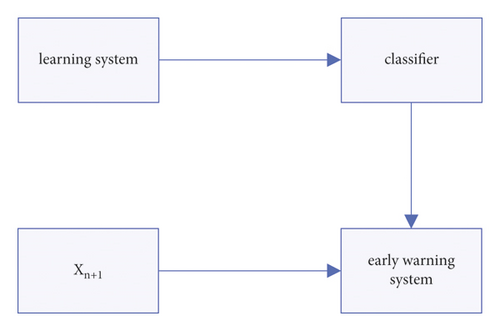
The ultimate purpose of risk early warning is to predict whether an enterprise is in a normal state or in a risk state according to its business data. In this paper, the vector x is used to represent the early warning characteristic variable and y is used to represent the state of the enterprise. The process of risk early warning is to find the function mapping between x and y. Although the mapping function between index variable x and output variable y lacks the support of the specific theoretical model, we can use machine learning technology to adapt to the mapping function based on enterprise historical data [27, 28].
Therefore, the risk early warning system is essentially a binary classification system of normal and abnormal data classification of the company, which is a supervised learning system. System learning data is information collected about the boss’s company. The formalization of the company’s risk early warning system is shown in Figure 2.
- (1)
Select training samples and test sample data.
- (2)
Early warning features are selected according to the features of the original data.
- (3)
According to the feature selection method and data preprocessing method, the features of the final warning model are obtained.
- (4)
Establish the early warning model. With different early warning models, the complexity of the model is different, the prediction results are different, and the generalization ability of the model is also different.
- (5)
According to the evaluation results, the optimal model is selected as the final early warning model.
3.7. Strategy-Centered Organization
This paper adopts the strategy of strategy-centered organization—the winning strategy of balanced scorecard. This strategic management approach balances financial and nonfunctional aspects, internal and external factors, results and drivers, and long-term and short-term performance indicators. Strategy-centered organizations are different from other general organizations because they can systematically describe, measure, and manage strategies [29, 30].
- (1)
Mobilization: senior leaders push for change
-
The first task of a strategy-centered organization leader is to make all employees feel the necessity of the strategy and the changes necessary to realize the strategy. Once the strategic change process has been initiated, the senior management team needs to initiate a governance process to guide the transformation process. The governance process identifies, communicates, and enhances new cultures and values.
- (2)
Transformation: turning strategies into practicable actions
-
Without a clear description of the strategy, it is impossible to determine the measurement strategy in a targeted way, that is, to develop a balanced scorecard and to ensure the full implementation of the balanced scorecard. Strategic maps and balanced scorecards provide tools to describe how shareholder value can be created through intangible assets. By transforming the strategy into a logical strategy map and balanced scorecard, the organization can make all business units and employees realize a unified understanding of the strategy [31, 32].
- (3)
Synergy: make the organization coordinate around strategy
-
In order to give full play to the reasonable coordination of 1 + 1 > 2, it is necessary to break the traditional internal coordination barriers and make the strategies of all units closely linked and coordinated. Strategy-centered organizations can break this barrier. The organization should coordinate with each business unit and department through the interrelated balanced scorecard, give full play to the rationality of the organization, and promote the implementation of the strategy.
- (4)
Motivation: making strategies for everyone’s daily work
-
The successful implementation of the strategy depends on the active contribution and joint efforts of every employee in the organization. Therefore, a strategy-centered organization needs to make all employees understand the strategy correctly through strategic communication, goal decomposition, and motivation, so as to ensure that the daily work can focus on the strategy [33].
- (5)
Control: make strategy a continuous process
-
First, the organization should link strategy to the budgeting process. The organization needs two budgets, the strategic budget and the operational budget. There is a fundamental difference between the two budgets. The balanced scorecard should ensure that long-term action plans are not affected by short-term tasks and can be implemented. The budget process should also ensure that long-term action plans are financially supported and not subject to short-term performance pressures. Second, establish a strategic review meeting and design an information feedback system to support this process. Finally, with the application of scorecard in action, the organization should test the strategic hypothesis, learn from the implementation, and update the organization’s strategic priority and scorecard according to the actual situation.
4. Effect Analysis of the Risk Prediction Model
4.1. Experimental Sample
The experimental data is the index data of state-owned enterprises listed companies from the national Tai’an data service center. According to the reduction results of the data attributes of enterprise asset performance indicators, the regional risk of enterprise can be predicted by four indicators: asset liability ratio, net profit ratio of total assets, return ratio of net assets, and turnover ratio of total assets.
4.2. Index Analysis of Asset Liability Ratio
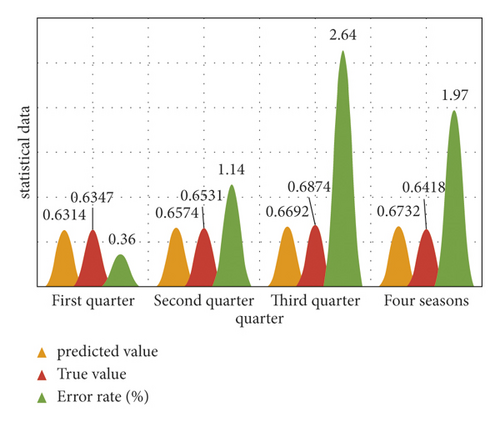
From the balance sheet forecast error table in Table 2 and the balance sheet analysis chart in Figure 3, it can be seen that as the balance sheet ratio is tailored to meet the characteristics of stable sequence, it is suitable for this model. According to the AIC criterion, the model order p = 3 is obtained and the maximum likelihood parameter estimation method is used. The estimated parameter value is x = −0.0175 and y = 0.0148, where the value of the logarithmic objective function of the maximum likelihood estimation method is 59.786. After the model test, the standard deviation of the residual vector is 0.0496. The hypothesis is tested, and the model is correct. Based on the model analysis, the asset liability ratio of the predicted value in the four quarters of 2017 is consistent with the observed value in the database and Table 2. The negative error rate shows that the predicted value is consistent with the estimated value of the actual value.
| Quarter | Predicted value | True value | Error rate (%) |
|---|---|---|---|
| First quarter | 0.6314 | 0.6347 | 0.36 |
| Second quarter | 0.6574 | 0.6531 | 1.14 |
| Third quarter | 0.6692 | 0.6874 | 2.64 |
| Fourth quarter | 0.6732 | 0.6418 | 1.97 |
4.3. Analysis of the Net Profit Index of Total Assets
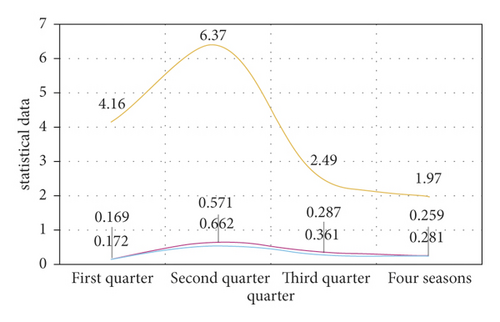
It can be seen from the prediction error table of total asset net profit index in Table 3 and the net profit analysis curve in Figure 4 that the data sequence of total asset net profit rate meets the requirements of stable sequence. It can be seen from the observation that the net profit of the total assets of the enterprise is traceable, so the net profit rate of the total assets conforms to the sequence characteristics. The minimum value of AIC function at p = 2 is −146.16. The maximum likelihood estimation method is used to estimate the parameters of the sequence model, and the parameter x is 0.4317. The standard deviation of the residual vector is 0.0632. Through the test of the model, the model analysis in this paper is correct. The error between the predicted value and the actual estimated value is small and the accuracy is high.
| Quarter | Predicted value | True value | Error rate (%) |
|---|---|---|---|
| First quarter | 0.172 | 0.169 | 4.16 |
| Second quarter | 0.662 | 0.571 | 6.37 |
| Third quarter | 0.361 | 0.287 | 2.49 |
| Fourth quarter | 0.281 | 0.259 | 1.97 |
4.4. Index Analysis of Return on Net Assets
According to the prediction table of return on the equity index in Figure 4 and the analysis chart of return on equity in Figure 5, the data sequence of return on the equity index meets the requirements of stable sequence and the sample sequence of this index meets the characteristics of the sequence. According to the AIC criterion, p = 2. In parameter estimation, maximum likelihood estimation is used to get parameter x = 0.3864. The standard deviation of the residual vector is 0.0762. If the hypothesis is accepted, the model is established. Comparing the predicted results with the actual values, the error is small, which is consistent with the autocorrelation and partial correlation, indicating that the model in this paper has better prediction ability.
4.5. Index Analysis of the Turnover Rate of Total Assets
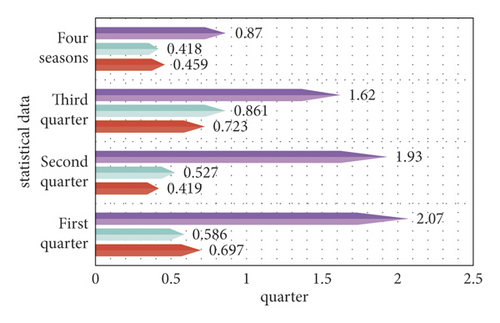
According to the prediction error table of total asset turnover rate in Table 4 and the analysis chart of total asset turnover rate in Figure 6, it can be seen that the relevant characteristics of total asset turnover rate do not meet the requirements of stable series but meet the requirements of nonstationary time series. Therefore, the index is processed by ARIMA (p, d, q) sequence. After the difference, the autocorrelation function and the partial correlation function are recalculated and the characteristics of the corresponding coefficients are also stationary sequences, with d = 2. Then, ARMA (p, q) is used for sequence analysis, and the AIC criterion is used to determine the sequence. When p = 5 and q = 7, the minimum value of AIC function is −42.13. According to the maximum likelihood estimation method, the standard deviation of the residual vector is 0.0654, building the model of this paper. The difference between the predicted value and the measured value is not significant, which shows that the prediction accuracy of the model is high.
| Quarter | Predicted value | True value | Error rate (%) |
|---|---|---|---|
| First quarter | 0.697 | 0.586 | 2.07 |
| Second quarter | 0.419 | 0.527 | 1.93 |
| Third quarter | 0.723 | 0.861 | 1.62 |
| Fourth quarter | 0.459 | 0.418 | 0.87 |
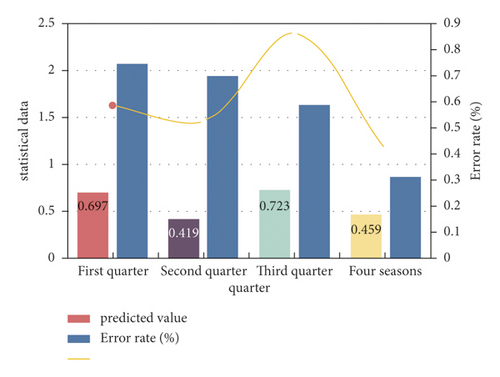
It can be seen from the predicted values of the four indicators of the company in the four quarters of 2017 that the predicted results of each indicator obtained through the model analysis in this paper are relatively close to the actual values. Especially when using the model in this paper to estimate the prediction value of the index at a relatively near time, the error rate is low. If the prediction time of index value is long, the error rate is high. The results show that the model analysis method is more accurate than the long time prediction.
5. Conclusions
Based on the systematic review of regional risks and the main regional risk factors faced by enterprises, this paper preliminarily analyzes the enterprise risks. It is believed that it is of great significance for enterprises to evaluate regional risk accurately and manage risk strategy timely and effectively, which is related to the survival and development of enterprises. In order to further study the risk assessment, this paper, based on the research at home and abroad, establishes the corresponding enterprise regional risk factor evaluation index system. The establishment of the system has a guiding role in the follow-up risk assessment. For identifying risk factors, this paper establishes an evaluation and prediction model through the current more advanced machine learning method. This model has the characteristics of autonomous learning and continuous upgrading and intelligence and is one of the more advantageous methods in the risk assessment model.
Conflicts of Interest
The authors declare no conflicts of interest.
Open Research
Data Availability
No data were used to support this study.


