The Mean First Passage Time of the Stochastic Resonance Driven by Dual-Sequence-Frequency-Hopping Signal and Noise
Abstract
The mean first passage time (MFPT) represents the dynamic characteristic of stochastic resonance (SR). The study focuses on how can the Dual-Sequence-Frequency-Hopping (DSFH) signal influence the MFPT and any difficulty in solving the MFPT problem considering the DSFH signal. In this current study, the SR system driven by DSFH signal and Gaussian white noise is described with the parameters of the signal amplitude, the frequency of Intermediate Frequency (IF) of the receptive DSFH signal, the SR system parameter, scale transformation coefficient, the noise intensity, and the sampling multiple, firstly. Secondly, under the assumption that MFPT is small aqueous about the domain of 0, the nonautonomous differential equation with MFPT is transformed to a nonhomogeneous differential equation with one unknown variable coefficient of second order. Finally, the numerical solution of MFPT can be obtained by the method of Runge–Kutta. Theoretical and simulation results are shown as below: (1) the effect of the signal amplitude, the IF frequency, the noise intensity, the SR system parameter, and the scale transformation coefficient, for decrease the MFPT, are positive; however, the effect of the sampling multiple is negative; (2) the MFPT cannot follow the dynamic period of the SR controlled by the IF frequency, when SNR is low; (3) when SNR = −12 dB, the sampling multiple is 200, the IF frequency is 2100, and the duty cycle reaches 25% (available for DSFH signal detection with peek or valley decision Liu et al. (2019)), so we need to decrease the IF frequency or increase the SNR for further availability.
1. Introduction
The Dual-Sequence-Frequency-Hopping (DSFH) communication mode draws lessons from “the medium is the message” [1, 2]. Its typical character is that the message is modulated in the radio frequency, which is the hopping frequency controlled by the PN sequence. When the symbol 1 is transmitted, the hopping frequency controlled by PN 1 is transmitted. And when 0 is transmitted, the hopping frequency controlled by PN 0 is transmitted. The radio frequency of DSFH is combined by hopping frequency controlled by PN 1 and PN 0. The chosen medium is the communication channel; meanwhile, the unchosen one is the dual channel controlled by two PN sequences representing the symbol 0 or 1. Then, the receptive symbol is decided by whether the channel is occupied or not [3–5]. Due to the character of DSFH, the receptive signal of DSFH is a sinusoidal signal that is the typical input signal of stochastic resonance (SR). And the DSFH processed by stochastic resonance (SR) can work under strong color noise as a military emergency communication mode [6, 7]. SR is a nonlinear physical phenomenon that goes against the conventional concept that noise is always harmful for signal detection. Noise can enhance the detection performance of nonlinear SR systems when the signal, noise, and the SR parameters are matched. The SR theory is first proposed in the research of the earth glacier by Benzi et al. [8] and then demonstrated in physics, biology, and electronics [9–12]. And the application of the SR to signal procession is reviewed and discussed [13]. However, SR has a dynamic nature as a nonlinear system. The signal processing needs a steady state of the SR, not a dynamic one. So, when it is applied to signal detection, the researchers must ensure that the output of SR is already steady at the signal decision time during the bit period of DSFH. In other words, the SR system particles are jumping in some well instead of between wells at the decision time.
The mean first passage time (MFPT) is used to describe the dynamic characteristic of SR. The MFPT is defined as the time that a walker or a particle spends before crossing a given position for the first time [14]. As for the MFPT, most researchers mainly focus on the relationship between noise and the SR system. Guardia and San Miguel firstly study the escape time of bistable SR caused by multiple and additive Gaussian noise and obtain the analytic expression of MFPT related with potential function and noise intensity [15], which initiates the research of MFPT. Kang researches the MFPT in underdamped bistable Duffing oscillator [16] and the phenomenological gene transcriptional regulatory model [17] by the method of moments and the period steady solution of Fokker–Planck equation (FPE). Wang studies the MFPT in the Levine model, focusing on the white and color noise in the biological population system [18, 19]. Xu and Jin studies the MFPT in the tristable SR driven by correlated multiplicative and additive white noises [20, 21]. However, most research studies focus on the effect of MFPT caused by the SR system and noise. The adiabatic elimination theory is mostly used to obtain the MFPT with the assumption that the signal amplitude and frequency are small. And there has been no result which can be used to analyze the influence caused by the input signal frequency so far.
When the DSFH signal is considered in the MFPT problem, the nonautonomous item caused by the time-vary signal is introduced in the differential equation related to MFPT, which causes many difficulties in solving the MFPT. Aimed at solving this problem, we assume that MFPT is small aqueous about the domain of 0 based on the experience of communication signals detection and simulation results. And we try to research the relationship between MFPT and the DSFH signal, noise, and SR system. The paper is structured as follows. In Section 2, the SR system driven by DSFH signal and Gaussian white noise is described. In Section 3, the MFPT affected by DSFH signal and Gaussian white noise are analyzed, and the nonhomogeneous differential equation with MFPT of second order is solved with the method of Runge–Kutta. In Section 4, the relationship between MFPT and the DSFH signal, noise, and SR system is discussed in the theoretical and simulation view. Conclusions are given in Section 5.
2. The System Model of the SR Driven by DSFH Signal and Gaussian White Noise
2.1. The Transmitted Signal of the DSFH
The communication and dual carrier controlled by PN sequences are chosen by the transmitted symbol in the DSFH mode and described as Figure 1.
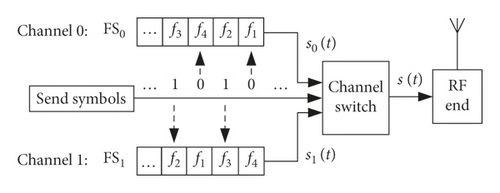
Channel 0 and 1 are, respectively, the carrier f0,n and f1,n controlled by PN sequences FS0 and FS1. When the send symbol is 0, the carrier f0,n controlled by PN sequences FS0 is transmitted. When the send symbol is 1, the carrier f1,n controlled by PN sequences FS1 is transmitted. At the time of t, the sine carrier s0(t) with the frequency of f0,n is transmitted if the transmitted symbol is 0. Otherwise, the sine carrier s1(t) represented of symbol 1 is transmitted. Furthermore, the signals s0(t) and s1(t) are sinusoidal. The final transmitted signal s(t) of DSFH is the combination of the s0(t) and the s1(t), after the channel switch.
2.2. The Receptive Signal of the DSFH
The superheterodyne receiver is adopted in the DSFH mode, as depicted in Figure 2.
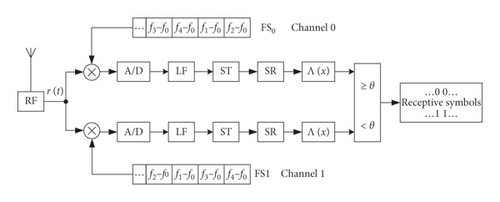
Noting that, in the DSFH system, the signal is just exit in one branch and the other branch is zero at the same time.
Due to the superheterodyne reception and the special modulation of DSFH, the received signal of the DSFH is the simple sinuous signal, which is the typical input signal of SR. With the reason that the f0 and the sampling rate fs are set as 1 kHz and 200 kHz, the IF signal can be viewed as low-frequency signal, which can be processed by low-pass filter (LF). In the DSFH communication system, part information of the received signal such as the frequency is known in the reception end. So, we can design the LF based on this. Then, the scale transact unit (ST) completes the parameters of IF signal to fit the demand of SR.
When the receptive signal is deciding, the output of SR must be already steady. So, we need to analyze the dynamic characteristic of SR driven by the receptive signal of DSFH and Gaussian white noise.
2.3. The SR Processing of the Receptive Signal
So, the frequency scale transacted equation is ω0/a = 2πf, where the frequency is transacted to the 1/a times of the original. The amplitude scale transacted equation is . When the parameter of a is large enough and b is small enough, the large IF signal can be transacted to small signal after ST. At the same time, the noise intensity becomes .
Next, we will analyze the MFPT with time-vary item of equation (6).
3. The MFPT Influenced by DSFH Signal and Gaussian White Noise
3.1. The Nonautonomous Effect of MFPT Caused by a Time-Vary Input Signal
Next, we emphasize on the nonautonomous item and obtain the solution of T(x).
3.2. The Solution of MFPT with the Transaction from Autonomous Item to Nonautonomous One
The output of SR and the sketch of MFPT are described in Figure 3. We can see that the SR system reaches a steady state quickly in one period. The transaction between wells is so quick, that is, the MFPT is much smaller than the period.
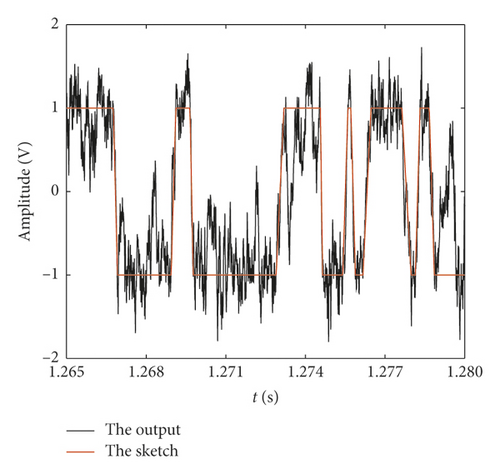
So, we can obtain the numerical solution of T(x)with the method of Runge–Kutta.
The form of the differential equation drifted by sine wave is the same with the one drifted by cosine wave. The drift effect caused by the cosine wave is the same as the sine wave demonstrated in the mathematical analytic form.
4. Simulated Analysis
In this section, we set the optimal parameter of SR drawing lessons from the optimal matching SR and statistics for the first passage time of the particles jumping from one well to the other as the simulation results in the Simulink model. And we will analyze the theory and simulation in three aspects. (1) Parameters of a and b of the SR system and the scale transformation coefficient , which represent the intrinsic system nature together. (2) The signal amplitude A and the signal frequency f0 of the receptive signal of DSFH. (3) The noise intensity D and the multiple sampling R.
4.1. The Relationship between MFPT and Signal Amplitude A
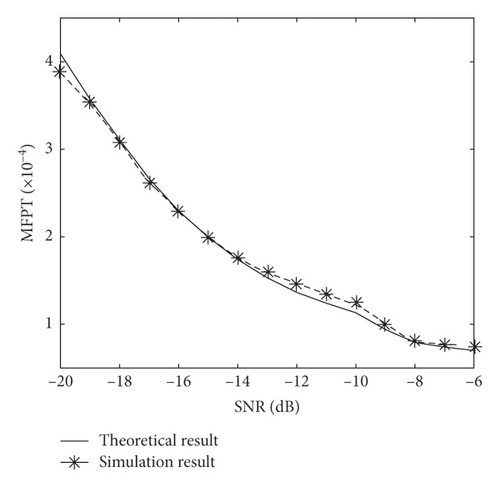
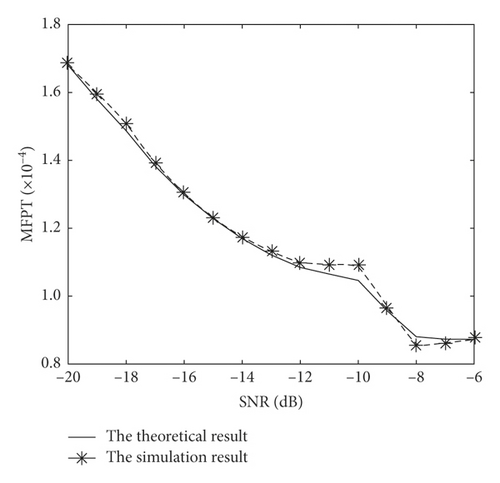
The theoretical and simulation results of the MFPT varying with A are described in Figure 4. We can see that the MFPT decreases as the SNR increases no matter in theoretical or simulation curve. This is because that when the signal frequency f0, sampling multiple R, and noise power σ2 (corresponding to noise variance) are constant, the frequency scale transformation a (one of the parameters of the SR system) and noise intensity D is constant. So, the three factors listed above which can affect the particles to jump vary as follows: the scale transformation coefficient and signal amplitude A increase, while the noise intensity D is constant as the SNR increases. And the scale transformation coefficient representing the system characteristic can promote the particles to jump between wells in the intrinsic nature of the SR system. Furthermore, the signal can pull the particles to jump between wells in external factors. So, it is more conducive to particle transitions that and A are increase, and that is why MFPT decreases as the SNR increases.
4.2. The Relationship between MFPT and Noise Intensity D
The theoretical and simulation results of the MFPT varying with D are described in Figure 5. We can see that the MFPT decreases as the SNR increases no matter in theoretical or simulation curve. Because when the signal frequency f0, sampling multiple R, and signal amplitude A are constant, the frequency scale transformation a is constant. So, the three factors listed above which can affect the particles to jump vary as follows: the scale transformation coefficient increases and the noise intensity D decreases, while signal amplitude A is constant as the SNR increases. And representing the system characteristic can promote the particles to jump between wells in intrinsic nature of the SR system. Furthermore, the noise can pull the particles to jump between wells in external factors. So, increase has a positive effect on the decrease of MFPT, while D decrease has a negative effect on the dynamic characteristic of SR leading decrease of MFPT. And the overall effect depends on the relative result caused by system and noise. Furthermore, the MFPT decreases when the system parameters and noise intensity are listed in our experiment.
4.3. The Relationship between MFPT and Sampling Multiple R
The theoretical and simulation results of the MFPT varying with R are described in Figure 6. We can see that there are two results. One is that the MFPT increases as the R increases when SNR is constant no matter in the theoretical or simulation curve. Because when SNR, f0, A and σ2 are constant, the parameters a, are constant, and D decreases with the increase of R. So, the positive effect for transaction bring by noise decreases becomes weak as the increase of R, leading the increase of MFPT. The other result is that the MFPT decreases as the SNR increases when R is constant no matter in the theoretical or simulation curve. Because when f0, R, and σ2 are constant, the parameters a and D are constant, while and A increase with increase of SNR. The effect caused by and A are all positive. So, the MFPT decreases. Furthermore, the bigger the R which leads higher quality of A/D converter, the worse the MFPT. However, the SR system vibrate needs a certain R, so for the dynamic system performance, we should decrease R meeting the demand of SR vibration as possible.
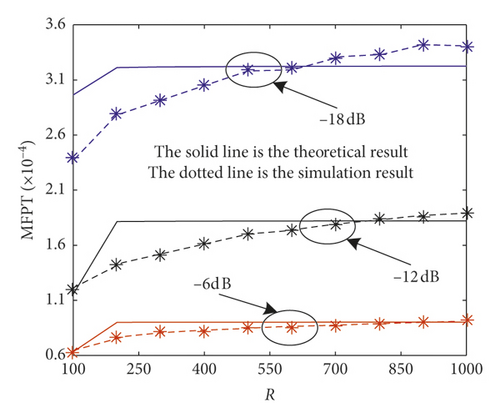
As a reminder, the bigger the T(x), the bigger the error between theoretical and simulation for a constant SNR, which also verify our assumption that the smaller the T(x), the more accuracy of the Taylor expansion to the cos(ωT(x) + ϕ) with the whole of ωT(x). And different SNRs need different system parameters a and b, so the error between theoretical and simulation at different SNRs is mainly due to the system characteristic.
4.4. The Relationship between MFPT or Duty Cycle and the IF Frequency f0
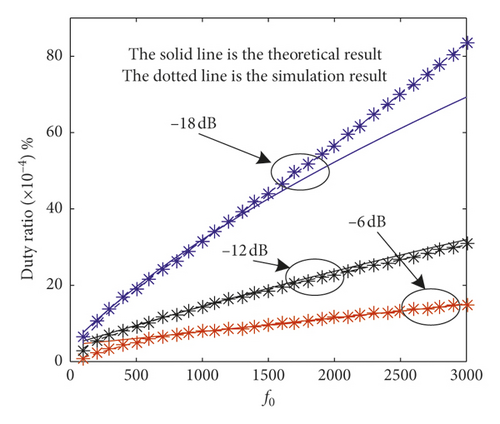
The theoretical and simulation results of the MFPT varying with f0 are described in Figure 7(a) and the duty cycle varying with f0 are described in Figure 7(b).
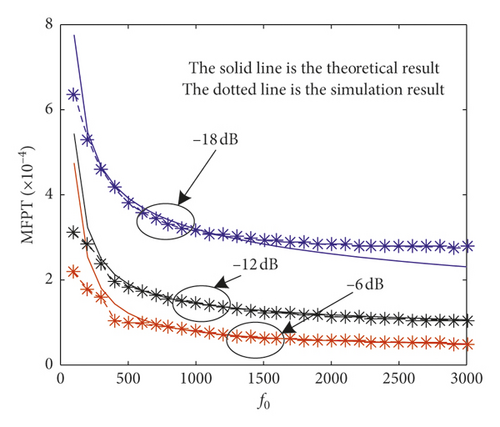
Two results are shown in Figure 7(a). One is that the MFPT decreases as the increases when SNR is constant, no matter in the theoretical or simulation curve. This is because that when SNR, R, A, and σ2 are constant, the parameters a and D decrease with the increase of f0. The overall effect of the positive one for transaction caused by system parameters and a negative one for transaction caused by noise is positive, leading to a decrease of MFPT. The other one is that the MFPT decreases as the SNR increases when f0 is constant no matter in the theoretical or simulation curve. This is because that when f0, R, and σ2 are constant, the parameters a and D are constant, while and A increase with increase of SNR. The effect of and A are all positive. So, the MFPT decreases.
In Figure 7(b), we give the normalization of MFPT as f0 varies. Because the output of SR has a distinct periodic characteristic that reflects the frequency of the input signal, the normalization is the duty cycle which is T(x)/T0 and T0 = 1/f0. We can also see two results. One is that the duty cycle increases as the f0 increases when SNR is constant no matter in the theoretical or simulation curve because the period of the SR system at constant SNR mainly depends on the input signal period. And its periodicity can react quickly following with the input signal. However, the MFPT reacts slower than periodicity, which leading the result that the duty cycle increases as the f0 increases when SNR is constant. And the parameters of SR varies more, following the f0.
Furthermore, the tracking performance of SR following the f0, which explains why the SR system is limited to be applied to communication systems with f0 varying. That is to say when SNR is low, the MFPT cannot follow the dynamic period of SR controlled by the f0. The other result is that the duty cycle decreases as the SNR increases when f0is constant in the theoretical or simulation curve. The reason is the same to the one in Figure 7(a), so there is no more detailed description. And related to the sample frequency, the frequency of the received signal locates at the low region of the frequency band, which can be processed by SR.
5. Conclusion
MFPT can represent the dynamic characteristic of SR, and the effect on MFPT caused by the DSFH signal is studied in this paper. Based on the assumption that MFPT is small aqueous about the domain of 0, the nonautonomous differential equation with MFPT is transformed to a nonhomogeneous differential equation with one unknown variable coefficient of second order. The numerical solution of MFPT is obtained by Runge–Kutta. The quantitative relationship between MFPT and DSFH signal, noise, and parameters of SR is obtained. Furthermore, the conclusion that “when SNR = −12 dB, R = 200, and f0 = 2100, the duty cycle reaches 25% (available for DSFH signal detection), so it is suggested to decrease the IF frequency f0 of the receptive DSFH or increase the SNR for further availability.” The research method illuminates the way of effect on MFPT caused by input signal. Furthermore, the conclusion provides reference for the dynamic characteristic and signal detection of the SR system driven by the DSFH signal and Gaussian white noise.
Conflicts of Interest
The authors declare that there are no conflicts of interest regarding the publication of this paper.
Open Research
Data Availability
The data used to support the findings of the study are available from the corresponding author upon request.


