Study of a Space-Time Monitoring of High-Speed Railway Underline Structure Using Distributed Optical Vibration Sensing Technology
Abstract
The phenomenon of vibration is quite frequent in various engineering works. Vibration analysis and monitoring occupy a significant place in scientific measurements and engineering applications. The quality of the underline structure actively influences the response of high-speed railway track plate and trackside. Due to years of service and under the action of train loads, bond failure between supporting track plate and cement asphalt mortar layer will imminently occur. And this will significantly influence the vertical dynamic response of a track slab and severely affect the safe operation of the entire railway system which can subsequently lead to a risk of derailment. Firstly, the purpose of the present study is to develop a practical 2D dynamic interaction model of vehicle-track subgrade based on a two-step simulation capable of analyzing the dynamic response of a track slab under different fault distribution in the CA mortar layer by using the commercial software Abaqus. Secondly, the distributed optical vibration sensing (DOVS) technology is discussed and applied on a section of high-speed railway near the Hongqiao station which has been in operation after a long period of degradation for real-time vibration monitoring. Overall, the numerical simulation results show that, in the elastic field, the track plate defects have a significant amplification effect on the vibration, and the magnification can be more than 2 to 3 times. The vibration monitoring results reveal two elements of the fault effects on the track slab dynamic response: the amplification of the dynamic response when the train is arriving and leaving the monitoring section and also causing extreme resonance when the train is passing increasing the vibration signal largely.
1. Introduction
High-speed railway is an integral part of the modern transportation mode. However, it has raised more complex engineering problems. The entire railway system must be in excellent condition to guarantee traveling safety and comforting. A ballastless slab track is an advanced structural form of nonballast tracks; it is extensively applied in high-speed line due to its highly consistent track geometry, its longer lifespan, and the reduced need for maintenance [1]. Generally, the structure is composed of rail, fastener, track slab, filling layer of cement emulsified asphalt mortar (CAM), and concrete base. The diseases existing in the underline structure of high-speed railway are complex and diverse. The track plate diseases are generally: concrete cracks, CA mortar layer debonding, reinforcement corrosion, ageing infrastructure, basement subsidence, mud, and slope failure as discussed in [2, 3]. According to Che et al. [4], the defects in the CA mortar play a critical role in the increment of the track slab vibration magnitude. Field investigation shows that the faults in the CA mortar layer will grow by long-term dynamic loading and bring potential risks to the operation safety [5]. With regard to transport infrastructure and in response to these complex diseases and damages, track maintenance and operating practices are of vital importance as discussed in [6].
The most commonly used methods for detecting the diseases existing in high-speed railway underline structure mainly include the following categories: manual measurement, strength detection, dynamic response vibration monitoring, elastic wave detection, ultrasonic detection, and radar wave detection. Manual detection relies mainly on manual search and small-dimensional tools, which can only detect superficial diseases and they are inefficient to some extent [7]. Strength detection is the primary challenge in the condition assessment of existing infrastructure using concrete rebound hammers and other equipment, and it is impossible to find internal defects and diseases. Professionals prefer nondestructive methods to avoid further damage to an already struggling structure [8]. The radar method is based on the frequency of a returned signal as an indication of range. The radar signal is slightly weak, the detection depth is limited, and it is difficult to quantitatively analyze the degree of damage [9]. The ultrasonic method is widely used, but ultrasonic transducers are required to ensure the accuracy of detection. This is not possible in road engineering and tunnel engineering [10]. The nondestructive testing method based on the elastic wave principle is regarded to be highly useful for determining the substructure and analyzing the disease by processing the elastic wave echoes under different excitation conditions as discussed in [11–13]. They include different testing methods such as impact imaging method, the surface wave method, elastic wave tomography, and seismic response method.
The response of railway tracks and trackside vibration are strongly governed by the quality of the track. Defects or nonhomogeneities in the track and substructure can remarkably increase the dynamic response in the system, leading to further deterioration of the track. This issue is more dramatic in high-speed lines where the debonding of CA mortar layer appears almost in all sorts of ballastless tracks, and this will not only cause violent vibration of the system vehicle-track but also subsequently lead to a potential derailment of the train. Vibration monitoring and survey is of vital importance in structural dynamics and geotechnical engineering applications. Accurate measurement and monitoring of vibration are crucial for detection of anomalies and prewarning of infrastructure failure [14]. A great many traditional vibration sensors suffer from electromagnetic interference which is not suitable for applications in harsh environments.
Moreover, as discussed in [15]; the accelerometer-based systems can offer high-precision information but can only provide a short monitoring distance and require a high maintenance cost which makes them unsuitable for the actual needs of modern engineering measurement. As the field of vibration sensor has advanced, strong interests exist for new vibration sensors replacing the traditional sensors to improve cost-effectiveness and the immunity to electromagnetic interference. Optical fiber sensors have received considerable research attention since it was proposed. They operate with the same physical principle to measure strain, temperature, acoustic field, pressure, vibration, and other quantities by modifying the fiber so that the amount to be measured modulates the intensity, phase, polarization, and wavelength or transit time of light in the fiber. If sensing is distributed along the length of the fiber, an optical time-domain reflectometry (OTDR) is needed to locate the position of the intrusion or disturbance [16]. Distributed optical vibration sensors have several advantages: distributed and multiplexed topologies, small size, large-scale monitoring, excellent flexibility, and compatibility with data transmission network [17].
In this paper, a practical 2D dynamic interaction model of vehicle-track subgrade based on a two-step simulation capable of analyzing the dynamic response of high-speed railway track line under different fault distribution in the CA mortar layer by using the commercial software Abaqus is developed. Then, based on the OTDR technology, a vibration monitoring was conducted on a section of railway near Hongqiao high-speed railway station. The relationship between fiber vibration signals and the CA mortar fault distribution was discovered during the train passage.
2. Working Principle of Vibration Detection Using Distributed Optical Fiber Sensors
Distributed vibration sensors operate a real-time detection, location, and prewarning of the surrounding vibration signals. The system has been widely used in the intrusion detection and the surveillance of important areas such as military bases, nuclear reactor facilities, and electrical power plants. It has broad application prospects in continuous distributed monitoring of track, airport runway, and roadbed, and it is quite suitable for pipeline monitoring due to its large monitoring scale. An optical time-domain reflectometer (OTDR) is the simplest distributed optical sensor, and it is based on the Rayleigh scattering. The Rayleigh scattering is the most critical factor for determining the transmission loss of an optical fiber [18]. The light source is a highly coherent and narrow-linewidth laser which is suitable to enhance the interference effect of the light and avoid several scatterings in the wavelength induced by different polarization transformations of various frequency components in the light source as discussed in [19, 20].
The principle of a phase-sensitive optical time-domain reflectometer (OTDR) was initially introduced in the sensing application by Henry F. Taylor in early 1993 [21]. The overall structure of OTDR-distributed optical fiber vibration sensing system is shown in Figure 1.
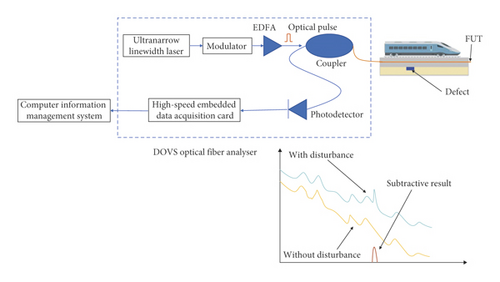
It is composed of a laser source; an optical modulator and demodulator to convert the input light into a range of pulse light; an Erbium-doped fiber amplifier (EDFA) to amplify and generate a synchronized pulse light after the modulated light been the object of losses and dispersions according to the phenomenon of scattered light with the Rayleigh scattering light as the most dominant elastic scattering light [22]; an optical coupler to collect the series of pulse light in order to transmit the final pulse light simultaneously throughout the fiber under test (FUT) for disturbance detection; a photodetector to convert the returned optical signal into an electrical signal; and a data acquisition card equipped with an A/D accessory (analog-to-digital converter) to preprocess and finally to transfer the signals to a computer information management system. Through the analysis of the disturbance information, the system alerts the main controller system for a prewarning. Hence, after emitting a high-power narrow-linewidth optical pulse, the Rayleigh scattering light signal is sampled at high speed, and the data collected are sent to a computer for further analysis. According to the analysis result, the system can determine whether there is any illegal intrusion event.
The distributed optical vibration sensing (DOVS) system developed by Shanghai Baian Technology Co. Ltd is applied in this monitoring project. DOVS uses an embedded sensing fiber as a distributed sensor to collect locomotive-induced vibration signals and then process the signals based on the principle of Φ-OTDR fiber interference.
3. 2D FEM to Simulate the Track Plate Vibration Response under Different Distribution States of the Voided Cement Asphalt Layer
3.1. Model of Single Wheel Vehicle-Track in a Sequential Dynamic Loading Mode
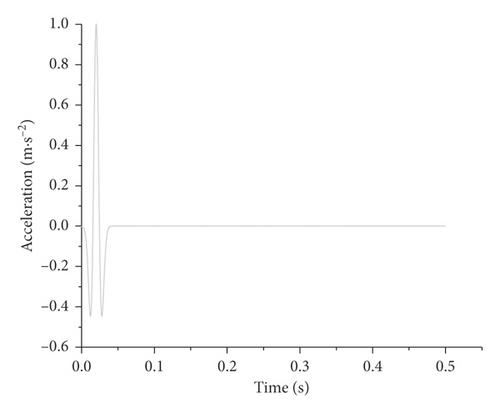
In this paper, a two-step simulation, namely, excitation and propagation discussed in [28], was extended such that the vehicle-track subgrade and track-soil dynamics are calculated separately. The vehicle-track subgrade providing the excitation source is modeled using a single moving wheelset finite element model. The waveforms generated by the dynamic interaction of the wheelset are then saved and used within the track-soil model. During the first step, a Ricker wavelet is separately applied at each fastener position, and then all the output waveforms recorded across the track line are superposed in accord with the time interval between two fasteners. The generated waves are the wheelset excitation on the track slab, and during the second step, the dynamic sequential loading mode is adopted by propagating along the track line the wheelset excitation in one time-step and in accord with the time interval. Figure 3 shows the flowchart of the dynamic response computational method.
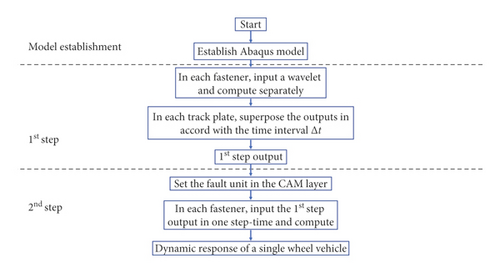
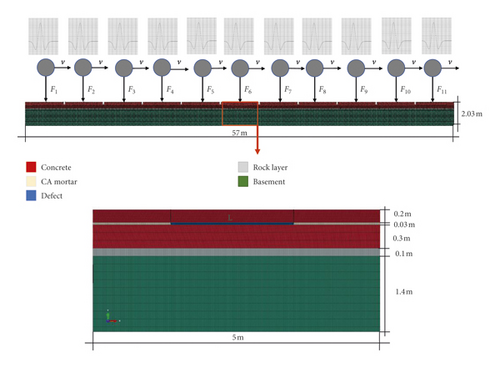
Figure 4 illustrates the coupling single wheel vehicle-track model built in this study according to the Chinese high-speed railway embankment design code. It consists of a track line of 57 m computational length and 2.03 m width. The track line is composed of 11 track plates of 5 m long each and includes five layered mediums. Table 1 shows the parameters of each material including density ρ, elastic modulus E, Poisson’s ratio μ, and damping coefficient δ. A good representation of damping is important for the finite element analysis of ground vibrations. Material internal damping and boundary damping play a key role in the vibration attenuation. The material damping (δ = 0.05) was set by default in the finite element computation as a small damping parameter to quickly remove the high-frequency vibration without having a significant effect on the track slab response. Boundary damping often referred as radiation damping was used at the edges of the mesh part so as to attenuate the vibration. These boundaries which are composed of viscous dampers are sometimes used to improve the modelling of semiinfinite environments such as soil under a building (for example, for the study of soil-structure interaction in earthquake engineering). This depreciation is called radiation damping and must be placed at the boundaries of the finite element models. In the finite element model, these dampers dissipate energy well but actually represent a transfer of energy to the semiinfinite medium that is not represented in the finite element model. The fault material (elastic modulus significantly reduced) is assigned in the middle track plate with a different rate as shown in Table 2. From top to bottom, the track plate layers are composed of concrete, CA mortar layer, a support plate in concrete, a rock layer, and the basement in natural ground. The thickness of each medium is shown in Figure 4. Considering that the damping difference between layers under structures is infinitely small, a tie contact property modelling of the finite element is adopted. A void of 0.2 m is arranged to separate two different track plates limiting the displacement of the track slab. Due to the massive size of the model, a multilevel of the mesh is used in the key analysis part. The total number of nodes in the finite element model is 347391, and the total number of elements is 326880.
| Material number | Material | ρ (kg/m3) | E (GPa) | µ | δ |
|---|---|---|---|---|---|
| 1 | Concrete | 2400 | 34.5 | 0.2 | 0.05 |
| 2 | CA mortar | 1400 | 25 | 0.168 | 0.05 |
| 3 | Defect | 1100 | 0.001 | 0.45 | 0.05 |
| 4 | Rock layer | 2600 | 27 | 0.22 | 0.05 |
| 5 | Basement | 2300 | 25 | 0.25 | 0.05 |
| Fault units | Fault length (m) | Fault area (m2) | Fault percentage |
|---|---|---|---|
| 1 | 0 | 0 | 0 |
| 2 | 0.5 | 0.015 | 10 |
| 3 | 1 | 0.03 | 20 |
| 4 | 1.5 | 0.045 | 30 |
| 5 | 2 | 0.06 | 40 |
| 6 | 2.5 | 0.075 | 50 |
3.2. Results and Discussion
The results computed with different CA mortar faulty rate and the output points taken every 0.4 m from the middle track plate excitation source have been selected for study case. The outputs are the vertical velocity of the dynamic response. Figure 5 shows the typical time histories of vibration velocity of the wheelset along the track line structure. It presents the same main characteristics as discussed in [29, 30]. The positive sign indicates the downward vibrations. The amplitude of the vibration velocity on the track line is about 0.27 mm/s. It can be seen that the positions of the wheelset axles are well described from the waveform peaks. Also, the vibrations are constantly transmitted on the track plate after being strongly dominated by the wheelset.
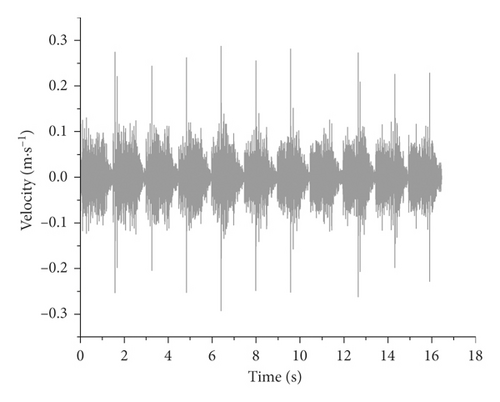
Figure 6 shows the vertical dynamic response distribution of the track slab at different CA mortar faulty rates. It can be seen that centrifugal dynamic response oscillates slightly near the load position when the faulty CAM rate is between 0% and 20%. When the faulty CAM rate is over 20%, it oscillates sharply across the slab track with vertical surface acceleration fluctuations being most significant. The peak velocity is located precisely at the wheel-rail contact point S2 for a CAM faulty rate of 40%.
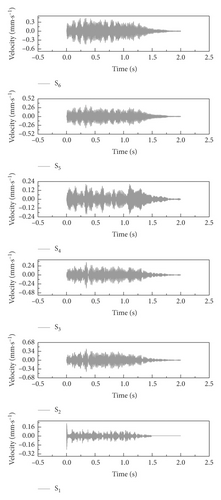
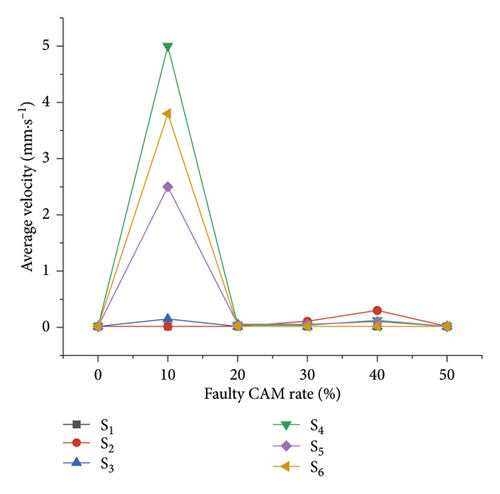
Figure 7 shows the average velocity of the track slab with different faulty CAM rates. The dynamic response at different node points in the middle track slab is studied, which implies the vertical velocity response values. Altogether, six node points are considered, the maximum average values appear at the node S4. The node points S1, S2 and S3 give nearly the same average velocity which is the smallest. The response in the nodes S1, S2, and S3 are actively and continuously dominated by the excitation of the wheelset. Also, it can be seen that the dynamic response intensifies sharply from a faulty CA mortar rate of 0%–10% which is its peak value. The peak average value of the dynamic response occurs due to extreme resonance caused by the faults in the CAM. The influence starts decreasing slowly at a faulty rate over 10% and reaches a steady state similar to that of the flawless CA mortar layer. Assuming that the increment of the dynamic response is relative because of the faults existing in the CA mortar layer, it is coherent that the shrinkage of the vertical dynamic response occurs at a faulty rate over 10% as this represents well the nonlinear behavior of the defect material. It should also be noted that the above numerical simulation is the computed result in the field of complete elasticity of the material, and only the amplification effect of the medium on the elastic wave is considered. In fact, the vibration of the train includes not only the amplification of the material but also the variation of the excitation source itself. Equal phenomena are most likely because much more internal microcracks are accumulated in the CA mortar layer with more substantial initial damage and thus weaken the dynamic strength of the track slab. At this state, it may lead to the formation of track dynamic irregularities. Hence, it will be most likely to alter the running behavior of high-speed trains and to lead to a potential derailment.
4. Application of Vibration Monitoring in Hongqiao High-Speed Railway Station
4.1. Monitoring Section
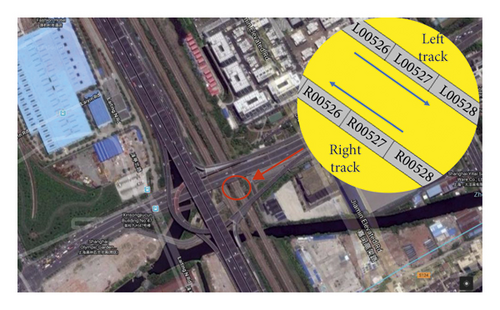
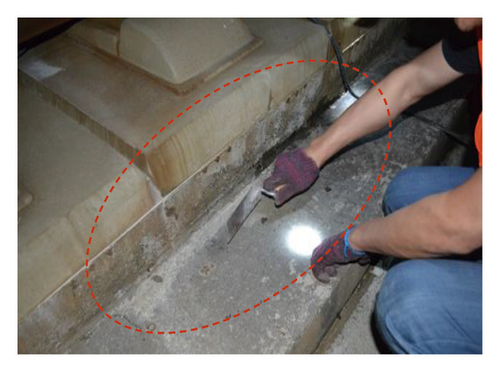
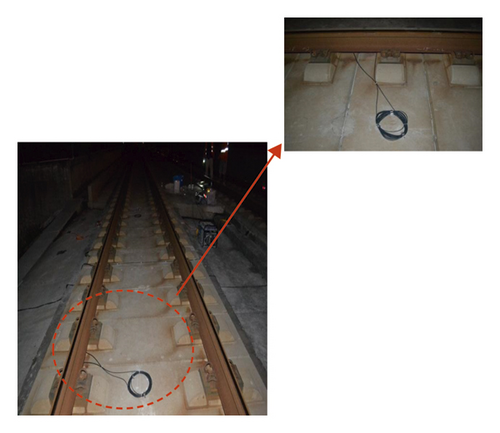
As shown in Figure 8, the site is located on the east side of the Shanghai-Hangzhou railway overpass at the intersection of the Shanghai Songjiang highway and Jiamin elevated road and is about 10 km from the Hongqiao high-speed railway station. The north side of the site is the highway interchange, and the west side is the Puhuitang river. The monitoring section is 15 m of length, and it is located on the east side of Puhuitang River Bridge. It includes a double track railway line. The results of the field investigation show that two track plates numbered, respectively, L00526 and L00528 have more visual defects. This section of the track plate has been in operation after a long period of deterioration (existence of debonding, cracks, and shelling) in the CA mortar layer. L00526 visual defect is the most serious with 15% of faulty rate. Debonding and cracks can be located visually in the CA mortar layer as shown in Figure 9. The field-testing was implemented for two days. In the first day, the quality of the CA mortar remained defective and been repaired in the next day. Twenty trains have passed through the monitoring site including ten trains in the left track and ten trains in the right track. For brevity, the results of four trains with the most induced vibration are only listed below.
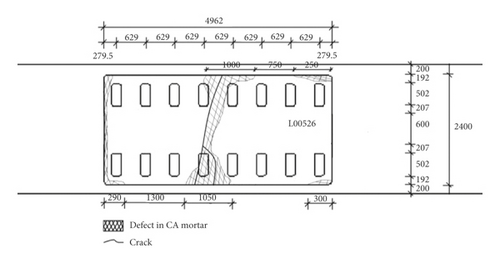
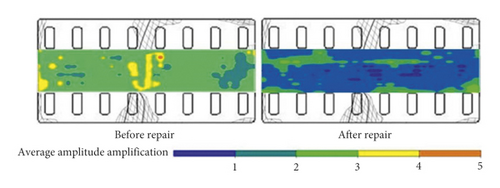
The impact imaging method was applied to detect the structural quality of the track as discussed in [31]. The initial offset imaging profile of the received wave is lined by coordinates of the sensors with an offset of 25 cm. Figure 10 shows the waveform response energy distribution in the X-axis and Y-axis before and after the repair of L00526 track. It can be seen that the waveform response in the two directions was significantly was too poor before the repair work. The response energy of the defect part of the CA mortar layer is about 2.5 times of the defect-free part. The position of the defect can be visually seen in the cloud image. This is in good agreement with the numerical simulation results. After the repair work, the compactness of the CA mortar layer has been considerably increased, and the overall defects have disappeared.
4.2. Sensor Arrangement
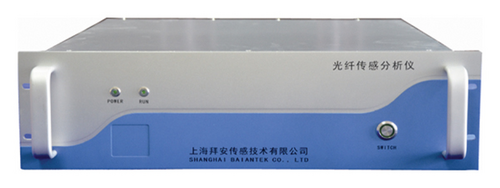
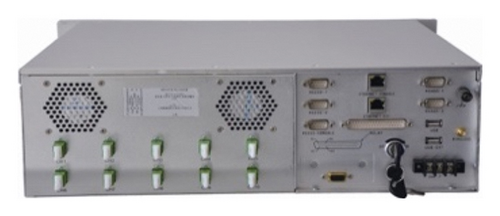
The sensing system uses a physically robust polymer optical fiber (POF) to transmit light (signals data) over large distance with very small losses through the core of the fiber and a data processing system based on DOVS technology to measure the amplitude of vibration signals. The cross section of the POF is 1 mm in diameter, and fluorinated polymers are the cladding material with slightly lower index of refraction than the core. A coating layer made of polyimide is applied around the cladding in order to withstand the extended use of such a bending or stretching operation. Table 3 shows some of the main technical indicators of the DOVS analyzer (Figure 11), including measuring distance, positioning accuracy, and detection rate.
| Measuring distance | 1∼40 km |
| Positioning accuracy | ±8∼20 meters |
| Detection rate | >97% |
| False alarm rate | <3% |
| Communication interface | Network interface, RS232, USB |
| Operating voltage | AC100∼40 V, 50∼60 Hz |
| Working power | <30 W |
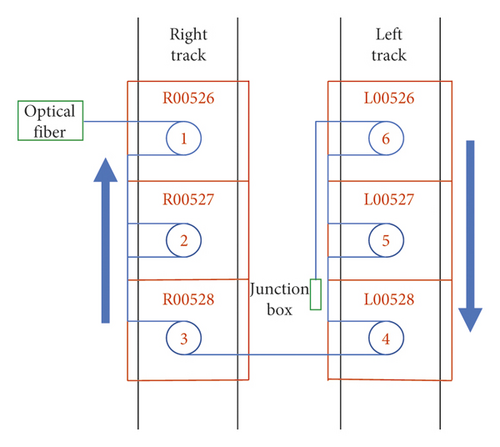
| Start of the sampling point | End of the sampling point | Ring number | Sampling distance (m) |
|---|---|---|---|
| 100 | 120 | 1 | 10 |
| 140 | 160 | 2 | 10 |
| 180 | 210 | 3 | 10 |
| 230 | 250 | Middle of the fiber under test | 10 |
| 260 | 300 | 4 | 10 |
| 320 | 340 | 5 | 10 |
| 350 | 380 | 6 | 10 |
| 380 | 400 | End of the fiber under test | 10 |
4.3. Vibration Monitoring Results
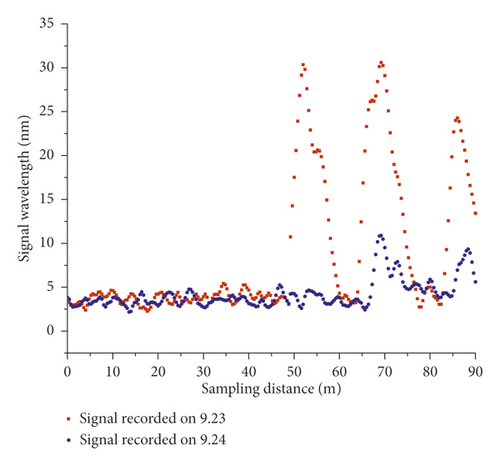
The distributed optical vibration sensing system used in this study provides only a continuous (in space) monitoring data along the optical fiber under test with high spatial resolution in order of meters. The measured data are the average reflected light wavelength through the optical fiber in the order of nanometers. The waveform amplitude method is used to process the monitoring data by comparing the vibration signals measured in the right and left track lines before and after the L00526 repair work. Figure 13 shows the original disturbance signal and sampling points along the track line. The signal recorded is the disturbance data that directly touch the optical fiber or pass to the optical fiber through the structures when the train is on operation. This recorded signal is then processed, and the positions corresponding to the rings in each track plate are only considered. The comparison is conducted following 3 phases, namely, when the train is arriving, passing, and leaving the monitoring section. The train is considered to be approaching when the locomotive head is 10 seconds from the monitoring section. It is passing when the head arrives at the monitoring section until the train tail departs. Similarly, the train is considered to be leaving when the locomotive head is 10 seconds after the train tail leaving the monitoring section completely. Tables 5 and 6 show the process and the conditions of the field measurement.
| Locomotive | Date | Track condition | Train passing time | Direction |
|---|---|---|---|---|
| 1st train | 2015.9.23 | Good quality | 18:28:19 | Right track (downward) |
| 2015.9.24 | Good quality | 18:28:35 | Right track (downward) | |
| 2nd train | 2015.9.23 | Good quality | 18:51:03 | Right track (downward) |
| 2015.9.24 | Good quality | 18:52:25 | Right track (downward) | |
| 3rd train | 2015.9.23 | Good quality | 19:08:10 | Right track (downward) |
| 2015.9.24 | Good quality | 19:09:23 | Right track (downward) | |
| 4th train | 2015.9.23 | Good quality | 19:22:24 | Right track (downward) |
| 2015.9.24 | Good quality | 19:22:10 | Right track (downward) | |
| Locomotive | Date | Track condition | Train passing time | Direction |
|---|---|---|---|---|
| 1st train | 2015.9.23 | Before repair | 18:04:20 | Left track (upward) |
| 2015.9.24 | After repair | 18:04:09 | Left track (upward) | |
| 2nd train | 2015.9.23 | Before repair | 18:19:00 | Left track (upward) |
| 2015.9.24 | After repair | 18:15:45 | Left track (upward) | |
| 3rd train | 2015.9.23 | Before repair | 19:03:51 | Left track (upward) |
| 2015.9.24 | After repair | 18:05:45 | Left track (upward) | |
| 4th train | 2015.9.23 | Before repair | 19:15:30 | Left track (upward) |
| 2015.9.24 | After repair | 19:14:36 | Left track (upward) | |
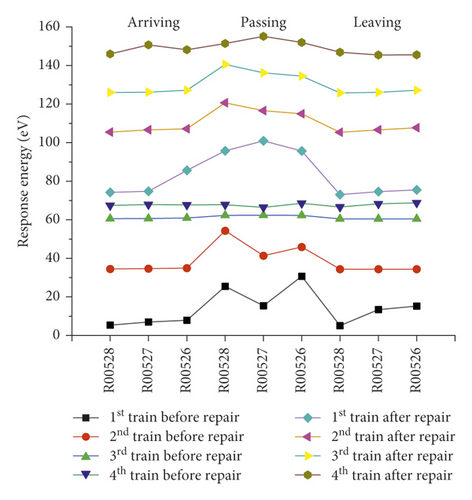
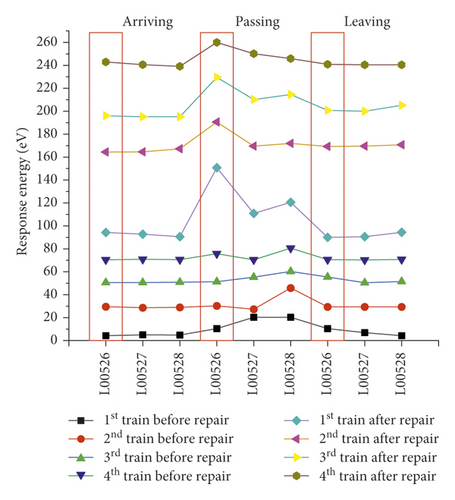
The vibration signals recorded on the right track line (R00528, R00527, and R00526) selected for corroborating evidence are the lowest due to the good structural quality, and they have almost a uniform distribution during the train operation (Figures 14 and 15). Considering that the trains having different loads, a variation of the vibration response amplitude is observed, but still, a uniform resonance is noted during all the 3 phases. Additionally, significant differences were found between the vibration signals recorded before and after the L00526 repair work. The vibration signals have not only reduced but also maintained a uniform distribution. In the left track line (L00526, L00527, and L00528) when the train is arriving, the wheels have no action yet on the monitoring section. Therefore, the vibrations recorded mainly reflect the amplification of the dynamic response induced by the faults in the CA mortar (Figures 16 and 17). When the train is passing, the centrifugal force of wheels combined with the action of the structural defects increases mostly the vibration signal. The track plate L00526 with the most visual defect has noticed stronger signals. Similar to the first phase, the vibration response observed when the train is leaving reflects mostly the dynamic response induced by the faults. Also, after the repair work on the track plate L00526 has taken effect, the signals recorded in all 3 phases have significantly lessened in the left track.
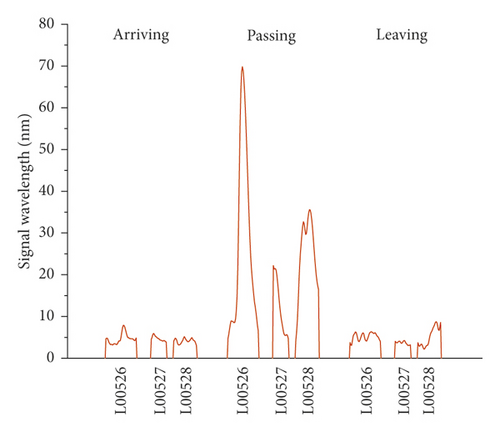
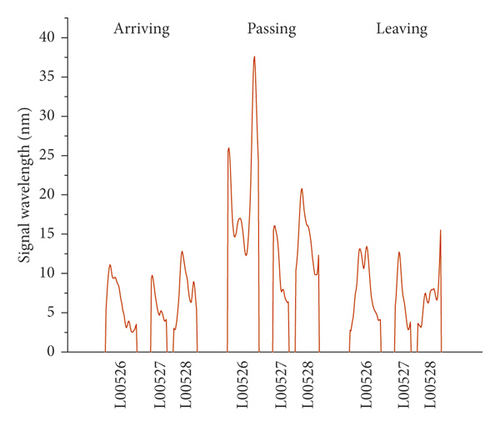
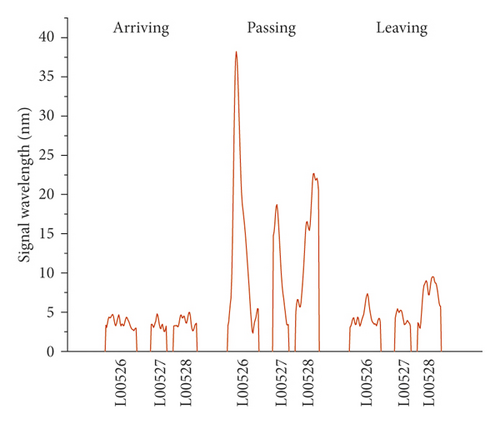
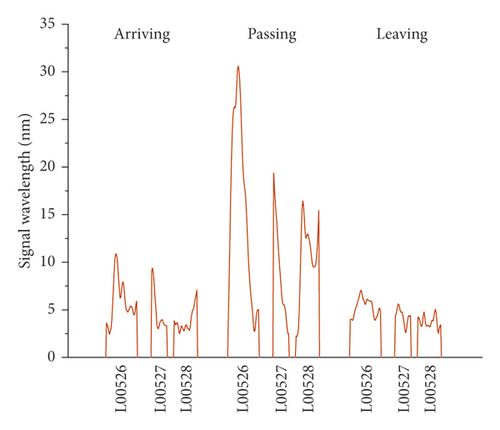
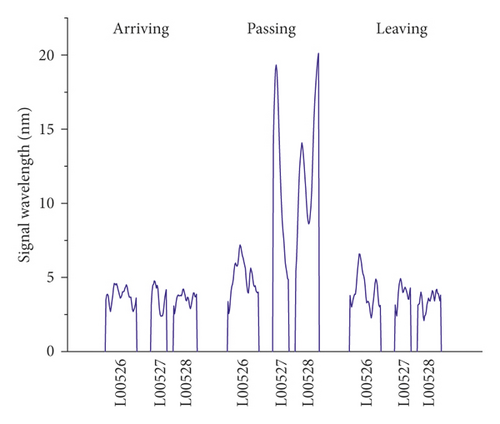
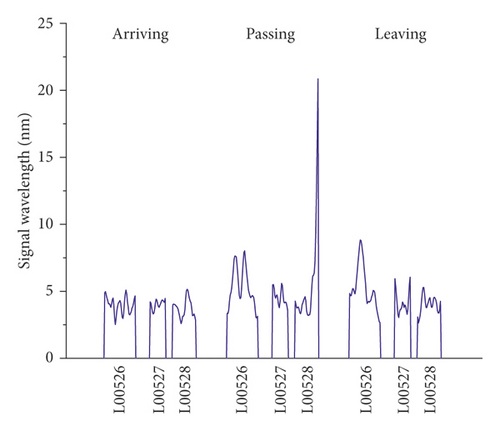
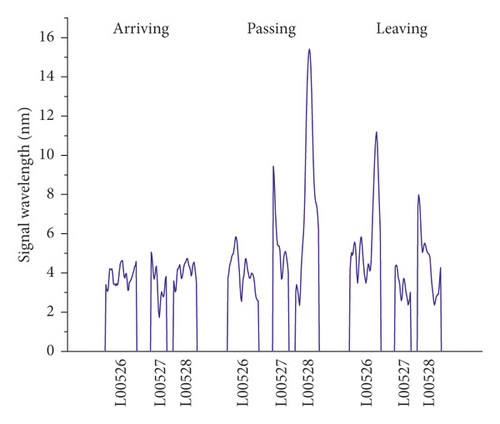
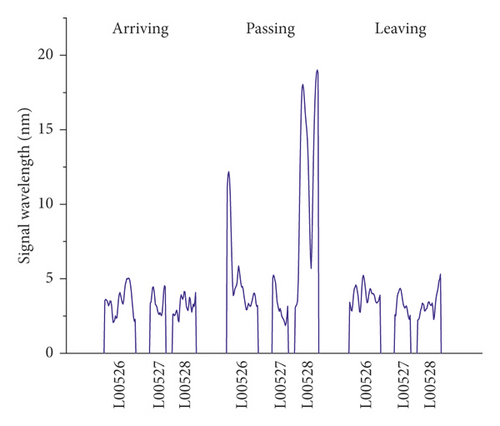
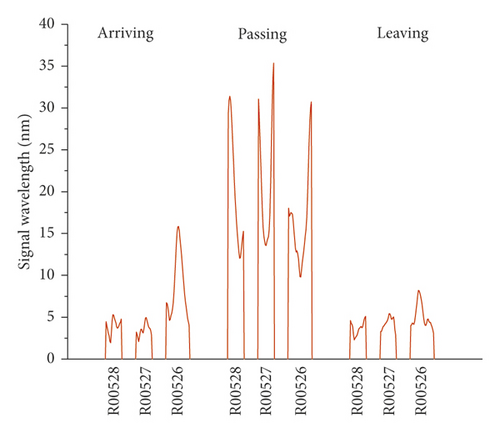
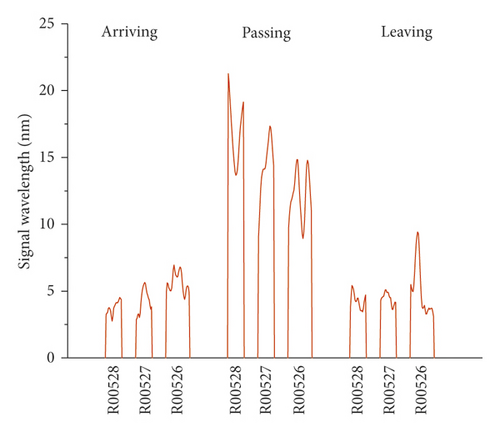
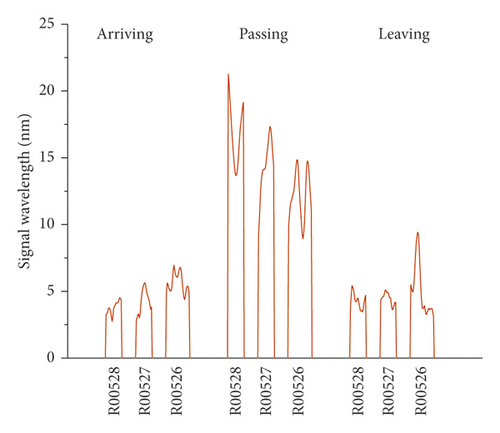
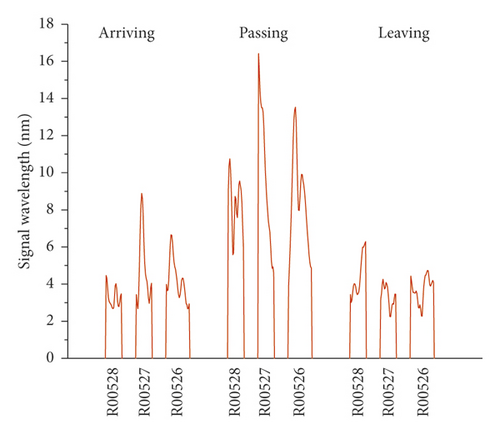
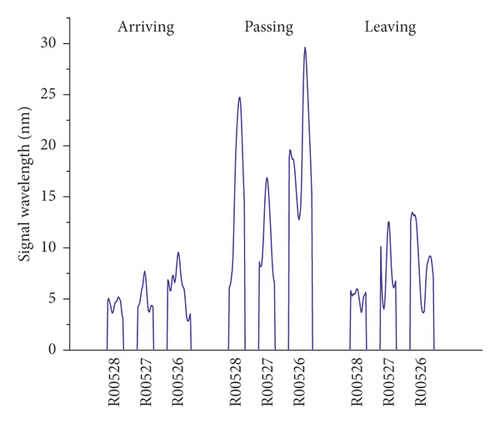
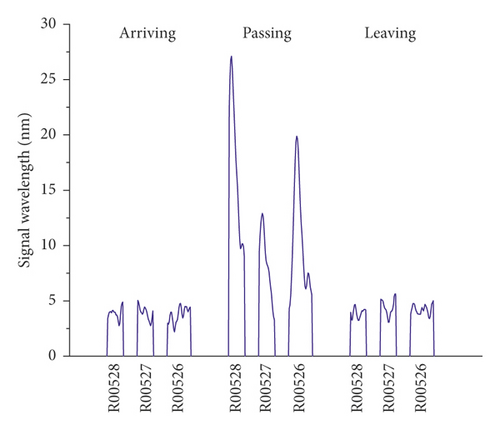
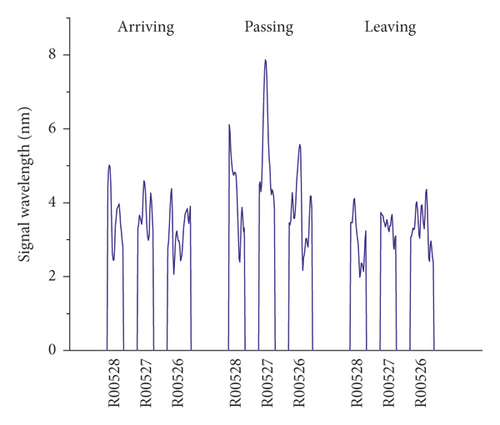
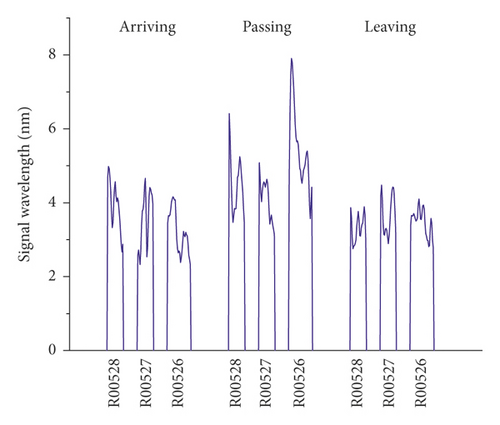
The response energy distribution is defined as the average of the absolute value of the response waveform amplitude, also known as the impulse response intensity. The average amplitude of all the tracks is added to the position information to obtain the response energy distribution. The response energy curve is shown in Figures 18 and 19. It can be seen that the response energy of the tracks before the L00526 repair work is about 2∼3 times that of the tracks after repair work, and the energy of the left track line with the most critical rate of faulty cement asphalt is larger than the response in the right track which is the defect-free area. It can also be seen that the response in the L00526 track plate is the highest before the repair work. The energy gap compared to other track plates is more apparent when the train is passing. After the repair work was implemented, the response energy is quasi-linear reaching a steady state where the faults in the CA mortar layer have no longer influence on the dynamic response. The right track line has an excellent response distribution. The response is less compared to the left track line, and similarly, it has significantly decreased after the L00526 repair.
5. Conclusion
- (1)
The numerical simulation results show that, in the elastic field, the track plate defects have a significant amplification effect on the vibration, and the magnification can be more than 2 to 3 times. Also, it is noted that the dynamic response intensifies sharply from a CA mortar rate of 0% to 10% which is its peak value. The peak average value of the dynamic response occurs due to extreme resonance caused by the faults in the CAM. The influence starts decreasing slowly at a faulty rate over 10% and reaches a steady state similar to that of the flawless CA mortar layer. Also, the vibration response at all six observation points is maximal at a faulty rate of 40%.
- (2)
Φ-OTDR depends mainly on the monitoring of the Rayleigh backscattering to determine the transmission loss in the fiber under test. It is applied on a section of high-speed railway near Hongqiao station, through a continuous real-time vibration monitoring of two opposite track lines with different structural quality. From the monitoring results, it can be seen that the faults in the CA mortar cause an amplification of the dynamic response when the train is arriving and leaving the monitoring section and also cause an extreme resonance when the train is passing through and subsequently increase largely the vibration signal.
- (3)
Comparison between the computed results from numerical simulation and the measured results by distributed vibration sensing (DOVS) also demonstrated that the DOVS can adequately reflect the vibration signal propagation inside underline structure; the measured values and the calculated values both approve the influence of the faults in the CA mortar layer on the track line vibration during train operation.
- (4)
The paper provides a feasible and effective vibration monitoring method and idea for railway researchers to inspect long-term vibration response and the potential risks to the operation safety of the high-speed train. This method can also be extended to fault detection in pavement road and loading conditions and other civil vibration-based sensing projects.
Conflicts of Interest
The authors declare that they have no conflicts of interest.
Acknowledgments
This work was financially supported by the National Key R&D Program of China (2018YFC1504504).
Open Research
Data Availability
The monitoring data used to support the findings of this study are available from the corresponding author upon request.


