Study on the Pressure Characteristics of Shock Wave Propagating across Multilayer Structures during Underwater Explosion
Abstract
The propagation of the shock wave across multilayer structures during underwater explosion is a very complex physical phenomenon, involving violent fluid-structure interaction (FSI) problems. In this paper, the coupled Eulerian–Lagrangian (CEL) method in AUTODYN is used to simulate the process of shock wave propagation and solve FSI problems. Firstly, the governing equation and the treatment of fluid and structure interface of the CEL method are briefly reviewed. Afterwards, two underwater explosion numerical models are established, and the results are compared with the empirical formula and experimental data, respectively, to verify the reliability of numerical solutions. The results obtained by this method show good agreements with those of the empirical formula and experiment. Furthermore, the model of the multilayer structures composed of two hemispherical shells and the fluid filled between the shells subjected to underwater explosion is established, and the pressure characteristics of the shock wave propagating across the multilayer structures are analyzed regarding the wave reflection and transmission. Finally, the effects of the shell thickness and the filled fluid type among the multilayer structures on the wave reflection and transmission are studied.
1. Introduction
The shock wave produced by underwater explosion can cause serious damage to submarines and threaten survivability of submarines [1]. Therefore, knowledge on the pressure characteristics of shock waves is of particular importance to an overall understanding of the shock resistance of submarines. Although numerous studies have been conducted [2–5], there are still many tough problems to solve due to the violent interactions between the structure and the shock wave, especially for the understanding of the wave propagation in multilayer structures. Among them, the double-layer hemispherical shell is often used as the protective structure of submarines and other underwater vehicles. Hence, in this paper, the pressure propagation characteristics of the underwater explosion shock wave in two hemispherical shells with air or water among them are investigated.
Regarding shock wave propagation in structures, a great deal of researches have been performed. Taylor [6] assumed that the underwater explosion shock wave is a one-dimensional planar, exponentially decaying pressure wave and adopted this planar wave as shock load to calculate the pressure and impulse on the wetted surface (the interface of water and structure). Although Taylor’s solution can give accurate pressure time histories for a simple plate, it is difficult to capture the reflected wave from the multilayer structures. On this basis, Jin et al. [7] presented an analytical method to obtain interfacial pressure of coated plates under underwater weak shock waves. The method can take into account multiple reflections and transmissions in multilayer structures. But the major limitation to this method is that the shock wave should be weak enough to guarantee some assumptions they adopted that rigid body motion is negligible and the variation of the wave propagation time in each medium caused by the medium deformation is negligible. Recently, Chen et al. [8] applied one-dimensional cavitation theory and section-varying bar theory to discuss the propagation characteristics of stress waves in simple plates and stiffened plates (T profiles and I profiles). Considering the cavitation effect, the pressure and impulse on the wetted surface are predicted accurately by analytical solution. They found that obviously pressure drops and oscillations occur on the wetted surface in the stiffened plates model due to the superposition of the reflected wave from the structure and the incident wave compared to the simple plate model. However, this analytical model is limited to the one-dimensional system.
Valuable researches on pressure characteristics of the shock wave in structures using numerical simulation have also been conducted. Otsuka et al. [9] utilized LS-DYNA3D, an analysis code using the arbitrary Lagrangian–Eulerian approach, to simulate the propagation process of the explosion shock waves produced by the two modes of detonation (a detonation cord and an emulsion explosive) in the three layers of air, water, and structure. They found that as the air layer becomes thick, the peak pressure decreases in the water. However, the impulse remains unchanged since the duration of pressure is increased by the effect of a reflected wave. Yet, their simulation lacks a comparative study between the different material layers. Desceliers et al. [10] presented a new numerical hybrid method dedicated to the simulation of the transient elastic wave propagation in multilayer unbounded media, which can be fluid or solid, subjected to given transient loads. This method can capture clearly some profiles of the elastic waves including reflected waves, transmitted waves, and refracted surface waves. However, it is restricted to simple geometrical structures. Wang et al. [11] used the coupled Eulerian–Lagrangian (CEL) method in AUTODYN to investigate the shock wave propagation characteristics near the air-backed plate and water-backed plate. They found that two pressure peaks occurred in these two numerical models, where the first peak is generated by the incident wave and the second peak is induced by the reflected wave from the plate due to the impedance of the water being lower than that of the plate. But in that work, they did not apply the CEL method to multilayer structures. Wu et al. [12] investigated the protection effects of a mitigation layer on the structure exerted by an underwater explosion with the help of the Mie-Grneisen mixture model and discussed the affections of the layer material (steel, neoprene, and polyethylene), layer thickness, and explosive-structure distance on protection effects. They concluded that the acoustic impedance of the mitigation layer plays an important role in determining not only the property of shock loads but also the occurrence of protection effects of the mitigation layer, while the layer thickness and explosive-structure distance have a little effect on the main shock loads. Nevertheless, the loads of the inner shock wave in the mitigation layer are their main concern. In addition, other scholars mainly focus on structural response and damage characteristics [13–21]. In a word, theoretical research based on certain assumptions is suitable for a structure with a simple geometry, while numerical simulation is easier to implement to deal with shock wave propagation problems in complex structures.
Owing to the presence of complex superposition of multiple waves, geometry with curvature, moving interface, and large plastic deformation, traditional theoretical research comes across many difficulties in solving shock wave propagation characteristics in multilayer structures. In order to tackle these problems, the CEL method in AUTODYN is adopted to study the propagation characteristics of the shock wave in the multilayer structures during underwater explosion in the present work. The shell thickness and the filled medium between the double shells are focused, and their influences on the propagation of the shock wave are analyzed. The relationships among the incident, the reflected, and the transmitted shock waves are discussed.
2. Theoretical Background
2.1. Coupled Eulerian and Lagrangian Method
A series of calculations in a Lagrangian subgrid are shown schematically in Figure 1 (the left column). A detailed description about this process can be referred from the study in [25, 30–32].
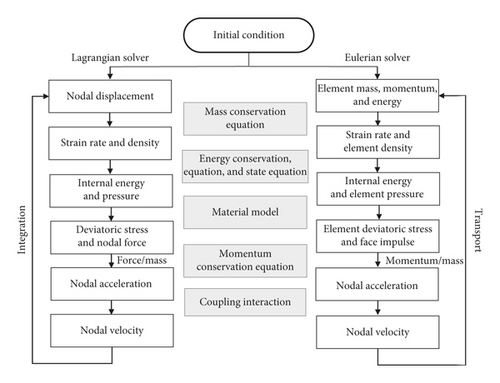
In fact, the Eulerian method contains two steps to account for both the changes in the element solution caused by the source and the transport of the material through the mesh. More details can be found in [32, 37–39].
Besides, the calculation process of the Eulerian solver is shown in Figure 1 (the right column). There are also many complicated works that need to be accomplished including the calculation of intersection points, intersecting lines, common areas, surface area, and three-dimensional volume. These detail descriptions can be found in [40–43].
2.2. Treatments of Fluid-Structure Interface
The interaction between the structure and fluid is performed at the coupling surface. At the interface, the structure described by the Lagrangian view is regarded as the geometric and velocity boundary for the fluid. Conversely, the fluid is regarded as the pressure boundary for the structure [25, 32, 37].
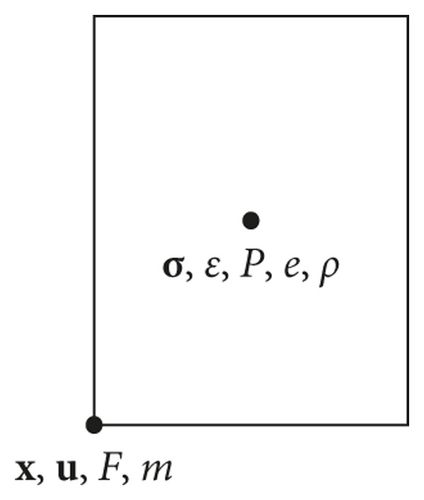
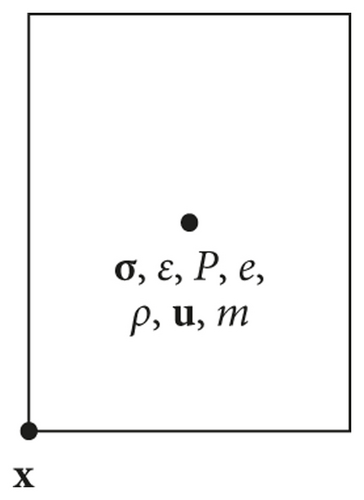
For the Lagrangian structure element, the position x, velocity u, force F, and mass m are defined at the node, while the stress σ, strain ε, pressure P, energy e, and density ρ are defined at the center of the element. For the Eulerian fluid element, all variables are defined at the center of the element except the position x (Figures 2(a) and 2(b)). This definition mode facilitates the coupling between the Lagrangian structure and the Eulerian fluid [25].
2.3. Numerical Validation
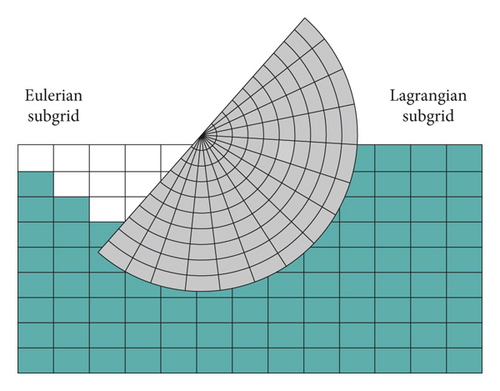
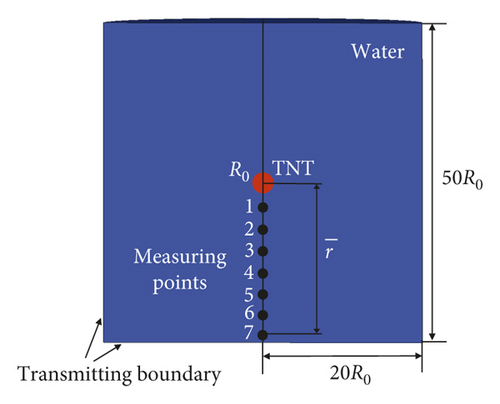
Firstly, the free-field underwater explosion model is established to validate the feasibility of the CEL method in AUTODYN [25] for simulating the shock wave pressure. The spherical TNT charge with a mass mr of 0.853 kg and a radius R0 of 0.05 m is detonated in the cylindrical domain with a radius of 20R0 and a height of 50R0, as shown in Figure 3(a). A nondimensional distance hereinafter is defined to describe the distance from the measuring points to the TNT center, namely, , where R is the detonation distance. Different distances of are chosen. The transmitting boundary condition is set around the computational domain to reduce the nonphysical reflection. In the present work, we adopt a two-dimensional axisymmetric model to simulate the process of free-field underwater explosion.
| A | B | R1 | R2 | W | E |
|---|---|---|---|---|---|
| 373.8 GPa | 3.75 GPa | 4.15 | 0.9 | 0.35 | 6.0 × 10⁹ J · m−3 |
- Reprinted by permission from Springer Nature Customer Service Center GmbH: Springer Nature Transactions of Tianjin University, Numerical simulation of underwater explosion loads, Chunliang Xin, Gengguang XU, Kezhong Liu, 2008, advance online publication, 15 November 2008 (doi: https://doi.org/10.1007/s12209-008-0089-4).
| A1 | A2 | A3 | B0 | B1 | T1 | T2 | e |
|---|---|---|---|---|---|---|---|
| 2.2 GPa | 9.54 GPa | 14.57 GPa | 0.28 | 0.28 | 2.2 GPa | 0 | 361.875 J · kg |
- Reprinted by permission from Springer Nature Customer Service Center GmbH: Springer Nature Transactions of Tianjin University, Numerical simulation of underwater explosion loads, Chunliang Xin, Gengguang XU, Kezhong Liu, 2008, advance online publication, 15 November 2008 (doi: https://doi.org/10.1007/s12209-008-0089-4).
The water and explosive are modeled by the Eulerian subgrid. In order to test the convergence of the present CEL method, three mesh resolutions are used in the Eulerian part, 2.5 mm, 5 mm, and 10 mm, respectively. An evenly partitioned grid is used. The shock wave pressure versus time at is measured, as shown in Figure 4. Clearly, the result of the mesh size 2.5 mm shows a little difference compared with the result of the mesh size 5 mm. The convergence rate of three resolutions is calculated to be 1.95 using their peak pressure. Generally, if the convergence rate is over 1, then it means this numerical method can give better results [45]. In order to reduce the computational cost, the element size for this free-field underwater explosion model is 5 mm, and the number of elements is about 100,000.

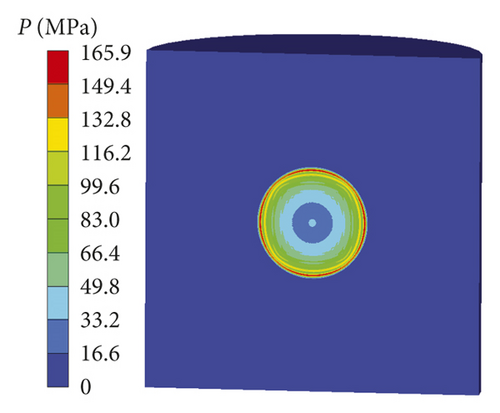
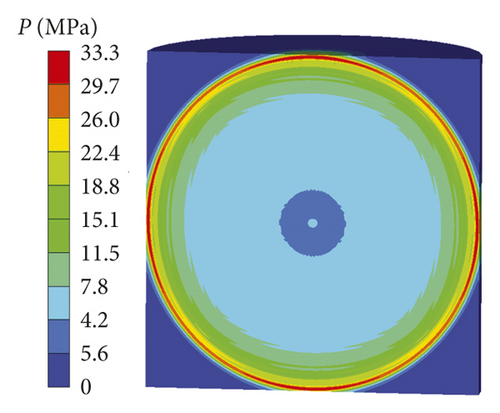
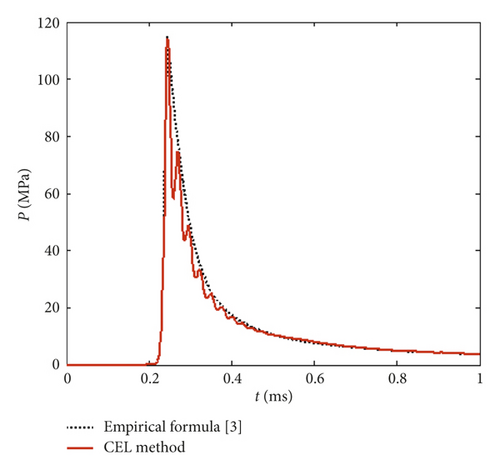
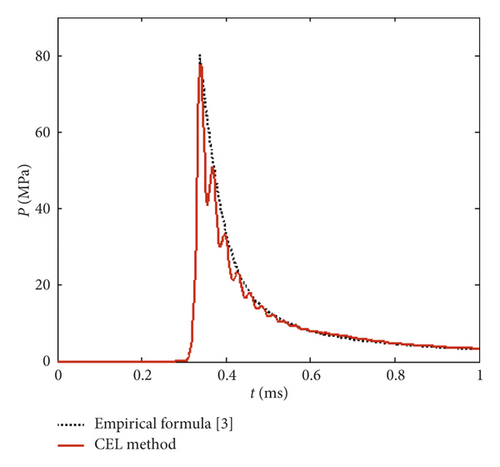
The numerical model of free-field underwater explosion and the pressure contours at two typical instants are shown in Figure 3. The shock wave propagating in water is spherical (Figure 3(b)). When the shock wave arrives at the boundary, it is not reflected due to the enforcement of the transmitting boundary condition, as shown in Figure 3(c). The time histories of the pressure at and obtained from CEL and Zamyshlyayev empirical formulas [3] are compared in Figure 5. It reveals that they accord with each other. If one defines the relative error of the peak pressure between the numerical P0 and the Zamyshlyayev results P as ε = |P0 − P|/P, the values can be listed in Table 3. We can find that the relative errors are within 10%. Although there are some oscillations caused by the strong discontinuity of the shock wave in the numerical results, the whole attenuation process and peak pressure values are in good agreement with the empirical formula.
| P0 (MPa) | P (MPa) | ε (%) | |
|---|---|---|---|
| 10 | 114.3 | 115.2 | 0.8 |
| 11 | 99.3 | 99.8 | 0.6 |
| 12 | 87.3 | 87.6 | 0.4 |
| 13 | 77.5 | 80.3 | 3.5 |
| 14 | 69.8 | 73.8 | 5.5 |
| 15 | 63.1 | 68.3 | 7.6 |
| 16 | 57.4 | 63.5 | 9.6 |
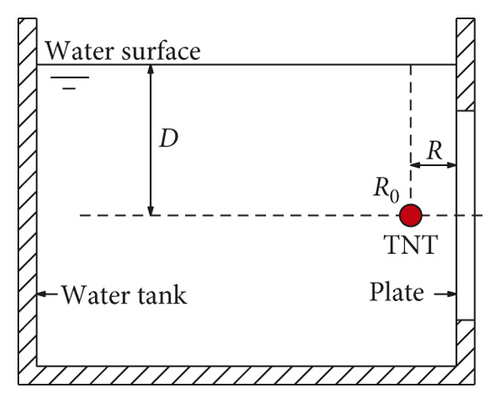
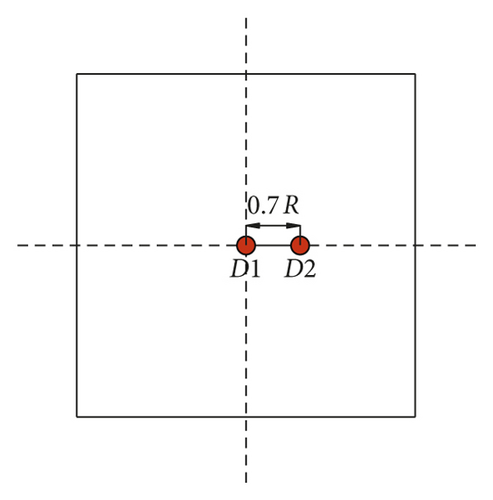
In fact, during the shock wave propagating in multilayer media, the FSI process is involved. In order to further test the reliability of the CEL method in dealing with FSI problems, an experiment (this experimental case and relevant data are provided by the Institute of Fluid Physics, China Academy of Engineering Physics) is performed in a water tank with the size of 2 m × 2 m × 2 m. The depth of water is 1.6 m. As shown in Figure 6, the square test plate made from the mild steel Q235 is fixed on the wall of the tank. It has a length of 0.8 m and a thickness of 0.003 m. The cylindrical charge has a size of Φ 20 mm × 18 mm, and thus, the mass is 10 g. The charge is placed in the water, and its depth is D = 0.8 m. The axis of the charge is parallel with the plate, and the distance R from the axis to the plate is about four times the charge radius R0, namely, R = 4R0. The experimental layout is illustrated in Figure 6. Two measuring points (D1 and D2) are placed on the side of the plate to record the displacement and velocity (Figure 7).
The three-dimensional numerical model is established according to the layout of the experiment. The water and TNT are also modeled by the Eulerian subgrid. Note that the air in this numerical model can be ignored. The steel is modeled by the Lagrangian subgrid, and its density is 7,830 kg/m3. The Johnson–Cook strength and fracture parameters for the steel are listed in Tables 4 and 5 (found in [46]). The smallest element size of the Eulerian mesh is 5 mm, and it is 1.5 mm for the Lagrangian mesh. The Euler domain consists of about 3.8 million cells, and the Lagrangian domain contains 570,000 cells.
| A | B | C | n | m |
|---|---|---|---|---|
| 249.2 MPa | 889.0 MPa | 0.058 | 0.746 | 0.94 |
- Reprinted from Ocean Engineering, 117, F.R. Ming, A.M. Zhang, Y.Z. Xue, S.P. Wang, Damage characteristics of ship structures subjected to shockwaves of underwater contact explosions, Pages No.359–382, 2016, with permission from Elsevier (doi: https://doi.org/10.1016/j.oceaneng.2016.03.040).
| D1 | D2 | D3 | D4 | D5 |
|---|---|---|---|---|
| 0.38 | 1.47 | 2.58 | −0.0015 | 8.07 |
- Reprinted from Ocean Engineering, 117, F.R. Ming, A.M. Zhang, Y.Z. Xue, S.P. Wang, Damage characteristics of ship structures subjected to shockwaves of underwater contact explosions, Pages No.359–382, 2016, with permission from Elsevier (doi: https://doi.org/10.1016/j.oceaneng.2016.03.040).
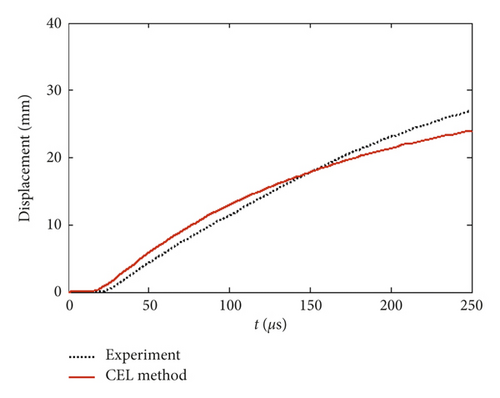
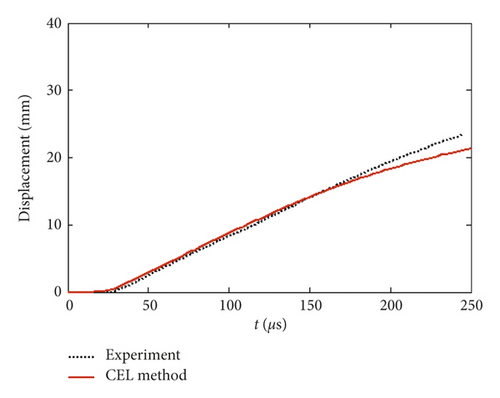
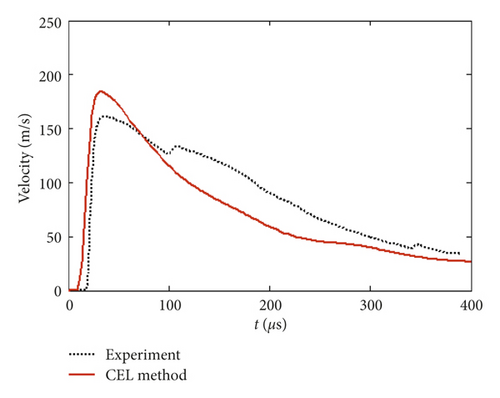
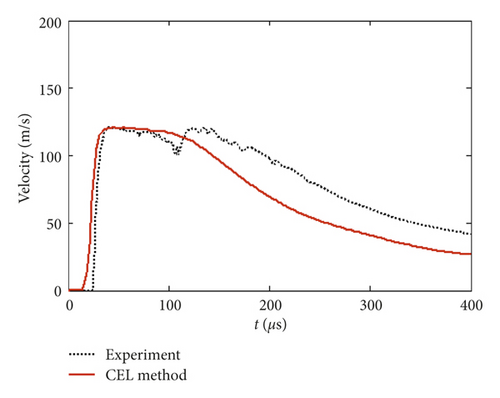
The displacement and velocity time histories calculated by the CEL method are compared with the experimental results in Figure 8. It is not hard to see from Figure 8 that they are in good accordance, especially the displacement time histories. Therefore, the CEL method can simulate the FSI process well, and it can predict accurately the shock wave propagation in the complex model.
3. Results and Discussion
3.1. Numerical Model
The two-dimensional axisymmetric numerical model of a double-layer hemispherical shell subjected to underwater explosion is established to investigate the propagation characteristics of the shock wave in multilayer media, as plotted in Figure 9. The outer shell has a radius of R1 and a thickness of d1, while the inner shell has a radius of R2 and a thickness of d2. The parameters related to distance are normalized by the charge radius R0, namely, , , , , and . The thickness of the outer shell is changed to test the effects, so are selected with a constant of . The mass of the spherical TNT charge, the charge radius R0, and the size of the Eulerian domain are the same as those of the free-field model in Section 2.3. The measuring points 1 and 3 are located near the outside surface of the outer shell and the inner shell, respectively. The measuring point 2 is located near the inside of the outer shell, and the distance from point 2 to the outer shell is . The shell structure is fixed around the boundary, and the transmitting condition is enforced around the fluid domain so as to overcome the nonphysical reflection. The parameters related to time hereinafter are normalized by the time decay constant θ when in equation (8).
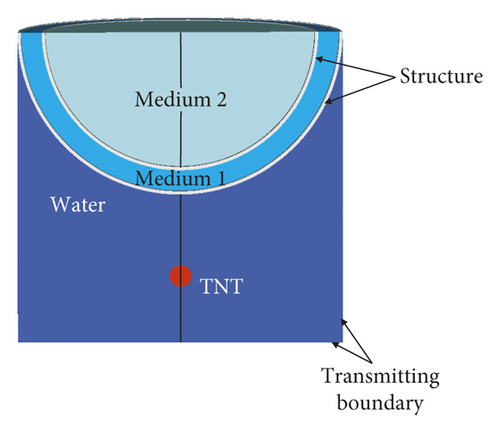
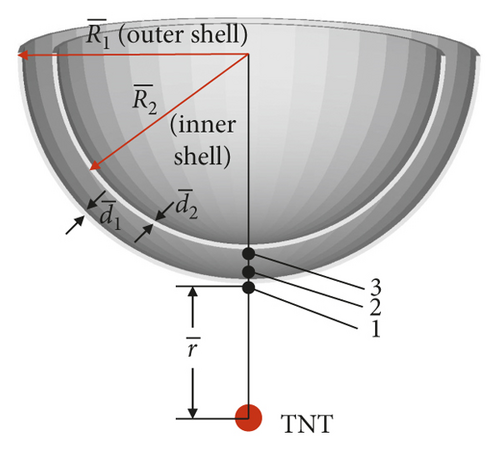
Medium 1 and medium 2 are water or air. The material parameters of water and charge are the same as those in the free-field model. Air is modeled by the ideal gas equation of state, which can be written as p = ρ/ρ0((γ − 1))e, where the specific heat ratio γ is 1.4, the initial density of air ρ0 is 1.225 kg/m3, and the specific energy e is 253.4 kJ/m3 [25]. The density of steel is 7,830 kg/m3 [25]. Note that the Johnson–Cook strength parameters listed in Table 6 [25] for the steel are different from those of the experiment in Section 2.3. The element size for the Eulerian part is also 5 mm, the same as that of the free-field model, and more than four elements in the thickness direction are discretized for the Lagrangian part. Thus, the Eulerian domain contains about 100,000 cells, and the number of Lagrangian cells ranges from 4,230 to 8,940 due to different outer shell thicknesses.
| A | B | C | n | m |
|---|---|---|---|---|
| 792.0 MPa | 510.0 MPa | 0.014 | 0.26 | 1.03 |
3.2. Shock Wave Propagation Process
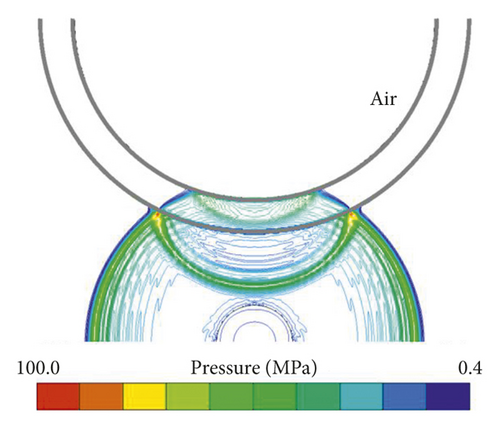
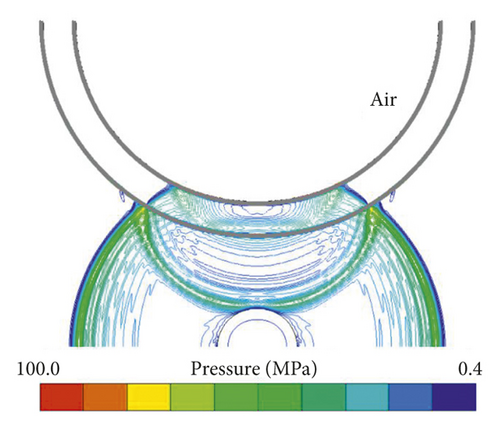
Figure 10 shows the shock wave propagation process for the case of media 1 and 2 filled with water and air, respectively, at the detonation distance . Several typical instants during the process are presented. Obviously, they show a similar process after the charge detonation, and a spherical shock wave propagates to the outer shell surface (Figure 10(a)); when the wave arrives at the outer shell whose other side is backed to water, it is reflected and transmitted by the shell, as plotted in Figure 10(b) (the left column). Accordingly, when the wave arrives at the outer shell whose other side is backed to air, there exists a rarefaction wave reflected which travels backwards in water. Due to the much lower impedance of the air, the transmitted wave is weaker than the reflected wave. Therefore, Figure 10(b) (the right column) cannot recognize the transmitted wave in the air-backed case; when the transmitted shock wave reaches the inner shell whose other side is backed to water, the shock wave is reflected and transmitted over the shell again in Figure 10(c) (the left column). Cavitation occurs near the outer shell in the air-backed case, as shown in Figure 10(c) (the right column). Also, the pressure of the reflected and transmitted waves on the inner shell in the water-backed case is obviously larger than that in the air-backed case. Later, the wave reflected from the inner shell propagates to the outer shell, and then it is reflected and transmitted again. Due to the complex superposition of the incident wave, the reflected wave, and the transmitted wave, the pressure becomes very complicated (Figure 10(d) (the left column)). At the same time, the cavitation region in the air-backed case is further expanding.

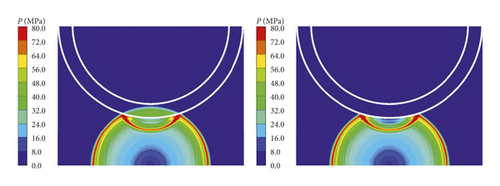
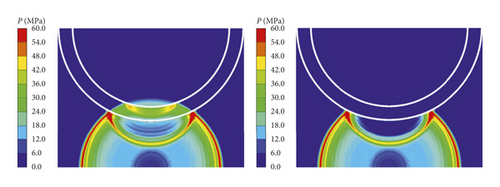
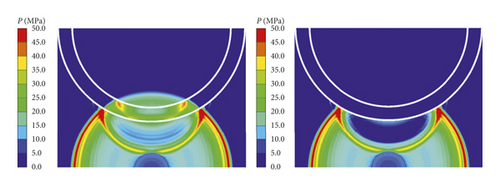
On the whole, because of the severe mismatch of the impedance between different media, the intensity of the transmitted wave of the shells backed to water is larger than that of the shells backed to air and the cavitation region near the outer shell occurs in the air-backed case.
3.3. Shock Wave Reflection
Figure 11 shows the time history of the shock wave pressure at point 1. The outer shell is backed to water in case a and to air in case b. Meanwhile, different thicknesses of the outer shell are also taken into account, and the detonation distance is 10. Note that medium 2 behind the inner shell has a little effect on the reflected pressure near the outer shell. As the results show, if , with the increase of the outer shell thickness, the pressure of the reflected wave tends to be steady in both cases. By comparing the above two cases, it can be seen that the peak pressure of the reflected wave caused by the water-backed shell is larger than that of the air-backed case, but the latter tends to be consistent with the former in value if . What is more, the pressure fluctuates more violently for the air-backed case.
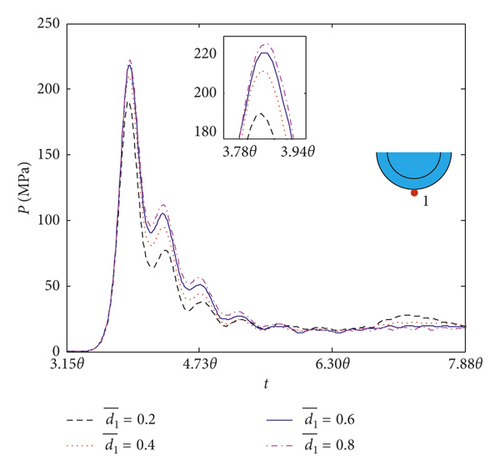
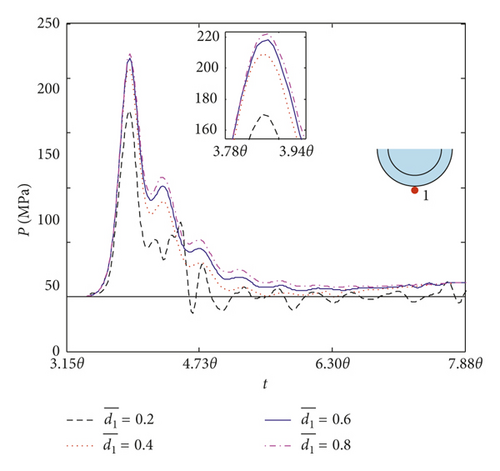
This can be explained from the perspective of wave propagations. The first interface for the wave arrival is the same for the two cases, namely, the interface between the water and the outside of the outer shell. Therefore, the reflected wave pressure at this interface should be equal in both cases. However, at the next interface, the shock wave transmits from the inside of the outer shell to the water in case a while from the inside to the air in case b. Because the acoustic impedances of water and air are much lower than that of steel, there is a rarefaction wave reflected at this interface [47–51]. Therefore, the intensity of the incident shock wave is unloaded. Moreover, the acoustic impedance of air is lower than that of water, the unloading effect in case a is less serious than that in case b, so the peak pressure of the reflected wave in case a is larger than that in case b. The stiffness of the outer shell, however, is improved with the increase of shell thickness. Hence, the intensity of the reflected wave in these two cases is gradually enhanced. To sum up, if the outer shell thickness , the medium behind the outer shell will affect the peak pressure of the reflected wave slightly.
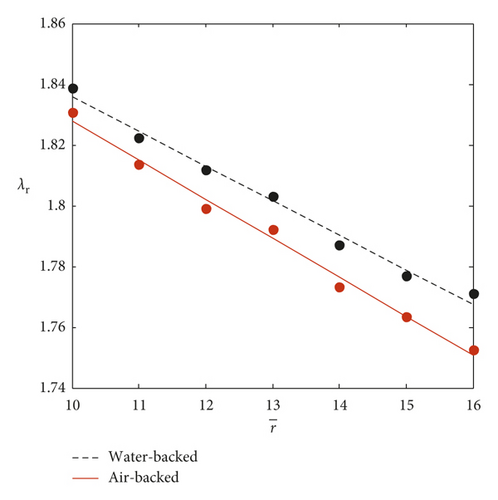
The reflection coefficient of shock wave pressure is defined as λr = P1/P0, where P1 is the peak pressure of the reflected wave at point 1 and P0 is the peak pressure at the same distance in the free-field underwater explosion model. In the present work, if the detonation distance is far enough, the numerical model can be regarded as a one-dimensional model. Based on Taylor’s assumptions [6], we can obtain P1 = P0 + Pr − ρcv, where Pr is the pressure of the reflected wave and ρcv is the pressure of the rarefaction wave produced by the motion of the structure. ρ is the density of water, c is the sound speed of water, and v is the velocity of the outer shell. If the perfect reflection of the incident wave occurs [52, 53], the pressure of the reflected wave would read Pr = P0. Therefore, P1 should satisfy P1 = 2P0 − ρcv theoretically. And then, the reflection coefficient holds λr = P1/P0 = 2 − ρcv/P0.
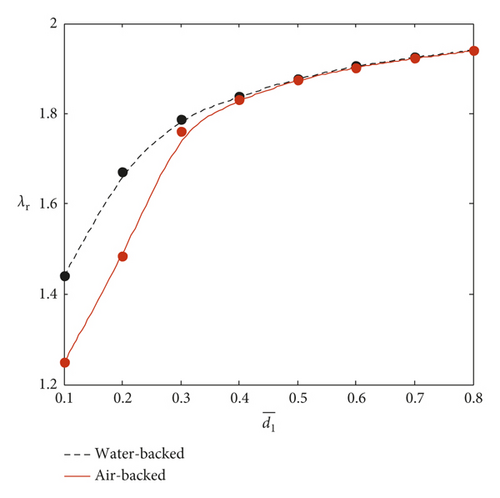
Figure 12 illustrates the reflection coefficients of the shock wave varying with the thickness of the outer shell at the distance . Obviously, the reflection coefficients increase with the increase of shell thickness, but the trend gradually slows down for the two cases. Moreover, the coefficients of the air-backed case are almost the same as those of the water-backed case if . The reflection coefficients exceed 1 no matter what the medium is filled with at the back of the outer shell. It means that the presence of the outer shell enhances the peak pressure at point 1.
If the thickness , the shock wave reflection coefficients varying with the distance in these two cases are plotted in Figure 13. The coefficients decrease with the increase of detonation distance, as shown in Figure 13. The relationship between the reflection coefficients and the detonation distance is approximately linear for these two cases. In the present work, we can recast the Zamyshlyayev empirical formula, i.e., equation (6), as , where k and α are the ratio parameter and exponent parameter, respectively. So, a relation between the reflection coefficient λr and the distance can be obtained as . As described in the literature [54], the rarefaction wave (i.e., ρcv) can be neglected at the early stage of shock wave impinging on the absolutely rigid structure. For the elastic shell, if we extract the velocities of the outer shell near point 1 from numerical results, listed in Table 7, we can find these velocities are positive for these cases. So, the rarefaction wave cannot be neglected. In this case, the reflection coefficient of peak pressure varying with the distance can be obtained from the numerical simulation, as shown in Figure 13. One should notice that the decreasing trend of the coefficient is only suitable for the cases of close distances (i.e., ).
| t (θ) | v (m/s) | λr | |
|---|---|---|---|
| 10 | 3.90 | 12.1 | 1.84 |
| 11 | 4.38 | 11.1 | 1.82 |
| 12 | 4.87 | 10.0 | 1.81 |
| 13 | 5.38 | 9.7 | 1.80 |
| 14 | 5.88 | 9.2 | 1.79 |
| 15 | 6.39 | 8.7 | 1.78 |
| 16 | 6.89 | 8.2 | 1.77 |
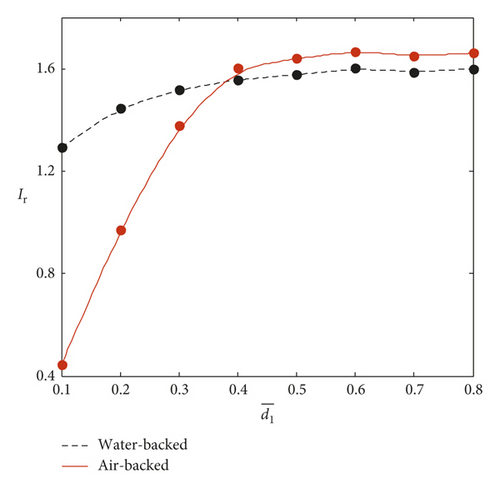
The impulse reflection coefficient can be defined as Ir = I1/I0, where I1 is the pressure impulse at point 1 and I0 is the pressure impulse at the same distance in the free-field underwater explosion model. Figure 14 shows the impulse reflection coefficients varying with shell thickness in the water-backed case and air-backed case at the detonation distance . The impulse reflection coefficients increase with the increase of shell thickness, and the tendency becomes gradually slow. If , the impulse reflection coefficients of the air-backed case will be smaller than those of the water-backed case because the deformation of the outer shell in the air-backed case is more serious than that in the water-backed case. If the thickness , the coefficients of the air-backed case are larger than those of the water-backed case. Under this circumstance, the deformation of the outer shell is not the principal factor influencing impulse, since the stiffness of the outer shell is high enough. The reason for this phenomenon is that the incident wave transmits over the outer shell in the water-backed case, while the incident wave is mainly reflected in the air-backed case because of the impedance difference between water and air.
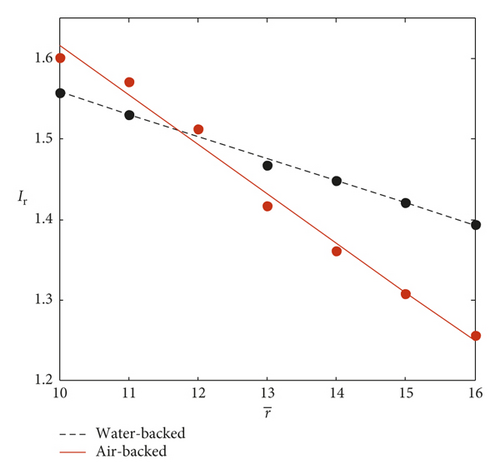
If the thickness , the impulse reflection coefficients varying with different detonation distances in these two cases are plotted in Figure 15. The coefficients approximately decrease linearly with the increase of detonation distance whatever the outer shell is exposed to water or air. It should be noticed that Ir of the air-backed case changes faster than that of the water-backed case and varies in a wide range, which may be due to the fact that complex superposition of the wave system between the outer shell and the inner shell affects seriously the pressure of point 1 after t = 7.09θ, found in Figure 10.
3.4. Shock Wave Transmission
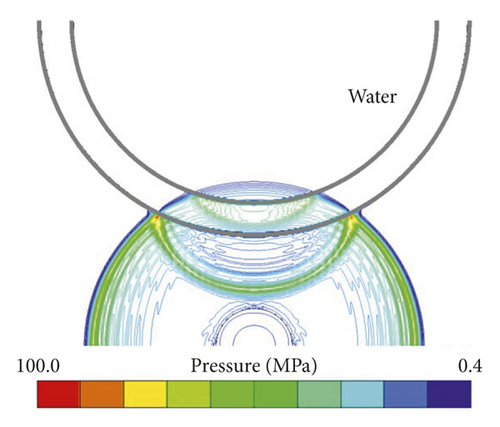
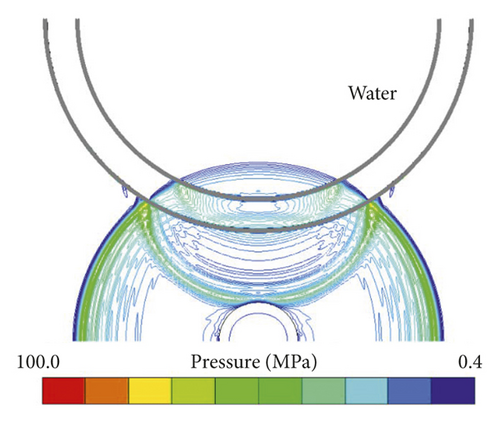
When the shock wave transmits over the outer shell to the inner shell, the peak pressure and the energy of the shock wave gradually attenuate. In Figure 16, the pressure histories of the transmitted shock wave for different shell thicknesses are presented. Medium 1 between the two shells and medium 2 behind the inner shell are water or air, respectively. The detonation distance is 10. In Figure 16(a), medium 1 and medium 2 are both water (noted as water-water), while medium 1 is water and medium 2 is air (noted as water-air) in Figure 16(b). Obviously, when the wave transmits over the outer shell, a peak pressure, called the transmitted peak, occurs in these two cases, and then it attenuates quickly. With the attenuation of the pressure, the waves reflected by the outer and inner surfaces of the inner shell reach point 2 at about t = 6.30θ, as shown in Figure 17. Owing to the superposition of the transmitted wave and the reflected wave, it causes the pressure to rise and generates a second peak pressure, called the reflected peak, which might have a second impact on the shell (Figures 16(a) and 16(b)). In addition, both the peaks decrease with the increase of the outer shell thickness. It is worth noting that the reflected peak can be larger than the transmitted peak if . It indicates that the reflected wave produced by the inner surface of the outer shell plays a leading role under this circumstance.
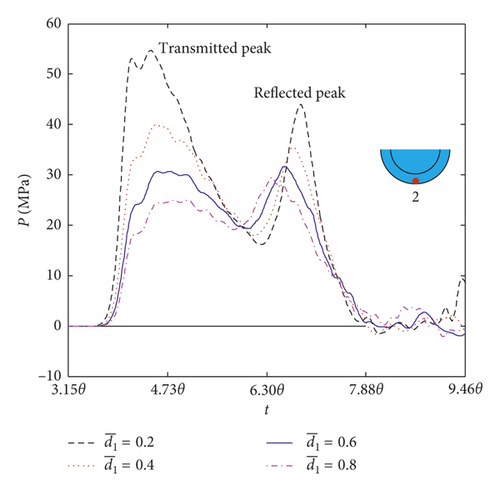
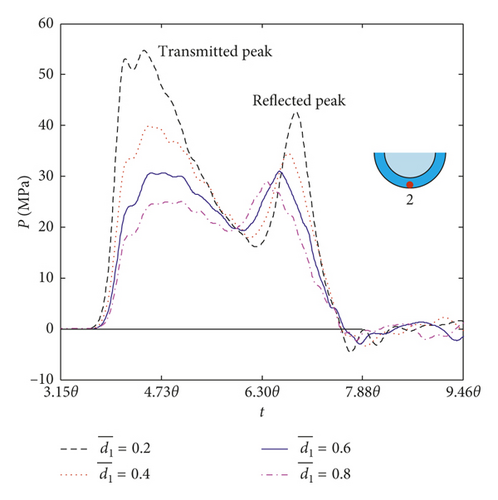
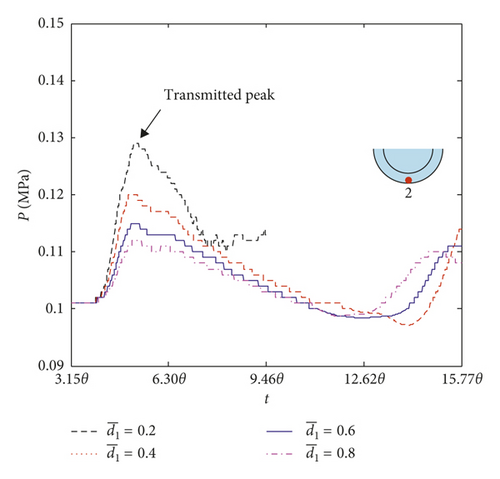
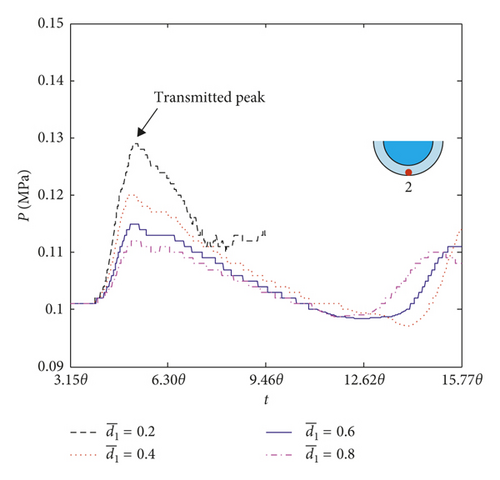
Media 1 and 2 are both air (noted as air-air) in Figure 16(c), while medium 1 is air and medium 2 is water (noted as air-water) in Figure 16(d). The peak pressures of the transmitted shock wave at point 2 are almost the same at the same shell thickness for both the cases, while they are about 1/330 times that of the water-water case. It may be due to the lower impedance of air which is about 1/5,000 times that of the water. If the shell thickness in these two cases, there are no values in pressure history curves when the time exceeds 9.46θ, which is due to the fact that the outer shell after deformation is over the position of the measuring point 2. With the increase of the shell thickness, the pressure attenuates gradually. Different from the water-water case or water-air case, the second peak arrives later (at about t = 15.77θ) which may be due to the strong impedance mismatch. Also, the pressure time histories show no differences for medium 2 filled with water or air behind the inner shell.
As seen in Figures 16(a)–16(d), it can be found that medium 1 has a great influence on the pressure of the transmitted wave. On the contrary, medium 2 behind the inner shell has few effects on the transmitted pressure.
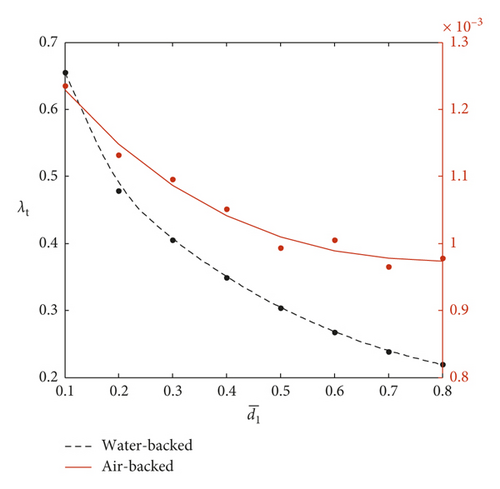
The transmission coefficient λt = P2/P0 can be defined as the ratio of the peak pressure P2 of the transmitted wave at point 2, i.e., the first peak in Figure 16, to the peak pressure P0 of the incident shock wave in free field. The transmission coefficients of the shock wave varying with different shell thicknesses are plotted in Figure 18. As described in the analysis above, medium 2 behind the inner shell has little effect on the peak pressure of the transmitted shock wave. Therefore, the cases in which medium 2 is water while medium 1 is water or air are hereinafter taken for examples. With the increase of the shell thickness, the transmission coefficients of the shock wave decrease exponentially for the two cases. Although the peak pressure P2 of the air-backed case is much smaller than that of the water-backed case, the trend of transmission coefficients varying with different shell thicknesses is similar to that of the water-backed case.
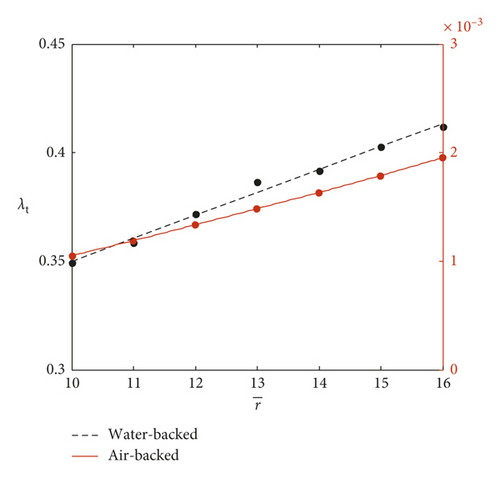
Taking the thickness for example, the curves of the transmission coefficients varying with different detonation distances can be plotted in Figure 19. Unlike Figure 13, with the increase of the detonation distance, the transmission coefficients have a trend of increase by degrees. The difference may be because the peak pressure P2 is affected by the inner shell and the outer shell together, while P1 is mainly affected by the outer shell, although the peak pressure P1 and P2 decrease as the detonation distance increases.
The total energy released by the TNT is 2703 kJ at t = 7.5θ, and the proportion of the energy absorbed by the outer shell accounting for the total energy is plotted in Figure 20. Because the TNT mass is quite small and the shell has not been destroyed, the energy absorbed by the outer shell is less. With the increase of shell thickness, the energy absorption proportion increases generally. Another feature is that the proportion of the energy absorbed by the outer shell can be up to 2% for the air-backed case while about 1% for the water-backed case when the shell thickness ranges from 0.1 to 0.8. For the same shell thickness, the energy absorption of the air-backed case is two to three times that of the water-backed case. This may attribute to the larger deformation of the shell in the air-backed case.
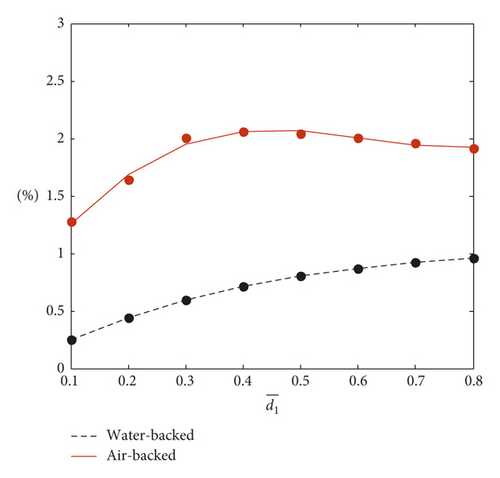
Figure 21 shows the proportion of the energy transmitted over the outer shell versus different thicknesses. The transmission energy gradually decreases with the increase of shell thickness for the two cases. For the same shell thickness, the transmission energy of the air-backed shell is much smaller than that of the water-backed shell, which coincides with the above results in Figure 18. That is, the transmission coefficient λt of the air-backed case is much smaller than that of the water-backed case.
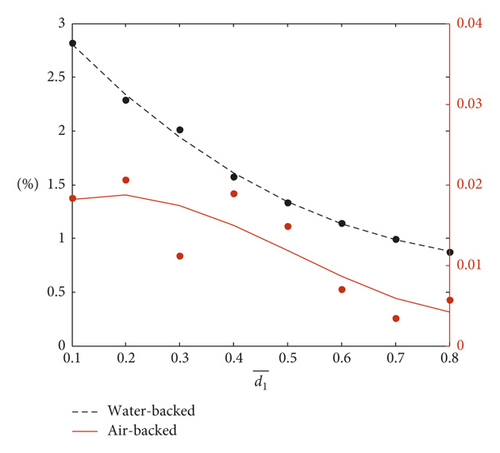
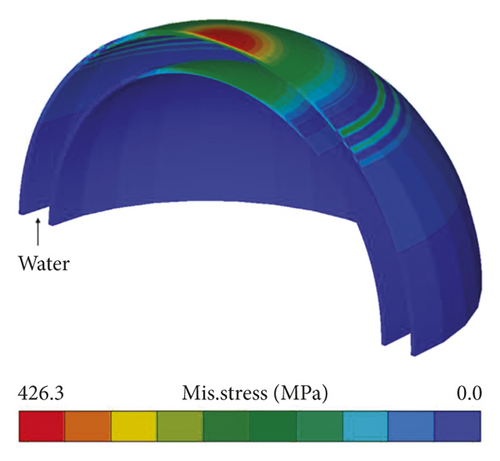
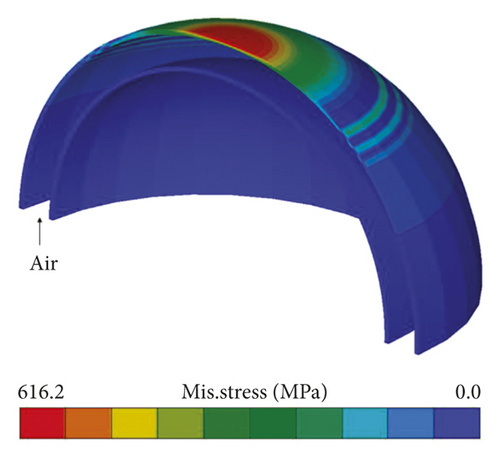
Figure 22 shows the Mises stress contours of the outer and inner shells for the case of the outer shell thickness . It can be seen that if medium 1 between the two shells is air, the maximum stress of the shell will be about 1.5 times that of the water-backed shell, and there are almost no stresses in the inner shell. Therefore, it can be concluded that if the medium is filled with air between two shells, the inner shell is prevented from serious impact.
3.5. Comparison of Shock Wave Reflection and Transmission
Actually, the shock wave pressure measured on the outer surface of the shell is from the superposition of the incident shock wave and the reflected shock wave. In order to study the relationship between the reflection and transmission of the shock wave, the ratios λ1 = (P1 − P0)/P2 of the peak pressure of the reflected shock wave to that of the transmitted shock wave are plotted in Figure 23. The peak pressure of the reflected shock wave is the difference between the measured pressure P1 near the surface of the outer shell and the incident pressure P0 in free field.
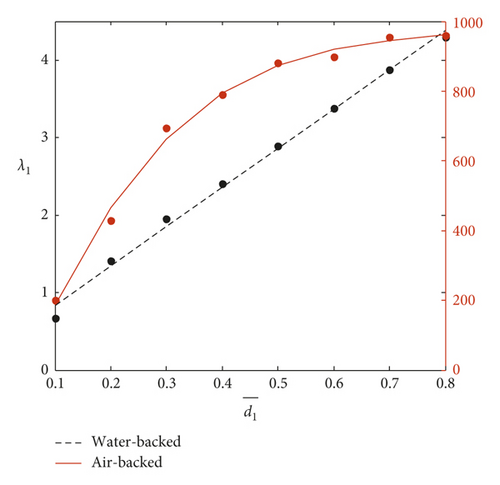
Obviously, with the increase of the thickness, no matter what the outer shell is backed to, the ratios increase and tend to be slow when the thickness exceeds to some extents for the air-backed case. The reason for this phenomenon is that the peak pressure P2 of the transmission wave decreases drastically with the increase of shell thickness (Figures 16 and 18). Another feature is that the ratios of the shell backed to air are much larger than those of the shell backed to water. That is, the reflection proportion is dominant for the air-backed case. This can be explained by the fact which can be found in Section 3.4 that the peak pressure P2 of the air-backed case is smaller than that of the water-backed case for two orders of magnitude.
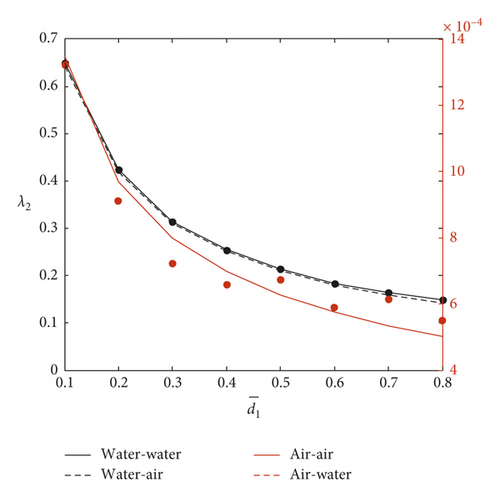
Figure 24 shows the peak pressure ratios λ2 = P3/P1 at the measuring points 1 and 3 versus different outer shell thicknesses. Generally, the ratios decrease with the increase of the shell thickness no matter what media 1 and 2 are filled with. It indicates the reflection proportion increase as the shell thickens. In addition, the ratios of the water-backed cases (water-water case and water-air case) are obviously larger than those of the air-backed cases (air-air case and air-water case) which almost coincide with each other. These accord well with the analysis in Sections 3.3 and 3.4.
After the directive wave propagating over the outer shell, the transmitted wave arrives at the inner shell, which can be regarded as a directive wave producing a new charge, i.e., the equivalent charge mass me. That is to say, the effect of the transmitted wave on the inner shell is, to some extent, equivalent to that of a new charge on the inner shell. With the aid of the analysis in Section 3.3, me can be transformed from a free-field component of incident peak pressure on the inner shell, namely, P4 = P3/λr, by Zamyshlyayev empirical formula (6).
Table 8 presents the ratios of the equivalent charge mass me to the actual charge mass mr. The cases of the medium between the two shells filled with water are considered, and air-backed cases are absent because P3 is too small. As the table shows, the equivalent charge mass for the inner shell can be decreased about 75% if the outer shell thickness is over 0.2 times the charge radius. With the increasing thickness, the equivalent charge mass decreases sharply.
| Case | Water-water (me/mr, %) | Water-air (me/mr, %) |
|---|---|---|
| 81.4 | 78.8 | |
| 26.1 | 25.2 | |
| 11.9 | 11.6 | |
| 6.8 | 6.5 | |
| 4.3 | 4.1 | |
| 2.8 | 2.7 | |
| 2.1 | 1.9 | |
| 1.6 | 1.4 |
4. Conclusions
The shock wave propagation between two hemispherical shells which are filled with different media is studied based on the coupled Eulerian–Lagrangian method in AUTODYN. The relationships among the incident, reflected, and transmitted waves are discussed.
The medium between two hemispherical shells will affect the peak pressure of the reflected wave generated by the outer shell slightly if the outer shell thickness is thicker than a certain level (here, it is over 0.4 times the charge radius). The reflection coefficients of peak pressure and impulse increase with the increase of shell thickness and decrease linearly with the increase of detonation distance. Besides, the cavitation area caused by the reflected rarefaction wave near the outer shell occurs in the air-backed case.
When the wave transmits over the outer shell, a peak pressure, called the transmitted peak, occurs whatever the medium behind the outer shell is water or air. It is worth mentioning that a second peak, which is relatively compared to the transmitted peak, can be produced by the reflections of the inner shell, and it will be larger than the transmitted peak if the outer shell thickness reaches a certain extent (here, it is over 0.6 times the charge radius) for the water-water and water-air cases. The medium between the two shells has great influences on the transmitted wave, while the medium behind the inner shell has slight effects on the transmitted wave. With the increase of the shell thickness, the transmission coefficients of the shock wave decrease exponentially and increase linearly with the detonation distance whatever the outer shell is exposed to water or air.
For the same outer shell thickness, the energy absorption of the air-backed case is about two to three times that of the water-backed case. With the increasing thickness, the equivalent charge mass decreases drastically. The equivalent charge mass for the inner shell can be decreased about 75% if the outer shell thickness is over 0.2 times the charge radius.
Conflicts of Interest
The authors declare that they have no conflicts of interest.
Acknowledgments
This paper was supported by the National Natural Science Foundation of China (51609049 and U1430236) and the Natural Science Foundation of Heilongjiang Province (QC2016061).
Open Research
Data Availability
All data included in this study are available upon request by contacting the corresponding author.


