Vibration Characteristic of High-Voltage Tower Influenced by Adjacent Tunnel Blasting Construction
Abstract
The effects of tunnel blast excavation on the adjacent existing high-voltage tower are comprehensively studied for the Chashan highway tunnel project as a case study. To investigate the effect of blast-induced vibration from the tunnel on the adjacent existing tower, field tests and numerical simulations method were adopted to study the vibration velocity and vibration frequency of the existing tower. Moreover, the relationship between the transverse distance from the detonation center and the peak velocity is discussed in detail. The results showed that the peak velocity of the measuring point in tower foundation increases with the distance between the detonation center and tower foundation approaches, and the maximum velocity is appearing when detonation center is 0 m. Furthermore, the corresponding energy spectrum distributions of the existing tower under the effect of blast induced by vibration is also analyzed, and the main frequency of vertical vibration is generally higher than that of transverse vibration. On combining the peak velocity with the main frequency and the natural frequency of the tower, the safety evaluation of the blasting area is proposed, and the corresponding control measures of blasting vibration are put forward. A guideline for the blast safety zone is proposed based on vibration velocity, main frequency, and the quantity of explosive.
1. Introduction
Tunnels play an important role in the transportation infrastructure of mountain areas and bring convenience to people’s lives [1–7]. In China, at present, the construction of mountain tunnels mainly adopts the drilling and blasting method which is a preferred method of rock excavation worldwide due to low initial investment, cheap explosive, and possibility to deal with different complex geologies [8–10]. Although the drilling and blasting method have been widely used in underground construction, the stability of mountain body and surrounding environment has been inevitably disturbed, and the groundwater system of the mountain has been greatly affected during blasting excavation, which could increase the risk of construction safety [11–16]. For shallow-buried tunnels, surface vibration caused by drilling and blasting is relatively large to reduce the impact of blasting on surrounding buildings, and ground vibration caused by blasting in the process of tunnel construction should be reasonably controlled. Limited by the geological condition of mountain areas and economic factors, it is difficult to build tunnel far away from high-voltage towers. Furthermore, the high-voltage tower is a high-rise structure, which is very sensitive to tilt deformation and uneven settlement of foundation, and the failure of key components will result in the collapse of the structure under vibration [17, 18]. The uneven settlement of the high-voltage tower foundation is caused by tunnel blasting, which may lead to paralysis of the power supply system, huge economic losses, and even causing serious consequences such as fire. Therefore, it is crucial to reduce the influence of blasting on the high-voltage tower and ensure that the safety of the high-voltage tower in the process of tunnel blasting excavation.
Study on the dynamic response of the high-voltage tower induced by tunnel blast excavation can be found in literature [18–22]. For example, Moon et al. [23] studied experimentally the seismic behavior of a specific connection between the structural members of the transmission tower. Some studies [24–27] evaluated the vibration damage to transmission towers based on the finite element method. Tian et al. [28] investigated the effect of the types of connections used for the transmission cables and the effect of direction and the spatial variability of the earthquake on the seismic behavior of transmission towers. Luo et al. [29] analyzed the dynamic characteristic of the tunnel for surface explosion of 100 and 300 kg TNT charge, respectively, according to features of the Nanjing metro tunnel in sandy soil. Yu and Ding [30] studied the blasting technology of the tunnel under passing high-voltage tower. Yu et al. [31–33] investigated the response of the immersed tunnel under nonuniform seismic excitation, and the multipoint shaking table tests were conducted to simulate the superlong immersed tunnel.
In order to study the response of the existing building under the tunnel excavation, Zhang et al. [34] taking the Tianjin metro line 6 through the tower as the engineering background, the simulation analysis of the tower under the subway double-line tunnel is carried out by using numerical simulation. It was shown that the tower was most affected by the tunnel center within the range of 2 times the tunnel diameter. Mair et al. [35] studied the effect of tunneling on the Waterloo and City Line (WCL) tunnels, the Victory Arch, and Elizabeth House, beneath which are passed by the new tunnels. Guan [36] studied the relationship between the peak velocity of adjacent buildings and the main frequency of blasting and the natural frequency of buildings and evaluated the safety of ground.
However, as a complex, continuous, mechanical system, vibration design of the high-voltage tower system remains one of the most challenging tasks in the civil engineering design community [37]. There are still many problems to be studied about the blasting construction scheme, vibration characteristics, and safety evaluation method when the tunnel passes through the adjacent high-voltage tower.
So this paper uses the field experiment and numerical simulation to study the vibration velocity and the main frequency of the high-voltage tower based on the record data in the process of blasting construction. In addition, some key positions in the high-voltage tower require monitoring and protecting. The blasting excavation safety zone where blasting excavation needs to be carefully done is proposed, which can provide references for other similar projects.
2. Brief Description of the Project
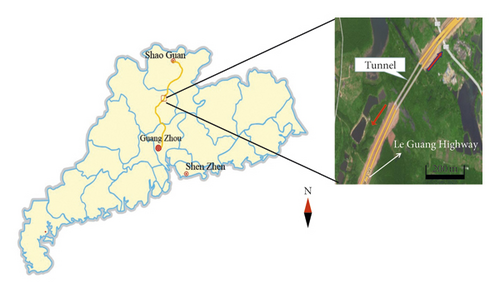
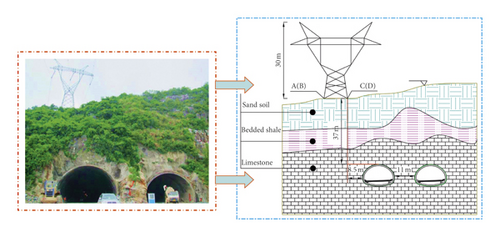
The Chashan tunnel is a short shallow-buried tunnel with six lanes in both directions. It is located on the Leguang expressway in Guangdong Province, China, as seen in Figure 1. The tunnel passes through the shallow karst hills and river deposits where the stratum is predominantly limestone with thin-bedded shale. The corresponding geotechnical parameters of local site conditions are shown in Table 1. Furthermore, the left tunnel and right tunnel have a similar feature, in which the width of two tunnels is all approximately 18 m, and the height is approximately 12 m, as seen in Figure 2. And the distance between the two tunnels is about 11 m, the length of the left tunnel is 258 m, and the length of the right tunnel is 259 m. The high-voltage tower is located approximately 60 meters from the entrance of the left tunnel and less than 10 meters from the center line of the left tunnel. The vertical distance between the tunnel and the high-voltage tower is approximately 37 meters. The monitoring points are arranged on the high-voltage tower foundation and tower main frame. The high-voltage towers are made of steel that are as high as 30 m, and the horizontal spacing between two foundations at the same side is 8 m, which is with a cup shape, and a spatial tower structure is composed of ideal hinge bars. This tower is made of Q235 or Q345 steel angles, where Q235 is the carbon steel and Q345 is the alloy steel (the letter Q represents yield strength) [38, 39]. Table 2 shows the parameters of the tower material.
| Type | E (GPa) | γ (KN/m3) | λ | Vs (km/s) |
|---|---|---|---|---|
| Sand soil | 0.2 | 18.2 | 0.31 | 0.7 |
| Bedded shale | 11.1 | 22.1 | 0.29 | 3.8 |
| Limestone | 28.5 | 20.9 | 0.29 | 5.2 |
- E: elastic modulus; γ: unit weight; λ: Poisson’s ratio; Vs: compressive wave velocity.
| Steel material | σy (MPa) | Ε (GPa) | λ |
|---|---|---|---|
| Q235 | 235 | 201 | 0.3 |
| Q345 | 345 | 206 | 0.25 |
- σy: yield strength; E: elastic modulus; λ: Poisson’s ratio.
3. Blasting Construction and Field Test
3.1. Blasting Pattern
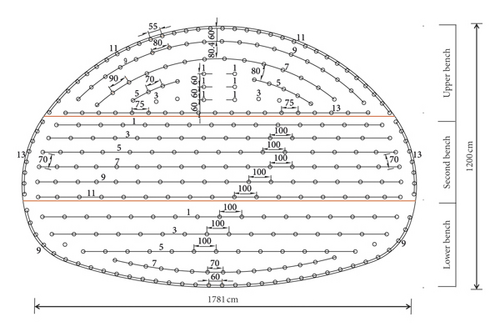
According to the geographic environment and technology conditions of the Chashan tunnel, a three-benching blasting excavation method on the working face was proposed to control the quantity of blasting explosives and reduce the impact of blasting on the disturbance of the high-voltage towers. The distance between upper bench and second bench was controlled within 5 m. The blasting pattern is shown in Table 3. The periphery holes and auxiliary holes are in the same vertical plane. The layout of blasting holes is shown in Figure 3. Due to the large excavation area of the upper bench, the vibration intensity induced by the blasting is greater, so the research mainly focuses on the excavation blasting induced by vibration of the upper bench.
| Excavation site | Blasting parameters | Number of holes | Hole of depth (m) | Charge weight per hole (kg) | Delay | Explosive weight per delay (kg) |
|---|---|---|---|---|---|---|
| Upper bench | Cut holes | 6 | 1.2 | 0.6 | 1 | 3.6 |
| Auxiliary holes | 29 | 1.0 | 0.8 | 3, 5, 7, 9 | 23.2 | |
| Peripheral holes | 31 | 1.0 | 0.29 | 11 | 8.99 | |
| Second bench | Auxiliary holes | 40 | 1.0 | 0.57 | 1, 3, 5, 7, 9 | 22.8 |
| Peripheral holes | 16 | 1.0 | 0.29 | 16 | 4.64 | |
| Lower bench | Auxiliary holes | 30 | 1.0 | 0.57 | 1, 3, 5, 7 | 17.1 |
| Bottom plate holes | 20 | 1.0 | 0.57 | 9 | 11.4 | |
3.2. Blasting Monitoring
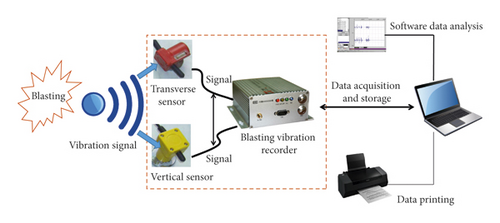
Blasting vibration monitoring is mainly to study the influence of shallow tunnel blasting excavation on the high-voltage tower. TOP-BOX blasting vibration recorder and digital blasting vibration wave analysis software are used in this blasting monitoring, and its sampling frequency is in the range of 50–200 Hz that fully record the potential frequency ranges of the tower vibration induced by the blasting construction [40]. In the process of blasting excavation, the sensor installed at the monitoring point vibrates with the vibration of the monitoring point. The principle of the instrument is to convert the relative motion kinetic energy between the magnetic coil systems into an electromotive force signal, the electromotive force signal is input into the computer through various hardware devices, and the waveform analysis and data processing software are used for data acquisition and storage. The schematic illustration of the vibration monitoring system is shown in Figure 4.
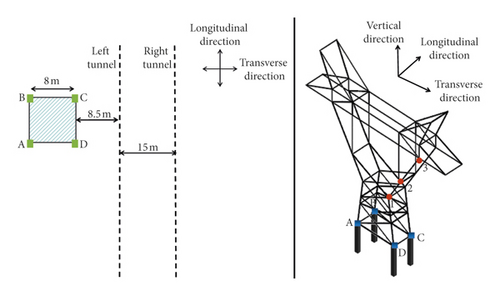
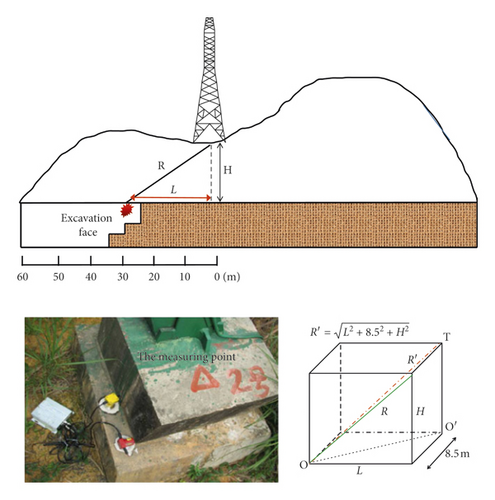
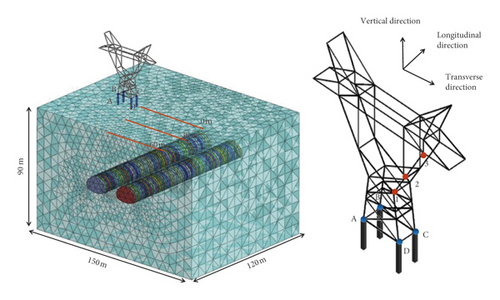
To study the influence of blasting construction on the high-voltage tower, before the blasting excavation, the measuring point is installed on the surface of the tower foundation and main frame of the tower to record the peak velocity and frequency of the high-voltage tower in the process of blasting construction. As shown in Figure 5, the four measuring points A, B, C, and D are, respectively, distributed on the foundation of the high-voltage tower to record the velocity amplitude, time history curve, and vibration energy spectrum in the process of tunnel blasting. And three measuring points are implemented along with the vertical direction of the tower frame to analyze comprehensively the vibration characteristics of the high-voltage tower. The height of the measuring points is 10 m, 20 m, and 28 m distance from the surface, respectively. However, due to the undulating terrain, the propagation law of blasting vibration waves has its particularity that, during the blasting construction, the vibration response of the ground surface directly above the excavation face may not be the most serious. The monitoring range of the tower takes 60 m along the tunnel for the origin. Figure 6 shows the sectional view of blasting excavation, the detonation center is O, the tower foundation is T, the longitudinal distance between the detonation center and tower foundation is L, the vertical distance between the detonation center and the tower foundation is H, the distance between the detonation center and the tower foundation is R′, and R is the projection along the longitudinal plane in distance between the tower foundation and detonation center.
3.3. Test Results
Since the left tunnel is excavated first, this paper mainly focuses on the influence of blasting excavation of the left tunnel on the tower. However, to limit the amount of data included in this paper, the following results only focus on the velocity-time history curve of point D when L is 0 m. The results are shown in Figure 7, and the time interval between detonators is 0.1 s during the blasting. And, thus the reflection of explosion waves occurred at interfaces of different media leads to a plurality of peak troughs appearing in the vertical velocity, where maximum velocity was 1.75 cm/s at t = 0.25 s, and the blasting vibration time lasted approximately 1.0 s. Moreover, the peak velocity in the vertical direction was larger than the transverse direction.
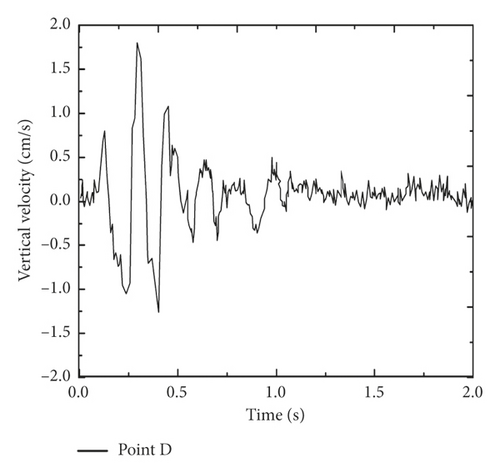
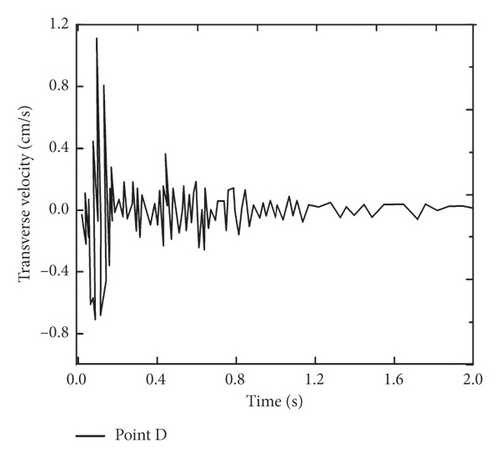
Table 4 records the vertical, transverse, and longitudinal velocity and main frequency of point D, when L was 60 m, 50 m, 40 m, 30 m, 20 m, 10 m, and 0 m in the process of blasting excavation. The effect of blasting vibration on the tower was summarized as follows: as the distance between the detonation center and tower foundation approaches, the velocity in three directions of point D was greater. When the distance between the tower foundation was zero, the velocity in three directions of point D reaches the maximum. And, in the field experiment, vertical vibration velocity was maximal among the three directions, which was perpendicular to the foundation of the exiting tower. Based on the safety criterion of blasting vibration velocity for different structures according to the Chinese code for blasting safety standards (1999), it can be found that the allowable vibration velocity was no more than 2.5 cm/s. When the detonation distance is 0 m, the maximum vibration velocity was 2.358 cm/s in measuring point D, which is close to the safety control standard of 2.5 cm/s. Therefore, for eliminating potential safety hazards as early as possible and preventing the collapse of the tower, the monitoring of the tower foundation should be strengthened and the blasting charge should be reduced during the blasting construction.
| Test number | L | R′ | Velocity (cm/s) | Frequency (Hz) | ||||
|---|---|---|---|---|---|---|---|---|
| Longitudinal | Transverse | Vertical | Longitudinal | Transverse | Vertical | |||
| 1 | 60 | 71.00 | 0.0155 | 0.1026 | 0.0925 | 12.23 | 14.02 | 18.13 |
| 2 | 50 | 62.77 | 0.0239 | 0.2016 | 0.2579 | 9.26 | 12.23 | 16.26 |
| 3 | 40 | 55.14 | 0.0356 | 0.4539 | 0.4835 | 12.65 | 10.10 | 24.12 |
| 4 | 30 | 48.38 | 0.0688 | 0.6348 | 0.7148 | 23.56 | 23.36 | 32.39 |
| 5 | 20 | 42.90 | 0.0672 | 0.7541 | 0.8469 | 26.79 | 32.31 | 56.26 |
| 6 | 10 | 39.25 | 0.1078 | 0.8247 | 1.4269 | 57.24 | 50.31 | 70.23 |
| 7 | 0 | 37.96 | 0.1536 | 1.4406 | 2.3580 | 79.53 | 87.61 | 90.24 |
- L: longitudinal blasting distance; R′: the distance between detonation center and tower foundation.
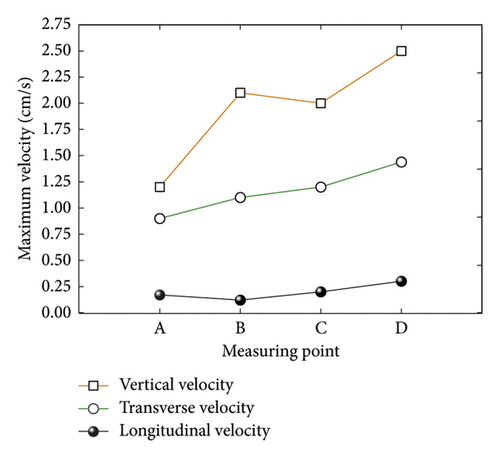
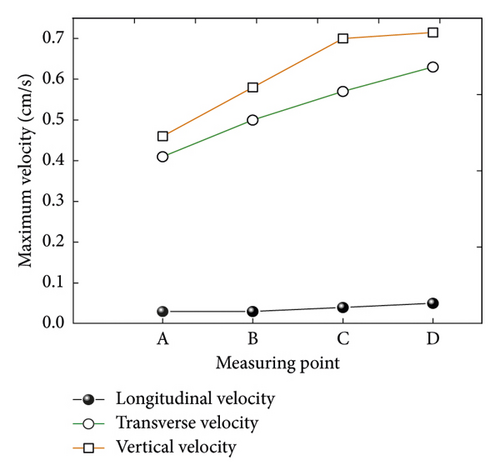
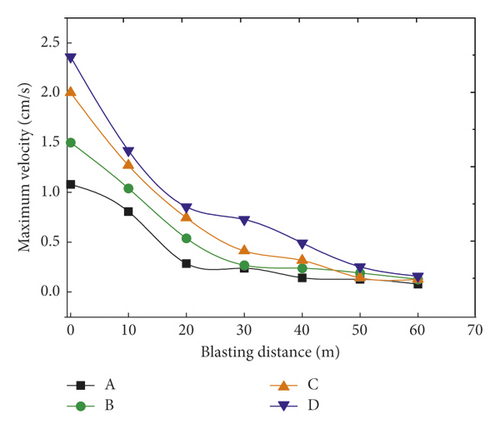
It can be clearly seen from the vertical vibration velocity diagram that the vibration velocity of the tower foundation in point D is the largest under the same blasting distance, and the attenuation law of vibration velocity in tower foundation measuring points C and A have little difference.
However, due to the undulating terrain, the propagation law of blasting vibration waves has its particularity that the vibration response of the ground surface directly above the excavation face may not be the most serious. Therefore, for further research based on the damage mechanisms induced by blasting vibration, scholars found that blasting vibration damage of tunnels is closely related with not only peak velocity but also its dominant frequency [41, 42]. More and more engineering practices show that it is not comprehensive to adopt a single peak velocity as safety criterion [43–45]. So it is reasonable to consider the combination of blasting vibration frequency and vibration velocity to evaluate the safety of surrounding buildings of the tunnel. The vibration frequency of the measuring point is mainly affected by the distance between detonation centers, the scale of blasting, and the characteristics of the propagation medium. Although the frequency distribution of the blasting vibration wave is relatively scattered, the vibration wave that causes the engineering problem is mainly caused by the frequency of the blasting vibration wave concentrate near the main frequency of buildings, which may cause a local or overall resonance effect of the building, causing damage to the surrounding buildings. Figures 10 and 11 show the energy spectrum of three directions of the vibration signal at monitoring point D in TN7 and TN3 at the field experiment (the TN letters represent the test number). Based on the analysis of the monitoring data, as shown in Table 4, the vertical vibration frequency of point D is generally higher than in the transverse direction. Figure 10 shows that vertical blasting vibration energy concentrates on 20∼30 Hz in the TN3, vertical main frequency at 24.12 Hz, transverse blasting vibration energy concentrates on 3∼10.5 Hz in the TN3, and transverse main frequency at 10.1 Hz. Meanwhile, the vertical blasting vibration energy is concentrated on 80∼100 Hz in the TN7 and vertical main frequency at 89 Hz. The transverse blasting vibration energy is concentrated on the 50∼90 Hz and transverse main frequency at 80 Hz. Apparently, the blasting vibration energy of the TN3 position is much smaller than the TN7. This is because with the increase of propagation distance, the high-frequency component of the blasting vibration wave attenuates faster than the low-frequency component because of the large damp in rock and soil and the selective absorption of the blasting vibration wave frequency by rock and soil medium [46]. Therefore, the distance between detonation centers at the TN3 field experiment is 54.49 m, the low frequency of the blasting vibration wave is concentrated, the distance between detonation centers at the TN7 field experiment is 37.00 m, and the high frequency of the blasting vibration wave is concentrated.
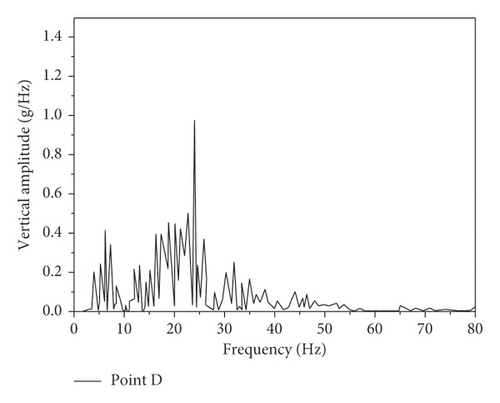
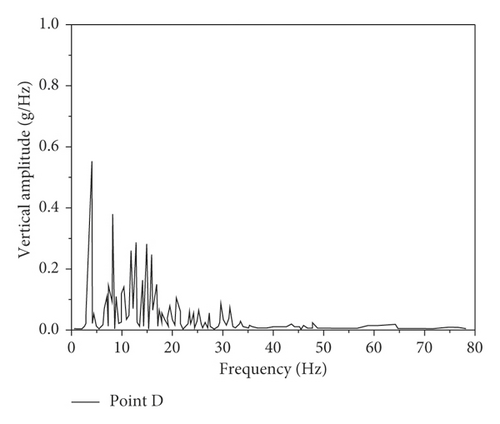
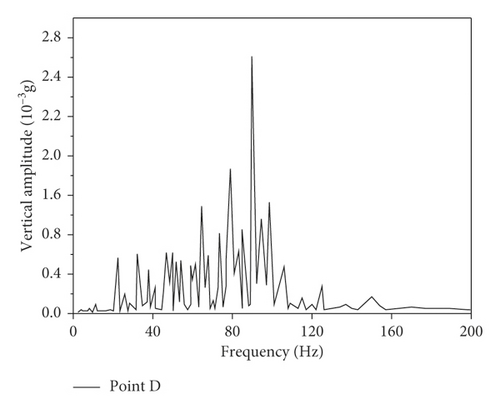
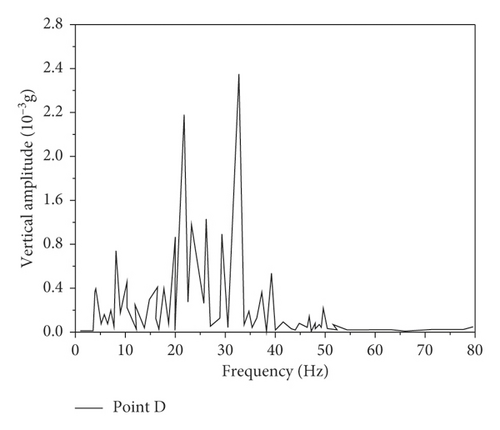
From the existing data [47, 48], it can be concluded that the natural frequency of tower ranges from 2.43 Hz to 10.68 Hz, which belongs to the lower frequency. When the main frequency of the blasting vibration wave is in the range of 2–11 Hz, even if the vibration velocity is relatively smaller, it may cause damage to the tower. Combining the existing monitoring data of Table 4 and Figures 10 and 11, it can be obtained that, when the L is 0 m, the maximum velocity of the measuring point is 2.35 cm/s, which is approximately to exceed the critical value of safe velocity of 2.5 cm/s, and the main frequency is 90.24 Hz; on the other hand, when the L is 30 m, the maximum vibration velocity is 0.48 cm/s. At this time, the main frequency of the blasting vibration is 10.1 Hz, which is already within the natural frequency of the tower range of 2∼11 Hz, which may result in tower to damage.
4. Numerical Simulation and Analysis
4.1. Model
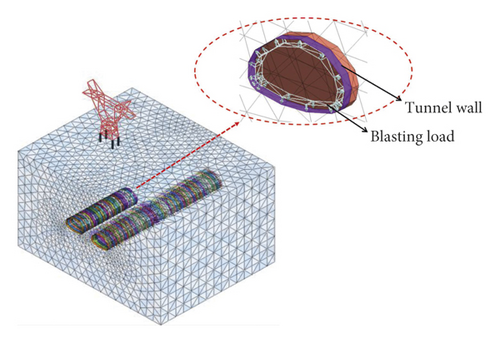
To compare numerical simulation results with the field measurement results, as well as to more fully understand the vibration characteristic of the tower main frame under the blasting, a three-dimensional finite element model was established by Midas-GTS finite element software, which was generally used to conduct the geotechnical analysis. Based on St. Venant principle [49, 50], it is appropriate to take three times of the size of tunnel face for left, right, and bottom parts of the model to reduce the influence of boundary effects. So, the model size is 150 m × 120 m × 90 m, as shown in Figure 12. The tunnel and surrounding rock adopts three-dimensional solid elements to simplify the high-voltage towers into beam structures, and this tower’s auxiliary material is Q235 steel with an elastic modulus of 201 MPa. The tower foundation adopts pile element, and surrounding rock adopts ideal Mohr–Coulomb’s failure criterion in the calculation. Based on the actual engineering geology situation, it is assumed that the rock mass and the surrounding rock are continuous media, and a IV-grade surrounding rock is adopted in the numerical simulation. Surrounding rock classification according to rock classification BQ (basic quality) (Ministry of Water Resources of the People’s Republic of China, 1995) and “Code for Design of Railway Tunnel,” a viscous boundary is used on the bottom and sides of the model, which is equivalent to set a separate damper at the boundary [51–54]. In the finite element software, first enter the unit area damping constants cs and cp and then the software will automatically calculate the cross-sectional area of each unit and apply the point spring to the unit node to form the model boundary.
Dai [57] through the research shows that, in the range of loading frequency of engineering blasting, the dynamic Poisson’s ratio is about 0.8 times the static Poisson’s ratio. The model parameters are revised according to the research results of the above scholars. The model parameters after revision are illustrated in Table 5.
| Material type | E (GPa) | γ (kN/m3) | μ | C (MPa) | θ (°) |
|---|---|---|---|---|---|
| Surrounding rock | 18.3 | 21.6 | 0.24 | 0.63 | 36 |
| Initial lining | 35 | 23 | 0.16 | 0.63 | 36 |
| Anchor | 210 | 78.5 | 0.3 | — | — |
| Tower | 201 | 78 | 0.2 | — | — |
| Tower foundation | 30 | 23 | 0.25 | — | — |
- E: elastic modulus; γ: bulk density; μ: Poisson’s ratio; C: cohesion; θ: internal friction angle.
4.2. Blasting Load
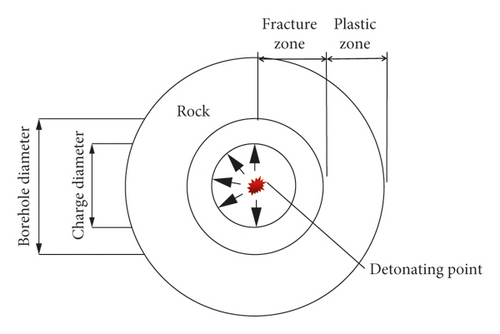
For simplify the model of the blasting hole, it is assumed that all the blasting holes are concentrated in one position. As shown in Figure 13, the load pressure acts on the blasting tunnel wall at the same time, and the acting direction is perpendicular to the normal of the surrounding rock.
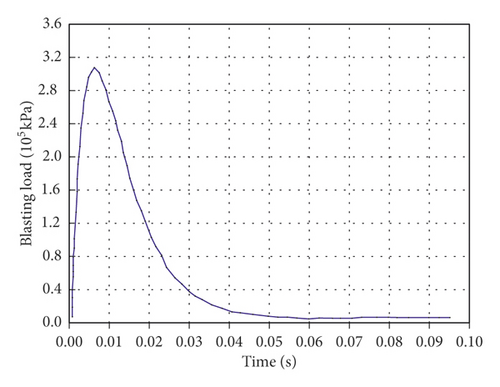
Time histories of blasting load are shown in Figure 15.
4.3. Simulation Result and Comparison
4.3.1. Analysis of Tower Foundation
To fully understand the dynamic response of the high tower during the blasting excavation and to better test the validity of the field test results, the velocity values of the measured point D under a different distance of the detonation center are obtained by using the finite element model [60–62]. The layout of model points is shown in Figure 5. Table 6 is a comparison between the numerical simulation results and the field test results, and it can be seen from the table that the velocity responses of the tower main frame obtained from the numerical simulation are in accordance with those from field monitoring data, even if the difference of response amplitude exists. A couple of comments are given to explain the difference: the parameters used in the numerical analysis of the tower structure subjected to the blasting loads may be divided into two major groups: surrounding rock parameters and blasting characteristics; the surrounding rock parameters are determinable or controllable where the blasting characteristics are most likely undetermined or uncontrollable.
| Test number | L | R′ | Max ν (field measurement) (cm/s) | Max ν (numerical simulation) (cm/s) | ||||
|---|---|---|---|---|---|---|---|---|
| Longitudinal | Transverse | Vertical | Longitudinal | Transverse | Vertical | |||
| 1 | 60 | 71.00 | 0.0155 | 0.1026 | 0.0925 | 0.019 | 0.1121 | 0.08 |
| 2 | 50 | 62.77 | 0.0239 | 0.2016 | 0.2579 | 0.0211 | 0.2004 | 0.2451 |
| 3 | 40 | 55.14 | 0.0356 | 0.4539 | 0.4835 | 0.0284 | 0.4462 | 0.4729 |
| 4 | 30 | 48.38 | 0.0688 | 0.6348 | 0.7148 | 0.0594 | 0.5763 | 0.7012 |
| 5 | 20 | 42.90 | 0.0672 | 0.7541 | 0.8469 | 0.0631 | 0.7421 | 0.8416 |
| 6 | 10 | 39.25 | 0.1078 | 0.8247 | 1.4269 | 0.1024 | 0.8127 | 1.5243 |
| 7 | 0 | 37.96 | 0.1536 | 1.0406 | 2.3580 | 0.1496 | 1.0241 | 2.192 |
- L: longitudinal blasting distance; R′: distance between detonation center and tower foundation.
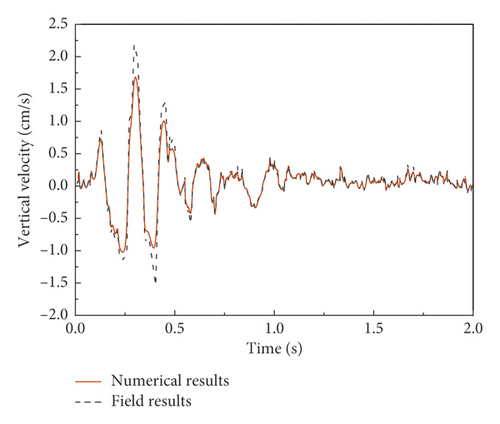
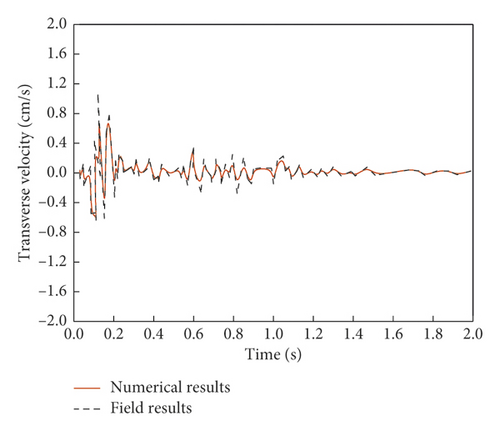
Through numerical simulation, the comparison results of velocity history time between the field test and numerical analysis of point D are obtained. As shown in Figure 16, the vertical velocity and transverse velocity have similar shape and characteristics with the field test. After blasting, the response amplitude of vibration velocity increases obviously; the waveform fluctuates greatly, as time approaches infinity and the velocity responses all diminish to zero. Furthermore, vertical velocity of the measuring point is obviously greater than transverse velocity. Table 6 shows that the maximum transverse and vertical velocities are 2.3 cm/s and 1.16 cm/s, respectively, in point D.
4.3.2. Vibration Velocity
In response to more comprehensively analyze the dynamic response of blasting vibration to the high tower above the tunnel and combined with the existing research conclusions, the vibration velocity response of the measuring points at different heights of the high tower is analyzed.
Figure 17 shows the peak velocity of particles in three directions when the L is 0 m. The peak vibration velocity increases with the height of the particle and reaches a maximum at the top of the tower. When the height of the particle is 30 m, the maximum velocity of the vertical vibration is 4.12 cm/s. Compared with the transverse velocity of 1.44 cm/s and the longitudinal velocity of 1.79 cm/s, the vertical vibration velocity has a great influence on the tower, and this should be taken seriously. The particle velocity at the height of 0 m is the velocity of the measured point of the tower foundation. It can be seen that the peak velocity of the three directions of blasting is greater than the peak velocity of tower foundation during the process of blasting at any height of the particle in the tower. It shows that the vibration velocity of the tower has an amplification effect under the blasting vibration.
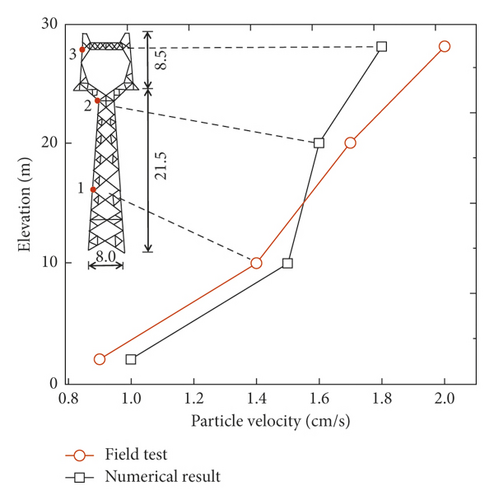
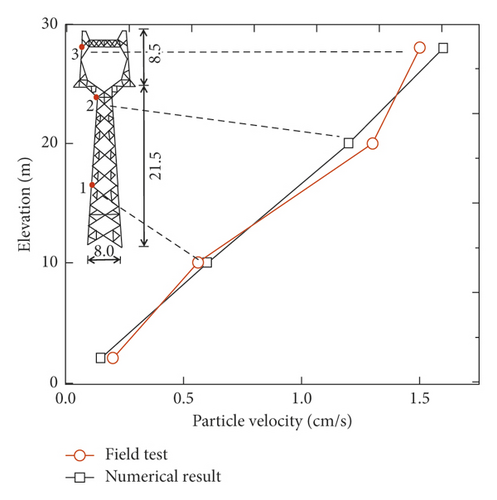
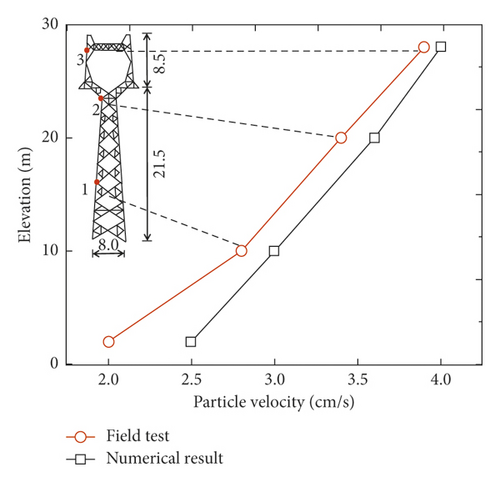
As shown in Figure 17, there are some difference between field test data and numerical data, but both fit well. The maximum difference is 0.5 cm/s which occurs at point 1 in the vertical direction. Due to the presence of jointed rock in actual projects, rock in numerical simulation is assumed the homogeneous body, so a small deviation of the results can be understood. In addition, the particle velocity generally shows an upward trend.
4.3.3. Tower Axial Force
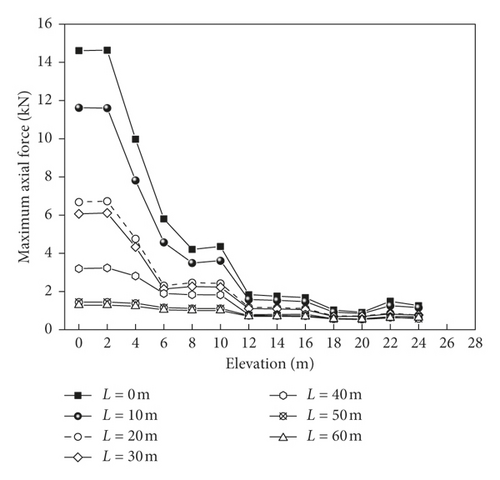
Figure 18 shows the maximum axial force distribution of the tower member at different heights in the process of blasting construction. The maximum axial force decreases gradually with the increase in height of the measuring point. When the measuring point height is greater than 12 m, the maximum axial force decays slowly and gradually stabilizes. In general, at the same height of the tower, the axial force value increased with an decrease in distance between the detonation centers and tower. The maximum value of the axial force that occurs at the tower bottom is 14.8 kN when the distance between the detonation centers is 0 m.
4.3.4. Tower Foundation Displacement
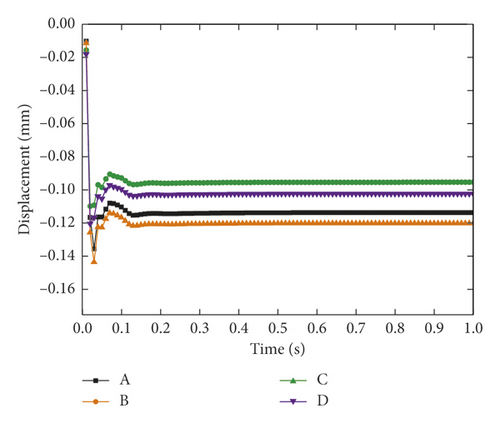
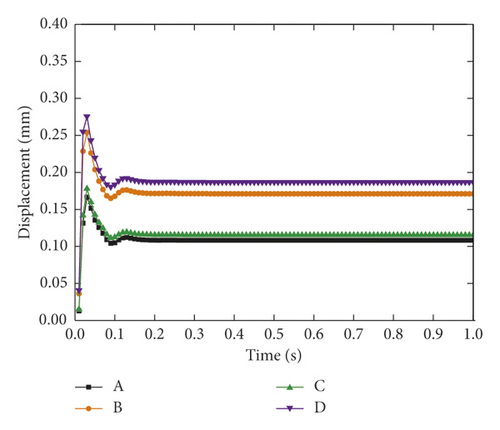
The vibration velocity reaches the maximum value, when the longitudinal distance between the tower and the detonation center is 0 m, which easily causes strong disturbance to the tower, and the tower foundation is prone to uneven settlement leading to the inclination of the tower. Therefore, the displacement of tower foundation is analyzed when the tower and the detonation center is 0 m. Figure 19 shows the displacement-time history curve of the measuring point of the tower foundation: the positive value represents the uplift, and the negative value represents the settlement. After blasting, the displacement value of the measuring point increases obviously and reaches the maximum value when t = 0.01 s. As time approaches infinity, the displacement value attenuates notably and gradually stabilizes. The peak values of transverse and longitudinal displacement are −0.14 mm and 0.065 mm, respectively, which have little influence on the stability of the tower. The figure reveals that the maximum vertical displacement value is 0.28 mm located at point D, and the minimum vertical displacement value is 0.16 mm located at point A. The settlement difference between the measuring points is only about 0.12 mm. According to the specification, the uneven settlement value of the tower foundation is within the safety range, which will not cause the tower to incline or collapse.

5. Discussion
Based on the monitoring data and numerical results of the tower subjected to blasting loads, the maximum vertical and transverse velocities of the tower foundation are 2.358 cm/s and 1.04 cm/s, respectively, when blasting distance is 0 m. The former value is quite close to the allowable upper limits of 2.5 cm/s based on the Chinese code for blasting safety standards (1999), and so the performance of the tower under the blasting construction is in a critical state of safety. Moreover, at this time, the main frequency of blasting is in the range of 80.2 Hz∼90.24 Hz. It can be taken as an indication that the blasting construction scheme should be implemented carefully. When the distance between the detonation centers is 30 m, the maximum vibration velocity of the measuring points is 0.48 cm/s. At this time, the blasting vibration velocity is smaller than the limiting blasting velocity, and the transverse blasting main frequency is 10.01 Hz. Through a number of field model tests of the existing high-voltage tower structure, it can be concluded that the tower natural frequency is approximately in the range of 2.43–10.68 Hz, which belongs to the lower frequency. Therefore, when the main frequency of tower, under the process of blasting, is within its natural frequency range, even if the vibration velocity is small, it may cause the resonance damage of the tower. When the detonation center distance is 30 m, the difference between the main frequency and the natural frequency of the tower is small, which may cause the resonance damage of the tower.
- (1)
When the detonation distance is 30 m, the blasting vibration velocity is small, which has no effect on the high tower, but the smaller difference between the main vibration frequency and the natural frequency of the high tower is likely to cause the tower to be resonantly destroyed. Therefore, for reducing the effects of the blasting impact on the high tower, it is necessary to take measures to improve the overall stiffness and integrity of the tower or to set up vibration isolation ditches to reduce the output energy of the vibration induced by the blasting progress.
- (2)
When the detonation center distance is 0 m, the blasting vibration velocity has great influence on the existing tower, which is close to the safety critical value. It is necessary to change blasting parameters such as drilling depth and charge quantity or using electronic detonators to reduce blasting vibration.
- (3)
Some protect measures should be proposed when the longitudinal distance between detonation center and tower is around 30 m and 0 m.
6. Conclusion
- (1)
When L is 0 m, the maximum vibration velocity was 2.358 cm/s in measuring point D, which is close to the safety control standard of 2.5 cm/s. The tower response decreases with the increase of distance from the detonation center, due to the diminution of the compressive waves in the surrounding rock. Moreover, the vertical velocity of the measuring points is obviously higher than that of other directions, which indicate that the blasting energy mainly propagates in the vertical direction.
- (2)
The vibration frequency of the measuring point D is measured. It illustrated that when the longitudinal blasting distance is 30 m, the main frequency of the blasting vibration is 10.1 Hz, which is close to the natural frequency of the tower, which is easy to cause resonance damage. The nearer the detonation centers is to the tower, the faster the attenuation of vibration velocity is, and the farther the distance is to detonation centers, the slower the attenuation of vibration velocity is. When the longitudinal distance between detonation centers and tower is 0 m, the vibration velocity is 2.38 cm/s, which is close to the safety critical value of 2.5 cm/s, which is easy to cause damage to the tower. So the blasting construction scheme should be implemented carefully when the longitudinal distance between detonation center and tower is approximately 30 m and 0 m.
- (3)
As for the main frequency of vibration, the main frequency of the vertical direction is generally higher than that of the transverse and longitudinal directions. The farther the detonation centers is from the tower, the lower the frequency is, and the nearer the detonation centers is to tower, the higher the frequency is.
- (4)
Irrespective of the height of the measuring point in the tower main frame, the three-direction peak velocity is greater than that of the measuring point of tower foundation. As the height of the measuring point in the tower main frame increases, the vibration velocity also increases and reaches the maximum at the top of the tower. Furthermore, the maximum axial force decreases gradually with the increase in height of the measuring point. When the tower measuring point height is greater than 12 m, the maximum axial force decays slowly and gradually stabilizes.
Conflicts of Interest
The authors declare that there are no conflicts of interest regarding the publication of this paper.
Acknowledgments
This work was financially supported by the National Key R&D program of China (no. 2018YFC0808706) and the Project on Social Development of Shaanxi Provincial Science and Technology Department (nos. 2018SF-382 and 2018SF-378).
Open Research
Data Availability
The data used to support the findings of this study are available from the corresponding author upon request.


