Analysis of the Main Factors Influencing the Dominant Frequency of Blast Vibration
Abstract
At present, the study on the dominant frequency of blasting vibration is still a worldwide problem. Compared with the mature research on the particle peak velocity of blasting vibration, the researches on the dominant frequency of blasting vibration are much less. In this paper, by analyzing the main influencing factors of the dominant frequency, an attenuation equation of the dominant frequency induced by blasting vibration has been proposed by dimensional analysis combined with the theory of radial spherical wave propagation. The proposed equation is applied to the fitting analysis on the dominant frequency measured in Zhoushan Green Petrochemical Base in China, which has obtained a favorable fitting correlation. Based on the fitting analysis, it has found that the correlation coefficient of radial vibration obtained by the proposed equation is higher than that of vertical vibration, which is resulted from the reason that the vibration in vertical is considered to be influenced most by the R-wave on the ground and perceived to be quite different from the radial vibration affected by P-wave. In generally, different components of blasting waves will affect the attenuation of dominant frequency.
1. Introduction
Blasting excavation has been widely used in mining, water and hydropower engineering, highway, municipal infrastructure construction, and other fields [1]. Although blasting is an indispensable, efficient, and economical excavation technology, it inevitably brings adverse effects on the surrounding buildings and environment. In order to control the blasting vibration, it is necessary to predict the vibration induced by blasting [2]. In recent years, the research on blasting vibration velocity has formed a mature system, and peak particle velocity (PPV) is often used as a criterion for evaluating blasting vibration safety [3]. By contrast, the study on the prediction of blasting vibration frequency is much less. In fact, more and more researches revealed that when the dominant frequency of blasting vibration is close to the natural frequency of the structure, it will produce resonance effect and easily cause damage to the structures, even if the PPV is in the range of safety standard [4, 5]. Therefore, it is also of great significance to study the attenuation law of the dominated frequency to keep the underprotected structure stability and safety.
The dominant frequency induced by blasting is affected by many factors, including characteristics of explosion source, distance away from explosion source, and physical-mechanical properties of rock [6]. Among them, Zhong et al. [7] have found that the dominant frequency band shifts from mid-high frequency to low frequency and the dominant frequency band become more concentrated with the increase of the distance away from explosion source, the charge weight per delay, and the decrease of the number of delay in millisecond detonation. Yang et al. [8] has found that the vibration frequency of breaking blasthole of full-face millisecond delay blasting in underground opening excavation increases as the burden decreases. Ling et al. [9] have studied the difference of energy distribution characteristics of blasting vibration signals in frequency domain under single-delay blasting and multidelay millisecond blasting by using wavelet analysis technology. Tripathy and Gupta [10] have indicated that the vibration induced by blasting is diversified with the rock and geological condition.
The majority of factors affecting the dominant frequency of blasting vibration can hardly be described quantitatively. As a result, it is very difficult to accurately obtain the attenuation law of the dominant frequency [11]. Generally speaking, the dominant frequency of blasting vibration decreases exponentially with the increase of the distance away from the explosion source due to the high-frequency filtering characteristics of rock [12]. In recent years, with the progress of the analysis technique of blasting vibration spectrum, many prediction formulas have been proposed by using the method of artificial neural network [13], support vector machine [14], and gene expression programming [15]. Although these formulas can obtain favorable fitting correlation, they are difficult to apply in engineer practice because of its too complex fitting parameters and calculation. Therefore, it is necessary to obtain a simple and practicable formula, which can reflect the changes of the dominant frequency with distance.
2. The Attenuation Equation of Dominant Frequency Induced by Blasting
2.1. Analysis of Main Influencing Factors of the Dominant Frequency
The explosive releases enormous energy in the process of blasting in rock, which mainly transforms into blasting shock wave, stress wave, and blasting gas. In the process of stress wave propagation in rock, due to the energy attenuation of wave and the damp absorption effect of rock, the properties and waveforms of stress wave will change correspondingly with distances. It will form the crushing zone, cracking zone, and elastic zone successively with the distance far from the blastholes [1]. In order to analyze the propagation and attenuation of blasting seismic wave by using elastic wave theory, the inelastic zone (crushing zone and cracking zone) near the blastholes is equivalent to the blasting source, and the blasting load is acted on the equivalent elastic boundary (cracking boundary, i.e., the outer boundary of the crushing zone). Therefore, the theoretical solution of the elastic wave excited by a spherical cavity in an elastic medium can be adopted, and the theoretical solution is given by Favreau [16].
It can be concluded from equation (7) that the main influencing factors of velocity spectrum include three aspects: firstly, the distance away from blasting source r, secondly, the parameters of rock λ, μ, ν, and CP, and finally, the parameters of blasting, such as the radius of elastic cavity (the cracking zone) a and load parameters ae, be, and τ.
In practical, compared with spherical charge, cylindrical charge is used in open-pit blasting excavation more frequently, which is in advantage of its more uniform distribution of explosive energy in rock mass. Although the theoretical solution discussed previously is aiming at the spherical charge, in fact, analysis of the experimental data showed that blasts of cylindrical charges are similar to the processes observed in seismic investigations of blasts with spherical charges [17]. This is because spherical and cylindrical waves excited by spherical or cylindrical explosive sources can be regarded as plane waves when they propagate to the far region [1]. If the elastic cavity formed by cylindrical charge blasting is regarded as an equivalent blasting source, the blasting load will be applied to the boundary of the elastic cavity. The radius of the equivalent blasting source will be the radius of the boundary of the elastic cavity a, as shown in Figure 1.
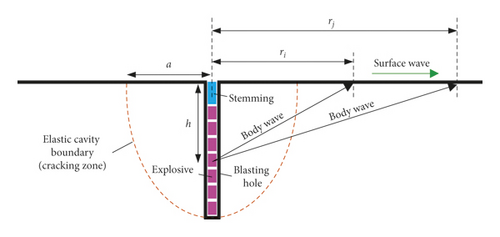
However, in the process of cylindrical charge blasting, some explosive energy will propagate in the form of stress wave in rock. According to the different propagation paths of wave, it can be divided into body wave and surface wave. The propagation of body wave in rock mass can be divided into compressive wave (P-wave) and shear wave (S-wave). In terms of the existence of the surface free surface, the surface wave (S-wave) will also appear on the surface free surface of the semi-infinite space, which is the most significant symbol different from the spherical charge blasting in infinite rock mass. In fact, studies have shown that, for vertical hole blasting, the P-wave is an important component for both near and far distance, and it mainly acts on the horizontal and radial vibrations; the S-wave is only the dominant wave in the near zone, and its role in the far zone can be neglected; the R-wave grows and develops gradually at a farther distance, and it will have a major impact on vertical vibration [2]. Therefore, if taking the elastic cavity formed by cylindrical blasting as a spherical blasting source, the radial vibration induced by the cylindrical blasting source will be closer to the vibration induced by the spherical blasting source than that of vertical direction, as shown in Figure 1.
Considering the condition of single-hole blasting, the multiple-hole blasting is equivalent to the elastic superposition of each single hole, as shown in Figure 2.
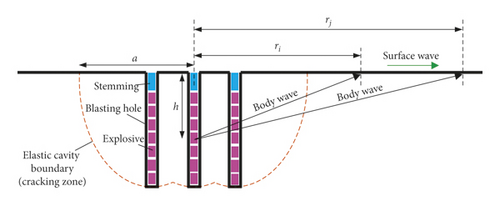
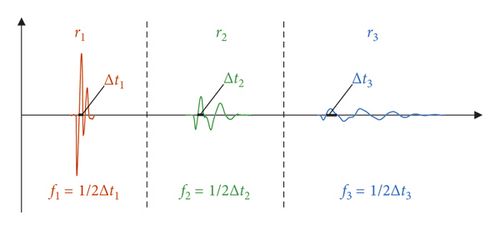
Figure 3 illustrates the changes of the dominant frequency of blasting vibration with distance, where the distance away from the blasting source is r1 < r2 < r3 and the dominant frequency of each distance is f1 > f2 > f3. The dominated frequency used to fitting analyzing in this paper is zero-crossing dominant frequency, which is also shown in Figure 3, and it is the most commonly used form of dominant frequency when the waveform has a clear peak [2].
2.2. Dimensional Analysis of the Dominant Frequency
It is known from the previous analysis that the vibration induced by elastic spherical cavity mainly depends on the longitudinal wave velocity CP, the radius of the elastic cavity a, the density of the rock ρ, the charge weight Q, and the distance between the blasting source with the measuring points r, as shown in Table 1.
| Parameter | Unit (dimension) |
|---|---|
| Longitudinal wave velocity | m/s (LT−1) |
| Radius of elastic cavity | m (L) |
| Distance between the blasting source with the measuring points | m (L) |
| Charge weight per delay | kg (M) |
| Density of rock | kg/m3 (ML−3) |
Among all the parameters shown in Table 1, a, CP, and ρ are independent with each other and include three basic dimensions of measurement: mass M, length L, and time T, which are selected as the main parameters of the dominated frequency by using the dimensional analysis method.
In mining bench blasting, bench height H is generally adopted as (1.5–2.0)B, stemming length is (0.7–1.0)B, drilling depth is 0.3B, blastholes spacing S = (1.0–2.0)B, and row spacing B and drilling diameter d have a relationship of B = (25–35)d [1]. So, according to the assumption in Section 2.1 and the proportional relationship among different blasting parameters mentioned above, equation (15) is still valid for cylindrical charge blasting.
3. Fitting of Frequency Attenuation Law of Open-Pit Blasting in Zhoushan Petrochemical Base
3.1. Engineering Background
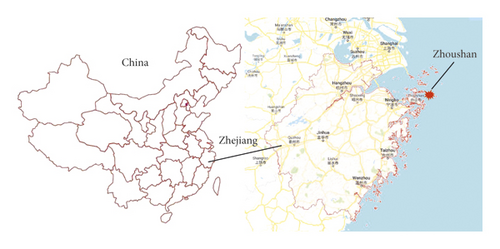
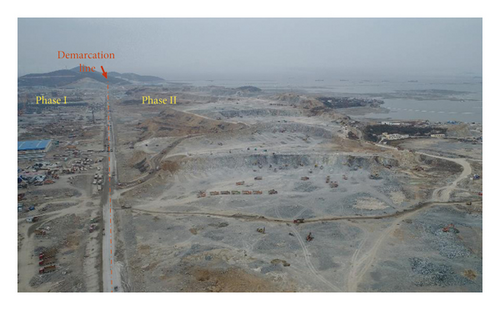
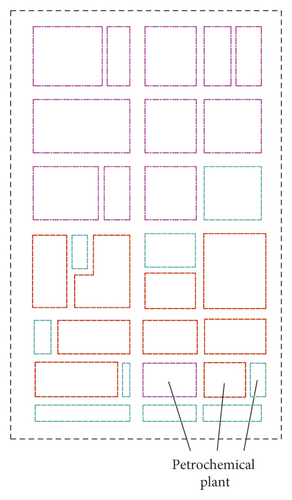
Zhoushan Green Petrochemical Base is located in Zhoushan City, Zhejiang Province, China. As shown in Figure 4, the project plans to reclaim 41 square kilometers of land area with Dayu Mountain as its core and build an island-type, modern, and ecological petrochemical base. The base is built in two phases where phase II is under excavation, as shown in Figure 5. The square quantity exploited by blasting is about 47 million cubic meters, and the open-pit excavation period is about 20 months in phase II.
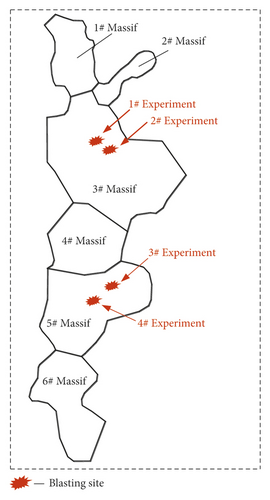
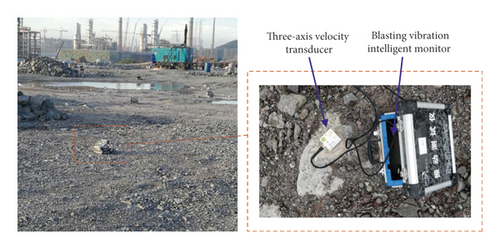
Two blasting sites have been arranged in phase II, as shown in Figure 6. There are two blasting experiments in each of the both blasting sites, which have been analyzed in order to verify the effectiveness of the proposed equation. The dominant frequency of the field measured blasting from 1# and 2# experiments in 3# massif to 3# and 4# experiments in 5# massif will be selected to fitting analyze. The vibration logging and analysis system used in field observation consists of three parts: three-axis velocity transducers, a blasting vibration intelligent monitor (Blast-UM), and computers installed with Blast-UM software used to withdraw and process test data. Typical blasting measuring points and devices are shown in Figure 7.
3.2. Experiments in 3# Massif
1# and 2# experiments are conducted in the platform with elevation of 16 m in 3# massif. 1# experiment is located on the northwest side of the platform, and 2# experiment is located on the north side of the platform. The diameter of the blasting holes is 115 mm, and the diameter of the explosive is 90 mm. The detailed blasting parameters of the two experiments are shown in Table 2.
| Blast site | 3# massif | |||
|---|---|---|---|---|
| Experiment | 1# | 2# | ||
| Blastholes | Multiple | Single | Multiple | Single |
| Blasthole diameter (mm) | 115 | 115 | 115 | 115 |
| Blasthole length (m) | 13.2–14.9 | 14.8 | 12.7–14.7 | 14.2 |
| Blasthole spacing (m) | 4.5 | — | 4.5 | — |
| Row spacing (m) | 4.5 | — | 4.5 | — |
| Charge diameter (mm) | 70/90 | 90 | 70/90 | 90 |
| Charge weight per hole (kg) | 66–90 | 90 | 69–93 | 87 |
| Stemming length (m) | 4.0–5.5 | 4.0 | 4.5 | 4.5 |
| Number of rows | 4 | — | 4 | — |
| Number of blastholes | 116 | 1 | 126 | 1 |
In 1# and 2# experiment, a single-hole blasting was set in the last delay of the multiple-hole blasting to observe the dominant frequency attenuation law of single-hole blasting and multiple-hole blasting, respectively. Among them, six and eight surface blasting vibration measurement points were arranged in 1# and 2# experiment, respectively. The multiple-hole blasting is detonated by holes, MS3 detonators are used between holes, MS5 detonators are used between rows, and single-hole blasting and multiple-hole blasting are separated by the MS10 detonator. MS3/MS5/MS10 represent the millisecond with 50/110/650 ms, as shown in Figures 8 and 9. And a stereo sketch of the layout of measuring points is provided in the red-dotted frame.
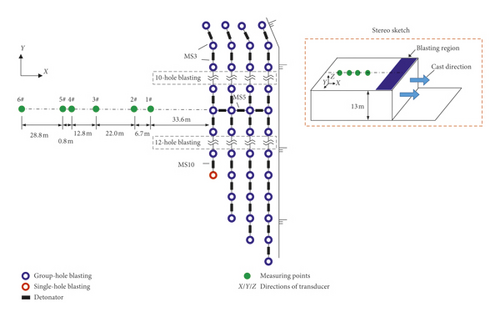
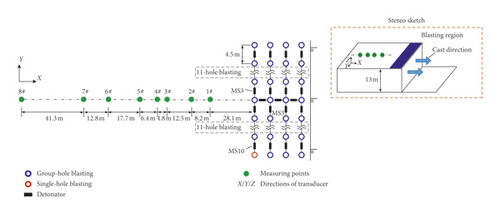
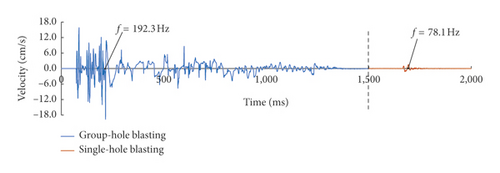
Figure 10 gives the typical time history curves of blasting vibration of the 1# measuring point in 1# experiment as an example. Blasting vibration is divided into two parts: the front part is multiple-hole blasting and the rear part is single-hole blasting. In order to facilitate observation, different colors are used to indicate the blasting vibration. The dominant frequency of the two parts is marked in the figure.

The values of dominant frequency of single-hole and multiple-hole blasting are given in Table 3.
| Experiment | Blasthole | Direction | Dominant frequency (Hz) | |||||||
|---|---|---|---|---|---|---|---|---|---|---|
| 1# | 2# | 3# | 4# | 5# | 6# | 7# | 8# | |||
| 1 | Single | X | 98.0 | 61.7 | 50.0 | 67.7 | 63.3 | 50.5 | 39.1 | 40.7 |
| Y | 58.1 | 84.7 | 79.4 | 76.9 | / | 53.8 | 34.5 | 33.3 | ||
| Vertical | 100.0 | 70.4 | 47.6 | 70.4 | 48.1 | 43.5 | 35.5 | 35.5 | ||
| Multiple | X | 135.1 | 80.6 | 151.3 | 136.8 | 138.9 | 63.2 | 28.2 | 26.6 | |
| Y | 192.3 | 108.7 | 94.3 | 131.5 | 104.2 | 54.9 | 30.4 | 30.6 | ||
| Vertical | 125.0 | 100.0 | 102.0 | 104.2 | 89.3 | 48.1 | 38.4 | 30.2 | ||
| 2 | Single | X | 83.3 | 89.3 | 84.7 | 54.6 | 47.6 | 52.6 | — | — |
| Y | 111.1 | 89.3 | 53.5 | 35.2 | 53.2 | 52.1 | — | — | ||
| Vertical | 72.5 | 83.3 | 72.5 | 35.5 | 44.2 | 43.5 | — | — | ||
| Multiple | X | 166.7 | 108.7 | 113.6 | 84.3 | 68.5 | 42.6 | — | — | |
| Y | 156.3 | 200.0 | 83.3 | 33.3 | 58.8 | 58.8 | — | — | ||
| Vertical | 92.9 | 89.3 | 65.8 | 46.9 | 48.1 | 48.1 | — | — | ||
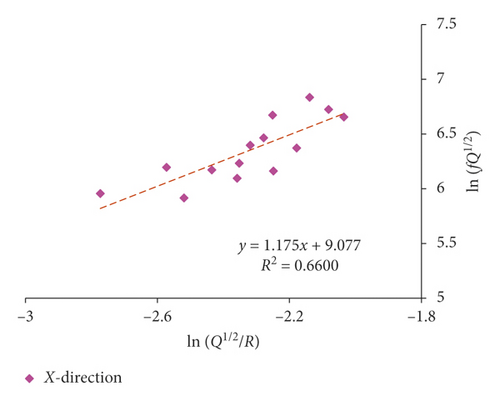
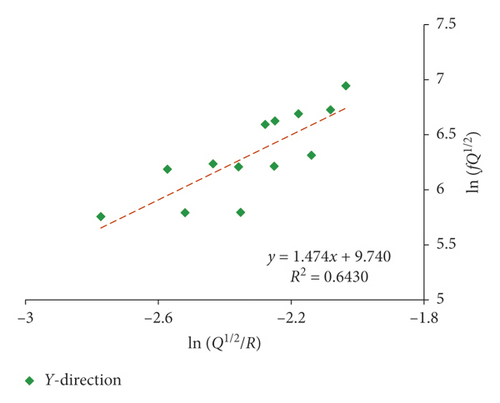
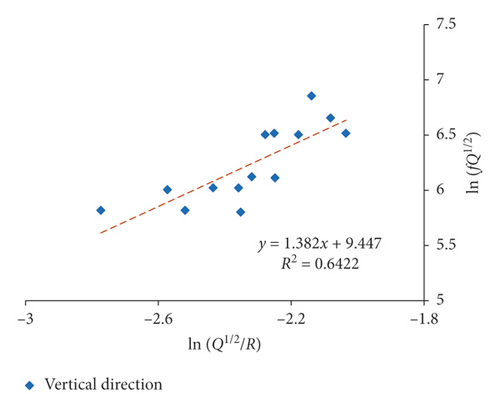
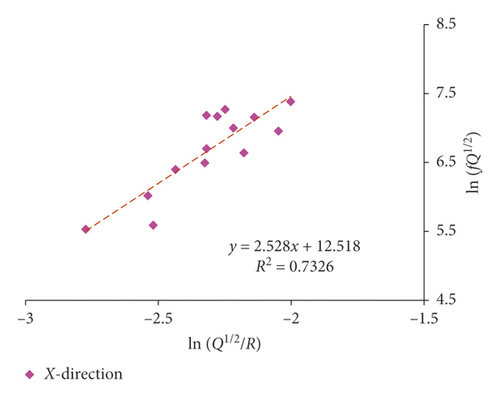
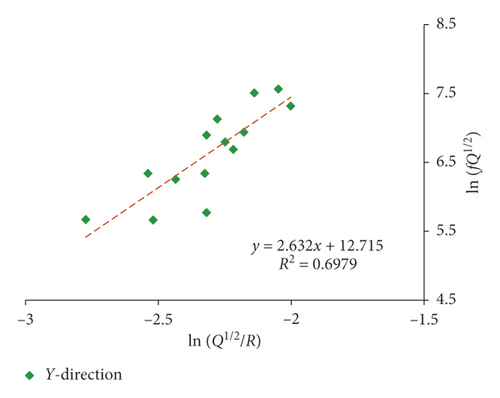
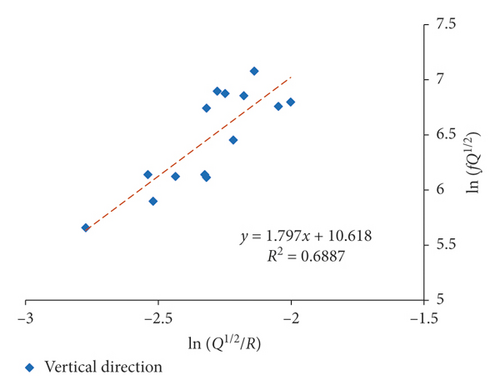
Since both 1# and 2# experiments were carried out in 3# massif, they were fitted together. Multiple-hole blasting is different from single-hole blasting in vibration waveform and spectrum characteristics due to the superposition and the influence of detonator delay. As a result, single-hole blasting and multiple-hole blasting are fitted separately. The fitting results of the attenuation rule for the dominant frequency of single-hole and multiple-hole blasting by equation (16) are presented in Figures 11 and 12 and Table 4.
| Equation | Blastholes | X-direction | Y-direction | Vertical | |||
|---|---|---|---|---|---|---|---|
| Equation | Correlation coefficient | Equation | Correlation coefficient | Equation | Correlation coefficient | ||
| (17) | Single | r2 = 0.660 | r2 = 0.643 | r2 = 0.642 | |||
| Multiple | r2 = 0.733 | r2 = 0.698 | r2 = 0.689 | ||||
The proposed equation (17) generally has obtained a favorably correlation coefficient in 3# massif. The dominant frequency of blasting vibration in multiple-hole blasting is decaying faster than that in single-hole blasting, which is also confirmed by Zhang et al. [20]. In addition, the fitting correlation coefficient of dominant frequency in X-direction is generally higher than that of the other two directions, and the vertical direction obtains the worst relevance, which is in compliance with previous discussion that the radial vibration is normally perceived to be related to the P-wave, while the vibration in vertical is normally considered to be influenced most by the R-wave reflected by the free face on the ground [2]. As a result, for surface vibration, the fitting correlation coefficient of radial vibration is higher than that of vertical vibration.
3.3. Experiments in 5# Massif
3# and 4# experiments are conducted in the platform with elevation of 30 m in 5# massif. 3# experiment is located on the northeast side of the platform, and 4# experiment is located on the north side of the platform. The diameter of the blasting holes is 115 mm, and the diameter of the explosive is 90 mm. The detailed blasting parameters of the two experiments are shown in Table 5.
| Blast site | 5# massif | |||
|---|---|---|---|---|
| Experiment | 3# | 4# | ||
| Blastholes | Multiple | Single | Multiple | Single |
| Blasthole diameter (mm) | 115 | 115 | 115 | 115 |
| Blasthole length (m) | 10.6–13.3 | 13.0 | 14.4 | 14.8 |
| Blasthole spacing (m) | 6.0 | — | 6.1 | — |
| Row spacing (m) | 3.6 | — | 3.5 | — |
| Charge diameter (mm) | 90 | 90 | 90 | 90 |
| Charge weight per hole (kg) | 60–72 | 72 | 84/96/108 | 96 |
| Stemming length (m) | 4.5 | 4.5 | 5.0 | 5.0 |
| Number of rows | 5 | — | 6 | — |
| Number of blastholes | 40 | 1 | 54 | 1 |
In 3# and 4# experiment, besides the multiple-hole blasting, a single-hole blasting was also set up to observe the dominant frequency attenuation law of single-hole blasting and multiple-hole blasting, respectively. Among them, seven and five surface blasting vibration measurement points were arranged in 3# and 4# experiments, respectively. The multiple-hole blasting is detonated by holes, MS3 detonators are used between holes, MS5 detonators are used between rows, and single-hole blasting and multiple-hole blasting are separated by the MS10 detonator. MS3/MS5/MS13 represent the millisecond with 50/110/650 ms, as shown in Figures 13 and 14. And a stereo sketch of the layout of measuring points is also provided in the red-dotted frame.
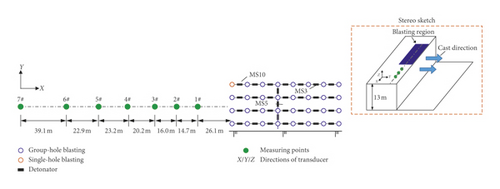
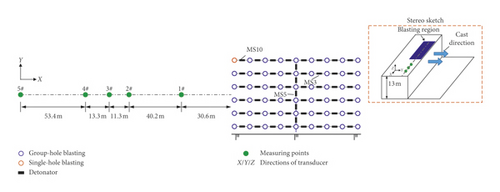
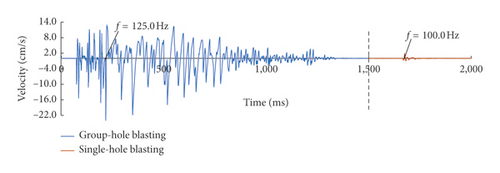
Figure 15 gives the typical time history curves of blasting vibration of the 3# measuring point in 3# experiment as an example. Blasting vibration is divided into two parts: the front part is multiple-hole blasting and the rear part is single-hole blasting. In order to facilitate observation, different colors are used to indicate the blasting vibration. The dominant frequency of the two parts is marked in the figure.
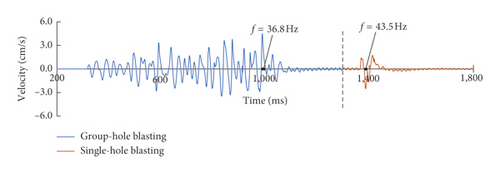
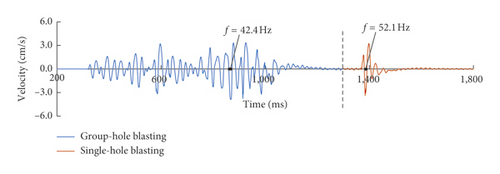
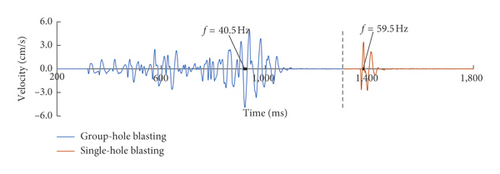
The values of dominant frequency of single-hole blasting and multiple-hole blasting are given in Table 6.
| Experiment | Blasthole | Direction | Measuring points number | ||||||
|---|---|---|---|---|---|---|---|---|---|
| 1# | 2# | 3# | 4# | 5# | 6# | 7# | |||
| 3 | Single | X | 75.8 | 93.9 | 43.5 | 56.2 | 42.7 | 28.1 | 25.0 |
| Y | 78.1 | — | 52.1 | 71.9 | 46.3 | 30.9 | 26.0 | ||
| Vertical | 60.2 | 54.9 | 59.5 | 60.3 | 49.0 | 33.8 | 27.8 | ||
| Multiple | X | 94.3 | 48.5 | 36.8 | 41.3 | 36.7 | 22.5 | 18.7 | |
| Y | 89.3 | 48.3 | 42.4 | 38.5 | 34.2 | 31.4 | 21.9 | ||
| Vertical | 64.7 | 48.5 | 40.5 | 46.7 | 45.5 | 27.5 | 26.5 | ||
| 4 | Single | X | 68.5 | 56.8 | 34.7 | 45.9 | 36.8 | — | — |
| Y | 73.5 | 54.3 | 45.5 | 36.5 | 37.0 | — | — | ||
| Vertical | 66.7 | 54.9 | 54.3 | 49.5 | 37.2 | — | — | ||
| Multiple | X | 84.7 | 45.9 | 36.0 | 32.5 | 37.7 | — | — | |
| Y | 78.1 | 63.3 | 53.8 | 31.1 | 34.5 | — | — | ||
| Vertical | 62.5 | 40.3 | 36.5 | 41.7 | 36.5 | — | — | ||
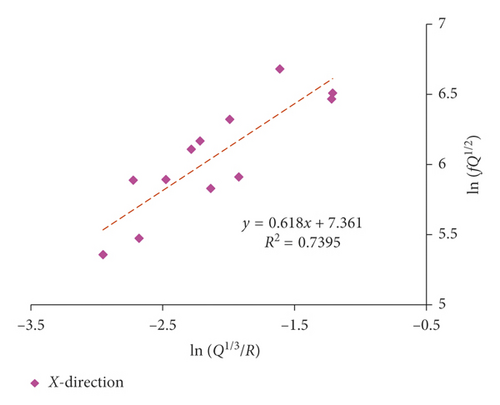
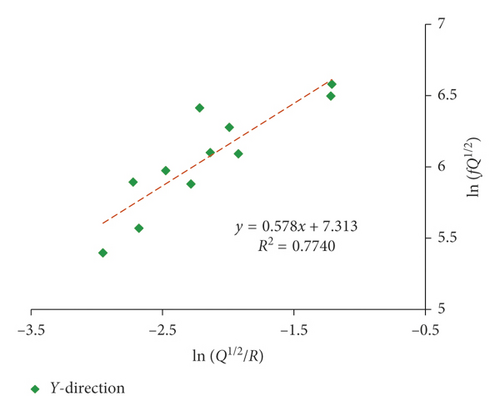
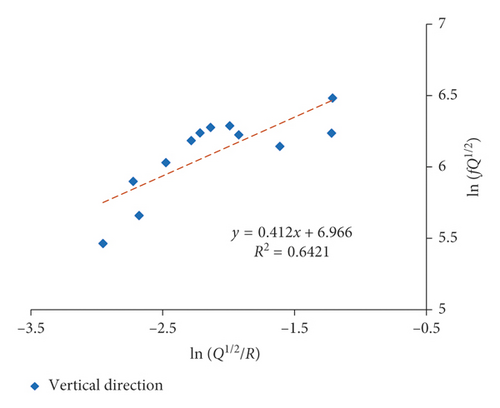
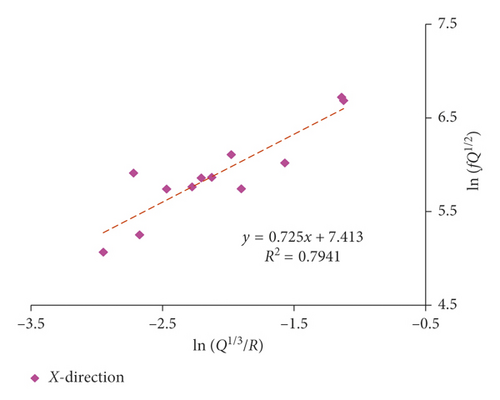
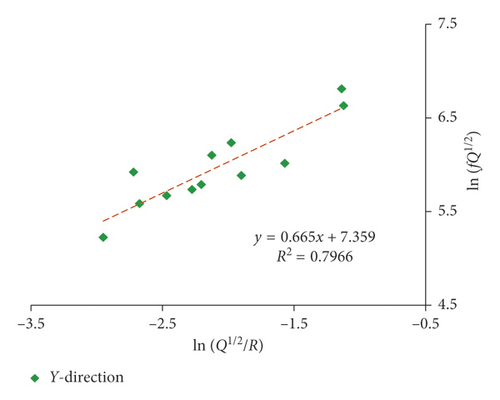
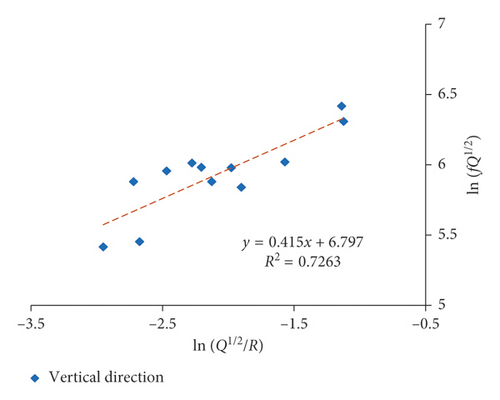
The fitting results of the dominant frequency by equation (17) are presented in Figures 16 and 17 and Table 7.
| Equation | Blastholes | X-direction | Y-direction | Vertical direction | |||
|---|---|---|---|---|---|---|---|
| Formula | Correlation coefficient | Formula | Correlation coefficient | Formula | Correlation coefficient | ||
| (17) | Single | r2 = 0.740 | r2 = 0.774 | r2 = 0.642 | |||
| Multiple | r2 = 0.794 | r2 = 0.797 | r2 = 0.726 | ||||
The proposed equation (17) also has obtained a favorable correlation coefficient in 5# massif. And the fitting correlation coefficient of dominant frequency in X-direction is still higher than the vertical direction. Moreover, both of the amplitude and the attenuation speed of the dominant frequency in X-direction are larger than that in vertical direction, which is also in compliance with previous discussion that the radial vibration is more related to the P-wave, while the vibration in vertical is normally considered to be influenced most by the R-wave. In fact, the amplitude and attenuation speed of the P-wave are larger than that of the R-wave. It can be seen that different wave components have an important influence on the frequency.
4. Comparison with Other Formulas
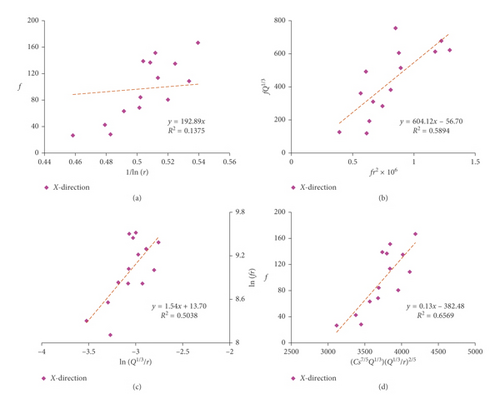
In order to observe the difference of fitting effect between equation (17) and other formulas (18)–(22), the dominant frequency of blasting vibration measured in Zhoushan Green Petrochemical Base are fitted and compared with each other. As the length of the article is limited, Figure 18 only gives the fitting analysis curve of multiple-hole blasting of X-direction in 1# experiment. Table 8 gives a complete list of the fitting parameters and correlation coefficients of each experiment by each formula.
| Equation | Blasthole | Direction | 3# massif | 5# massif | ||||||||
|---|---|---|---|---|---|---|---|---|---|---|---|---|
| k1 | k2 | k3 | k4 | r2 | k | k1 | k2 | k4 | r2 | |||
| (18) | Single | X | 95.75 | 0.212 | 125.88 | 0.461 | ||||||
| Y | 95.66 | 0.178 | 125.40 | 0.540 | ||||||||
| Z | 94.01 | 0.176 | 114.57 | 0.595 | ||||||||
| Multiple | X | 85.15 | 0.138 | 192.89 | 0.463 | |||||||
| Y | 89.51 | 0.116 | 192.50 | 0.489 | ||||||||
| Z | 79.90 | 0.155 | 147.05 | 0.691 | ||||||||
| (19) | Single | X | 3.29E − 3 | 8.15E − 7 | 0.028 | 2.97E − 3 | 2.84E − 7 | 0.433 | ||||
| Y | 3.27E − 3 | 7.62E − 7 | 0.011 | 4.28E − 3 | −3.53E − 7 | 0.519 | ||||||
| Z | 3.52E − 3 | 6.06E − 7 | 0.007 | 4.45E − 3 | −2.65E − 7 | 0.645 | ||||||
| Multiple | X | 3.84E − 3 | 9.02E − 7 | 0.589 | −1.76E − 2 | 1.07E − 5 | 0.266 | |||||
| Y | 3.58E − 3 | 8.64E − 7 | 0.679 | −5.16E − 3 | 4.10E − 6 | 0.322 | ||||||
| Z | 4.34E − 3 | 5.97E − 7 | 0.271 | 2.26E − 2 | −1.01E − 5 | 0.435 | ||||||
| (20) | Single | X | 1.00E + 4 | 0.18 | 0.042 | 1176.71 | −0.39 | 0.527 | ||||
| Y | 2.39E + 4 | 0.47 | 0.155 | 1085.72 | −0.43 | 0.651 | ||||||
| Z | 1.66E + 4 | 0.38 | 0.119 | 671.94 | −0.60 | 0.805 | ||||||
| Multiple | X | 8.94E + 5 | 1.54 | 0.504 | 1319.01 | −0.28 | 0.381 | |||||
| Y | 1.19E + 6 | 1.65 | 0.475 | 1191.71 | −0.35 | 0.530 | ||||||
| Z | 7.78E + 4 | 0.81 | 0.312 | 573.17 | −0.59 | 0.855 | ||||||
| (21) | Single | X | 0.047 | 0.642 | 0.017 | 0.360 | ||||||
| Y | 0.057 | 0.636 | 0.017 | 0.303 | ||||||||
| Z | 0.049 | 0.596 | 0.016 | 0.299 | ||||||||
| Multiple | X | 0.026 | 0.240 | 0.011 | 0.645 | |||||||
| Y | 0.026 | 0.204 | 0.011 | 0.652 | ||||||||
| Z | 0.020 | 0.272 | 0.010 | 0.780 | ||||||||
| (22) | Single | X | 2.93 | 0.13 | 1.04 | −7.87 | 0.683 | 1.62E + 4 | 0.00 | 0.71 | 2.46 | 0.862 |
| Y | 5.20E + 7 | −0.33 | 1.70 | 7.02 | 0.704 | 5.09E + 4 | −0.20 | 0.86 | 2.89 | 0.925 | ||
| Z | 3.00E + 8 | 0.10 | 1.30 | 10.11 | 0.673 | 9.54E + 3 | −0.45 | 0.92 | 0.71 | 0.906 | ||
| Multiple | X | 3.53 | 0.10 | 2.29 | −11.67 | 0.758 | 3.01E + 3 | 0.74 | −0.34 | 4.02 | 0.875 | |
| Y | 7.05E − 5 | 0.51 | 1.21 | −18.45 | 0.890 | 1.16E + 3 | −0.13 | 0.75 | −0.50 | 0.782 | ||
| Z | 7.39E − 8 | 0.26 | 1.29 | −26.08 | 0.876 | 4.82E + 3 | 0.11 | 0.25 | 2.46 | 0.760 | ||
| (17) | Single | X | 8.75E + 3 | 1.18 | 0.660 | 1573 | 0.62 | 0.740 | ||||
| Y | 1.70E + 4 | 1.47 | 0.643 | 1500 | 0.58 | 0.774 | ||||||
| Z | 1.27E + 4 | 1.38 | 0.642 | 1060 | 0.41 | 0.642 | ||||||
| Multiple | X | 2.73E + 5 | 2.53 | 0.733 | 1657 | 0.73 | 0.794 | |||||
| Y | 3.33E + 5 | 2.63 | 0.698 | 1570 | 0.67 | 0.797 | ||||||
| Z | 4.09E + 4 | 1.80 | 0.689 | 859 | 0.42 | 0.726 | ||||||
It can be seen from Table 8 that equation (17) generally performs better than most of other formulas, and the fitting correlation coefficient is only lower than equation (22). However, it is worth noting that although the fitting correlation coefficient obtained by equation (22) is generally the highest, it is difficult to apply in engineer practice in result of its too complex fitting parameters and calculation, which need four unknown parameters and multiple linear regression. In comparison, equation (17) can not only obtain a favorable fitting correlation but also simple and brief in form.
5. Conclusion
- (1)
An equation reflecting the change of dominant frequency induced by blasting has been derived by dimensional analysis combined with the theory of radial spherical wave propagation. Based on the fitting analysis of dominant frequencies measured in Zhoushan Green Petrochemical Base, favorable correlation coefficients have been obtained, which proves the feasibility of the proposed equation. By comparing the different prediction formulas of dominant frequency with equation (17), it is found that equation (17) performs better in general, which can not only obtain a favorable fitting correlation but also simple and brief in form.
- (2)
The fitting correlation coefficient of dominant frequency in radial direction is generally higher than the vertical direction, which is resulted from the existence of surface free surface in cylindrical charge blasting. The vibration in vertical is considered to be influenced most by the R-wave reflected by the free face on the ground, which is perceived to be quite different from the radial vibration affected by the P-wave. In other words, different types of waves will affect the dominant frequency of blasting vibration.
This paper has proposed an attenuation formula for dominant frequency, and it has found that the attenuation of dominant frequency is influenced by the component of the blasting wave. Although the proposed equation has obtained a favorable fitting correlation, it has adopted many simplified assumptions, such as that the rock is assumed to be linear elastic and the influence of free surface in semi-infinite space is neglected. Therefore, the proposed equation still needs to be further improved and optimized.
Conflicts of Interest
The authors declare that there are no conflicts of interest regarding the publication of this paper.
Acknowledgments
This work was supported by the National Natural Science Fund Project of China (51779190) and Hubei Province Technical Innovation Program (2017ACA102). The authors wish to express their thanks to all supporters.
Open Research
Data Availability
The data used to support the findings of this study are available from the corresponding author upon request.


