Self-Compensation for Disturbances in Differential Vibratory Gyroscope for Space Navigation
Abstract
In order to meet in many aspects contradictory requirements to gyroscopes used in space applications, this paper proposes to use the multimode Coriolis vibratory gyroscope, which operates in a new differential mode in addition to well-known rate and rate-integrating modes. The differential mode of operation can provide high resistance to external disturbances acting on the gyroscope under operating in launch, docking, and landing regimes of spacecraft. The differential mode of operation differs from the other two known modes by the presence of two, X and Y, measurement channels. Each of the channel measures angle rate with opposite sign. This mode of operation can be implemented by the disposition of standing wave pattern between the drive and sense electrodes. The paper presents promising capabilities of the differential mode of operation to self-compensate for external disturbances. The condition for the standing wave angle disposition that provides maximum compensation for the disturbances is proposed. Numerical and graphical test results on the determination of shock suppression coefficient, vibration sensitivity reduction coefficient, and also reduction of sensitivity to constant and variable magnetic fields are presented.
1. Introduction
Nowadays, gyroscopes including MEMS sensors are widely used in space applications, for example, as hardware of systems for small satellite launch. Space applications are characterized in many respects by contradictory requirements to gyroscopes. These requirements are resistance to vibrations, low sensitivity to linear acceleration during launch regime, resistance to shocks during landing and docking, and at the same time, small noise in the measurement of small angular rates at an orbit. Such contradictory requirements can be met using a multimode gyroscope with automatic switching from one mode to another.
It is well-known [1] that Coriolis vibratory gyroscope (CVG) can be adapted to dual mode operation including rate and rate-integrating ones with automatic switching from one mode to another to provide accuracy requirements for different flight conditions. For example, under measuring of small angle rate, it is advisable to operate in the rate mode, since the measurement errors and sensitivity are mainly determined by the noise and bias drift which can be lower than that for rate-integrating mode of operation [1]. Under measuring large angle rate, it is advisable to operate in the rate-integrating mode of operation since the measurement errors are mainly determined by the multiplicative error ΔΩ caused by scale factor (SF) uncertainty (ΔSF), ΔΩ = ΔSF · Ω. SF for rate-integrating mode of operation is a stable constant (Bryan coefficient). SF stability for rate-integrating CVG can reach 35 ppm and its dynamic range can reach 7 · 103 deg/s [2] and even up to 1.8 · 104 deg/s [3].
This paper theoretically and experimentally researches the differential mode of operation providing excellent resistance to external disturbances in comparison to the rate mode. The differential mode of operation can be used as a third one [4]. It complements the two first ones and provides accurate measurements, while gyros being subjected to external disturbances.
2. Equations of Differential Measurements

Because Dx ≈ Dy, and hence, θ∗ ≈ 22.5°, it is convenient to choose the initial angle as follows θinitial = 22.5°.
The signal of the sum zy + zx does not contain the angular rate, but it provides online information about the bias components.
3. Test Results
This section presents the test results of the differential CVG operating in conditions of different disturbances. These tests allow us to quantitatively determine disturbance rejection (suppression) factors in the differential mode of CVG operation in comparison with the rate mode of the same gyroscope when disturbances are mechanical shocks, vibrations, and constant and variable magnetic fields. In all the tests dampers, screens and other disturbance protection means were not used, so all external disturbance suppression factors and sensitivities to them have been determined for unprotected CVG.
First of all, for the tested gyro, the standing wave angle θ∗ should be calculated, according to (10) and then send a command to install the standing wave at the angle of θ∗.
3.1. Shock Tests
Shock tests were carried out using a multishock shocker. The tested CVG was mounted on the shocker platform such that its input axis (IA) was firstly directed parallel to the shock acceleration direction and then perpendicular to it. The tested CVG output signal is read out to the computer with frequency 600 Hz. Shock amplitude and its duration are set on the shocker’s control electronics. Figure 2 shows the metallic resonator CVG mounted on the shocker’s platform.
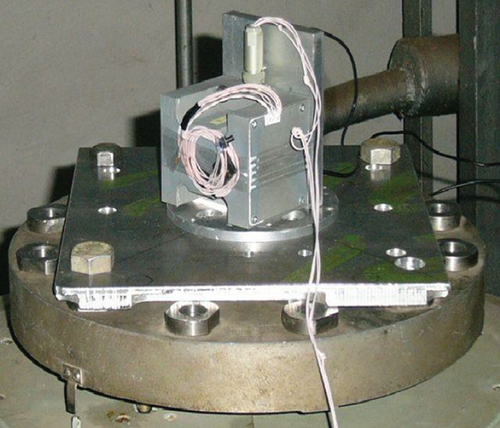
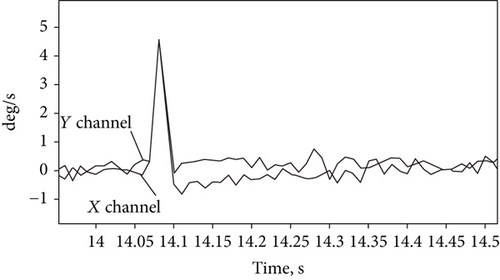
Figure 3 shows the preliminary test result, where the X and Y channel signals of the differential CVG are superposed after exposure to small amplitude mechanical shock (less than 5 g, where g is the free fall acceleration) along gyro IA. As can be seen from Figure 3, the X and Y channel responses are almost equal to each other in the peak region, so the differential channel response is close to zero. No angle rate is visible on the peak region that usually accompanies the shock. The latter means that the rejection (suppression) factor for small shock is very high. However, transient following after peak region shows small angle rates that damp for 0.25 s. This has been also shown in [8] for tuning fork MEMS gyro. There are different investigations on increasing shock rejection factor for vibratory gyroscopes [9–11]. The same result has been obtained for a small amplitude lateral shock, perpendicular to gyro IA.
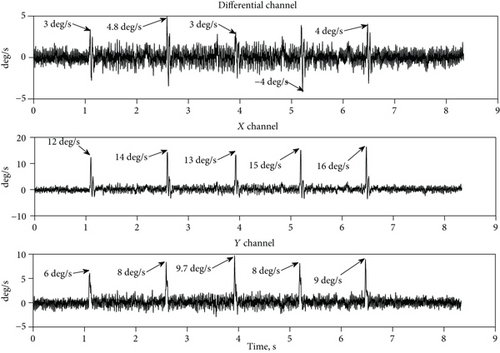
When the shock amplitude increases to 20 g of 2 ms duration, the rejection factor decreases and appears angle rate accompanying the shock. Figure 4 shows the responses of three channels (the X, Y, and the differential one, (X–Y)/2) of the differential CVG under 5 shocks along IA. As can be seen from the peak values, indicated on Figure 4, the rejection factor is close to R = 2.
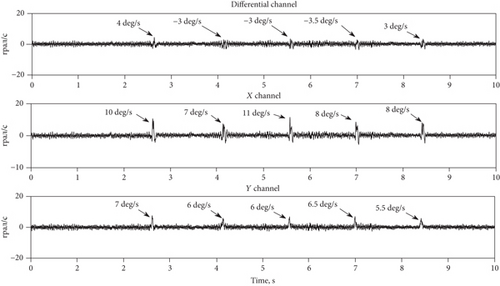
Figure 5 shows angle errors obtained by integration of the X, Y, and differential channel signals during the shocks along IA. Accumulated angle error during shock for the differential channel is about 5 times less, than that of the X and Y rate channels, and is no more than 2 arcmin. Thus, the shock rejection factor in terms of angle error for differential CVG increases to R = 5 in comparison with the rate gyro for the shock parameters: 20 g amplitude and 2 ms duration along IA.
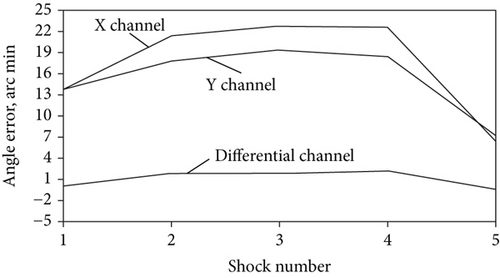
Figure 6 shows the X, Y, and differential channel responses to 5 lateral shocks of 20 g amplitude and 2 ms duration. The calculation of minimum rejection factor R, over all 5 shocks, in terms of peak value results in the value R ≈ 2. Thus, rejection factors for lateral and along IA for 20 g amplitude shocks are almost equal to each other.
Almost the same behavior of angle error (integral of measurements shown in Figure 6), for the differential channel, is observed during the lateral shocks. The rejection factor R in terms of the angle error for the differential mode of operation increases to R = 6 in comparison with the rate mode, with absolute error value of no more than 2 arcmin. After shock completion, the resultant gyro turn angle has been equal to zero. The resultant turn angle has been monitored by an optical method.
An important error component arising under shock is a bias change before and after shock. Figure 7 shows the change in biases after each of the five 20 g shocks along gyro IA. The average change, over all 5 shocks, of the absolute values of the biases is 0.0097 deg/s for the differential channel and the minimum value by the X and Y channels is 0.03 deg/s; hence, the rejection factor in term of bias change is R = 0.03/0.0097 ≈ 3.
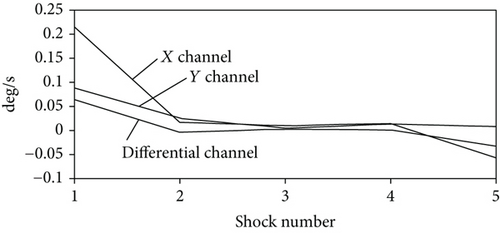
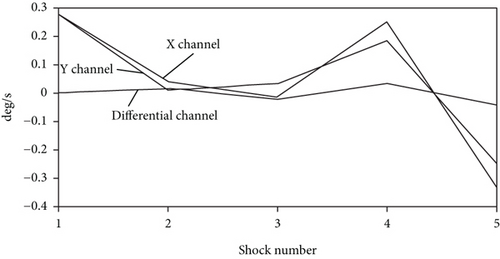
Figure 8 shows the change of the biases after lateral shocks. In this case, the rejection factor R in terms of the bias change is greater than that of along IA and is evaluated, using the data presented in Figure 8, as R ≈ 8. The differential channel bias sensitivity to lateral shock acceleration is about S = 0.001 deg/s/g versus the Y channel sensitivity which is evaluated as S = 0.008 deg/s/g, which is a minimum by the X and Y channels.
Let us summarize shock tests in Table 1.
| Rejection factor in terms of peak value | Rejection factor in terms of angle error, max error (arcmin) | Rejection factor in terms of bias change, max bias change (deg/s) | Diff. CVG bias sensitivity to shock accel. (deg/s/g) | ||
|---|---|---|---|---|---|
| Shock amplitude 20 g, 2 ms duration | |||||
| Along IA | Lateral | Along IA | Along IA | Lateral | Lateral |
| 2 | 2 | 5 | 3 | 8 | 10-3 |
| 2 | 0.06 | 0.03 | |||
3.2. Vibration Rejection Factor
This subsection presents vibration test results of the differential CVG bias change versus linear sinusoidal vibration and its comparison with that of the X and Y rate channels. The bias sensitivity to vibration amplitude and its comparison with the rate channels are also presented. The comparison of noise parameters calculated by Allan variances is presented in this subsection as well.
Vibration tests were carried out using electromagnetic small-sized vibratory shaker shown in Figure 9. On top of the tested gyroscope there is an accelerometer to control vibration acceleration and frequency.
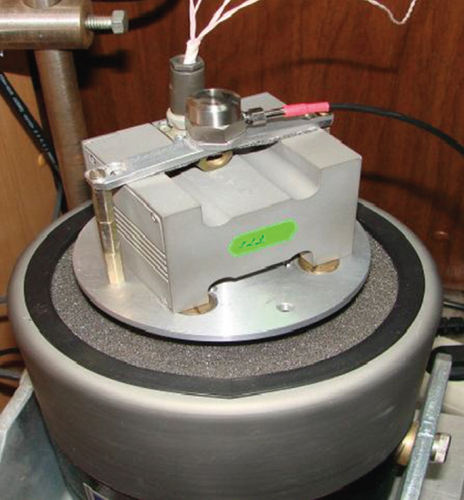
Figure 10 shows the X, Y, and differential channel bias change versus the amplitude of sinusoidal vibration for 50, 100, and 300 Hz vibration frequencies. The bias change is calculated as the difference between corresponding channel bias obtained under vibration and the same channel bias under no vibration. As can be seen from Figure 10, the higher the frequency of vibration, the greater the change of the bias, especially for higher vibration amplitude. For 3 g vibration amplitude and 300 Hz frequency, the change of the biases for the X and Y channels is almost equal to each other at the value of 1.2 deg/s and the change of the bias for the differential channel is about 0.1 deg/s. So, the change of the bias for the differential channel is 12 times less than that for the rate channels.
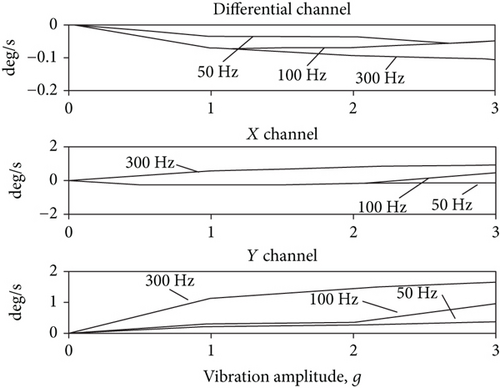
As can be visually estimated from Figure 10, at any frequency and amplitude of vibration, in the considered ranges here, the bias change of the differential channel is less than that of the X and Y channels of about 10 times.
4. g-Dependent Noise
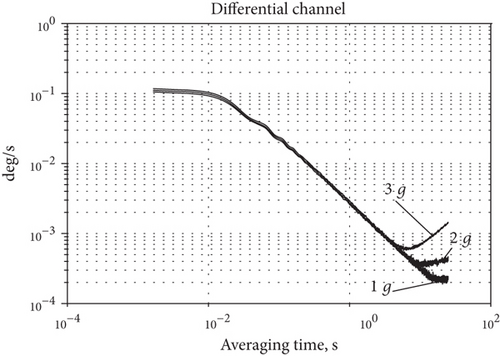
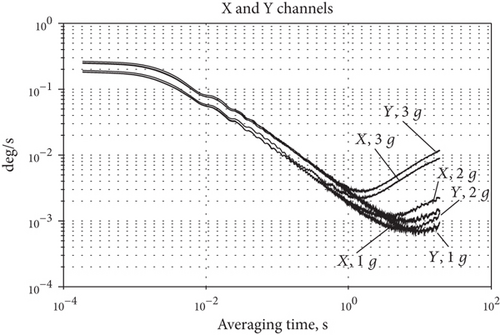
Figure 11 presents the differential (Figure 11(a)) and the X and Y (Figure 11(b)) channel root of Allan variances for the different vibration amplitudes at the frequency 100 Hz. Figure 11 demonstrates that such noise components as white noise and random walk almost do not depend on vibration amplitude, whereas the bias instability and rate random walk are g-dependable. Because the bias instability is the most important gyro parameter, we will focus on the g-sensitivity of this noise component.
Let us now determine the g-sensitivity of the bias instability. Figure 12 shows the dependence of the bias instability versus vibration amplitude at different frequencies.
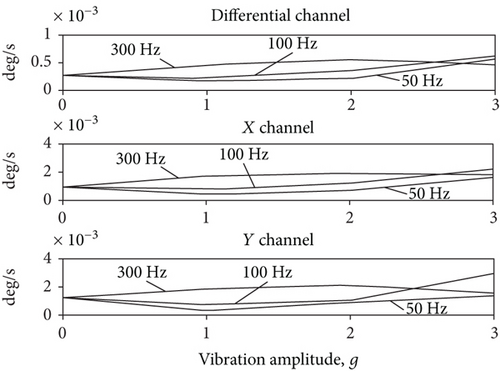
The sensitivity of the bias instability to vibration amplitude is calculated as a tangent of tilt angles of least squares’ straight line drawn by the data presented in Figure 12 for each of the three vibration frequencies. Calculation results are presented in Table 2.
| Vibration frequency (Hz) | Differential channel g-sensitivity of the bias instability (deg/s/g) | X channel g-sensitivity of the bias instability (deg/s/g) | Y channel g-sensitivity of the bias instability (deg/s/g) |
|---|---|---|---|
| 50 | 8.5 · 10−5 | 3.75 · 10−4 | 2.95 · 10−4 |
| 100 | 5.4 · 10−4 | 1.75 · 10−3 | 9.3 · 10−4 |
| 300 | 5.25 · 10−4 | 2.04 · 10−3 | 7.1 · 10−4 |
| Mean | 3.8 · 10−4 | 1.4 · 10−3 | 6.5 · 10−4 |
The mean value of the g-sensitive bias instability for the differential channel is 2.6 times less than minimum of that for the X and Y rate channels.
This is because the X and Y channel noises are strongly correlated and under subtraction partially compensate for each other.
5. Magnetic Field Rejection Factor
Constant and variable magnetic fields effect a gyroscope bias through the interaction with electronic circuits and resonator. The amount of interaction with resonator depends on the resonator material and amount of field applied to it. This interaction results in a gyro bias variation proportional to the external magnetic field applied. So, it is very important to protect gyros from external magnetic field.
This subsection presents test results that demonstrate high magnetic field rejection factor of the differential CVG and much lower gyro bias magnetic sensitivity in comparison with the rate CVG. In these tests, the sensitivity to the magnetic field of the entire device—the sensitive element together with the electronic units—was measured. Constant, but different in intensity, magnetic fields have been imposed by changing the distance of the permanent magnet to the tested gyro. A variable magnetic field has been generated by the periodical motion of the permanent magnet over the testing gyro.
Figure 13 shows the differential CVG output signal biases under an applied magnetic field of the different intensities. One can see that the differential channel does not visually reveal the dependence on the magnetic field applied, whereas the X and Y rate channels show up significant changes in their biases.
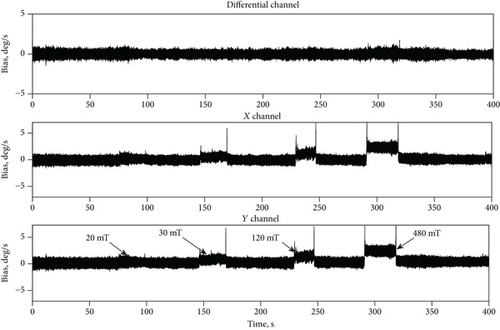
The excellent suppression property of the CVG differential channel is due to almost equal responses to magnetic field of both the X and Y channels. It is because signals of the X and Y channels are generated by the single mass resonator to which a magnetic field is applied.
The bias change for each of these three channels X, Y, and the differential one versus magnetic field intensity is depicted in Figure 14. One can see that the differential channel sensitivity is much lower than that of the X and Y rate channels. Each of the three channels’ magnetic field sensitivity coefficient can be quantitatively estimated by a tangent of tilt angle of least squares’ straight line conducted on the data presented in Figure 14. The calculation results are the following: the X channel magnetic sensitivity is Sx ≈ 4.54 · 10−3 deg/s/mT; the Y channel magnetic sensitivity is Sy ≈ 4.2 · 10−3 deg/s/mT and the differential channel magnetic sensitivity is Sd ≈ 1.7 · 10−4 deg/s/mT.
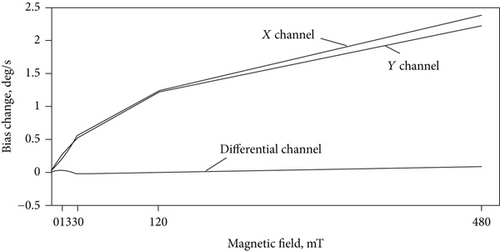
The ratio of minimum of the X and Y channel sensitivity to that of the differential one can be defined as a rejection factor R to magnetic field in comparison to rate CVG. It is equal to R = Sy/Sd ≈ 25.
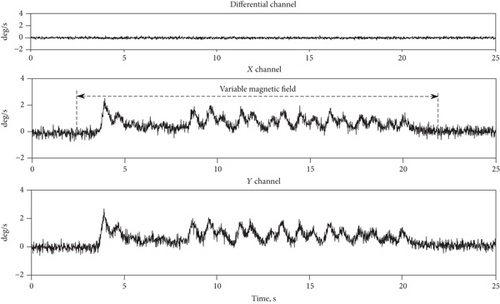
Figure 15 shows responses of the differential CVG signals to variable magnetic field with amplitude close to 10 mT. The differential channel does not show a change in bias because noise does not allow us to see the bias change at 10 mT magnetic field, though the X and Y channels show significant changes in their biases.
6. Conclusions
The differential CVG can be considered as the third mode of operation for vibratory gyroscopes along with two well-known modes such as rate and rate-integrating ones. Differential mode of operation can be embedded in the same gyro together with the two others modes, to implement the triple-mode CVG. The triple-mode gyroscopes can be implemented both for MEMS and non-MEMS vibratory gyroscopes and in the nearest future could meet contradictory requirements to gyroscopes used in space applications.
The differential mode of operation has greater external disturbance rejection factors and fewer sensitivities than the rate mode to the following disturbances: shocks, vibrations, and magnetic fields.
The differential CVG bias change during sinusoidal vibration in the frequency range up to 300 Hz is less than that of rate CVG of about 10 times. It was experimentally revealed that the bias g-sensitivity under sinusoidal vibration is also dependent on its vibration frequency. This dependence is close to linear.
The magnetic field sensitivity of the differential CVG is much less than that of the rate CVG. The greater the magnetic field, the greater the rejection factor of the differential CVG in comparison to the rate one. The differential CVG response to variable magnetic field is invisible on the background of its noise for its amplitude is not great.
Conflicts of Interest
The authors declare that there is no conflict of interests regarding the publication of this paper.
Acknowledgments
The authors are grateful to H.V. Tsiruk for her contribution to MatLab simulation of multimode vibratory gyroscope in reference [4] of the present paper, whose results are used in this work. Such a simulation was not carried out during the creation of the presented paper. Therefore, H.V. Tsiruk was not included in the list of authors.
Open Research
Data Availability
The .txt format data used to support the findings of this study are available from the author Valeriy Chikovani upon request.


