Volume 2019, Issue 1 3131502
Research Article
Open Access

Three-Dimensional Nonlinear Seismic Response of Immersed Tunnel in Horizontally Layered Site under Obliquely Incident SV Waves

Xiaojie Zhou

Xiaojie Zhou

Tianjin Key Laboratory of Civil Buildings Protection and Reinforcement, Tianjin Chengjian University, Tianjin 300384, China tcu.edu.cn

School of Civil Engineering, Tianjin Chengjian University, Tianjin 300384, China tcu.edu.cn

Search for more papers by this author
Qinghua Liang

Qinghua Liang

Tianjin Key Laboratory of Civil Buildings Protection and Reinforcement, Tianjin Chengjian University, Tianjin 300384, China tcu.edu.cn

School of Civil Engineering, Tianjin Chengjian University, Tianjin 300384, China tcu.edu.cn

Search for more papers by this author
Yueyu Zhang

Yueyu Zhang

Tianjin Key Laboratory of Civil Buildings Protection and Reinforcement, Tianjin Chengjian University, Tianjin 300384, China tcu.edu.cn

School of Civil Engineering, Tianjin Chengjian University, Tianjin 300384, China tcu.edu.cn

Search for more papers by this author
Zhongxian Liu

Corresponding Author

Zhongxian Liu

Tianjin Key Laboratory of Civil Buildings Protection and Reinforcement, Tianjin Chengjian University, Tianjin 300384, China tcu.edu.cn

School of Civil Engineering, Tianjin Chengjian University, Tianjin 300384, China tcu.edu.cn

Search for more papers by this author
Ying He

Ying He

Tianjin Key Laboratory of Civil Buildings Protection and Reinforcement, Tianjin Chengjian University, Tianjin 300384, China tcu.edu.cn

School of Civil Engineering, Tianjin Chengjian University, Tianjin 300384, China tcu.edu.cn

Search for more papers by this author
First published: 2019
Citations: 5
Academic Editor: Nawawi Chouw

Abstract

A three-dimensional (3D) detailed numerical model of an immersed tunnel in a horizontally layered site is established in this study. The 3D seismic response of the immersed tunnel in a horizontally layered site subjected to obliquely incident waves is analyzed based on the precise dynamic stiffness matrix of the soil layer and half-space via combined viscous-spring boundary and equivalent node stress methods. The nonlinear effects of external and internal site conditions on the whole model were determined by equivalent linearization algorithm and Mohr–Coulomb model, respectively. The proposed model was then applied to investigate the nonlinear seismic response of an immersed tunnel in the Haihe River subjected to seismic waves of oblique incidence. The dislocation (opening) of pipe joints in the immersed tunnel were analyzed to determine the response characteristics of the shear keys and overall displacement of the tunnel; the dynamic responses of the immersed tunnel subjected to obliquely incident seismic waves markedly differ from those of vertically incident seismic SV waves. The maximum stress value of shear keys and the maximum dislocation of the pipe joint appear as upon critical angle. The overall displacement of the tunnel increases as incident angle increases. Under severe earthquake conditions, both the pipe corners and midspan section of the roof and floor are likely to produce crack. These areas need careful consideration in the seismic design of immersed tunnel structures.

1. Introduction

Immersed tunnel structures have grown increasingly common in cross-sea and cross-river traffic engineering projects. Many of these structures are located in highly seismic regions. The unique characteristics of the immersed tunnel make any structural damage caused by an earthquake particularly difficult to be repaired, so antiseismic design is particularly important. The complexity of the immersed tunnel system makes it difficult to test by shaking table. Numerical analysis methods are an important means to study the seismic performance of immersed tunnels. Immersed tunnels tend to be lengthy and are usually built on weak ground [1, 2], so it is necessary to consider the spatial variation effects of ground motion and the dynamic interaction between the soil and structure in such numerical analyses [3]. Numerical simulation of the whole dynamic analysis model must include both the immersed tunnel and surrounding rock [4].

Recent researchers have conducted many shaking table tests [57] and fine numerical simulations [810] for investigating the 3D seismic response of immersed tunnels. Hu et al. [11] investigated the mechanical properties of segmental joints in the immersed tunnel of the Hongkong-Zhuhai-Macao Bridge in China; Yu et al. [6] considered the multipoint input of ground motions via experiment. Chen et al. [5] carried out a large immersed tunnel-joint-site soil shaking-table test to determine the seismic response of immersed tunnels and joints.

It is generally assumed that seismic waves in a deep-focus earthquake strike perpendicularly to the bedrock and transfer it to the structure. For shallow-focus earthquakes with small epicentral distance, the influence of seismic wave incident angle on the seismic response of surrounding structures is an important consideration [12]. Du [13] analyzed the oblique incidence of seismic waves by using the transmission viscoelastic boundary conditions. FCPD Barros and Luco [14] obtained the three-dimensional harmonic response in the vicinity of an infinitely long, cylindrical cavity of circular cross section buried in a layered, viscoelastic half-space. Xiao et al. [15] investigated the shear behavior of an immersion joint subjected to compressive shear loads and found that the capacity of the joint is smaller than the sum of the capacities of all shear keys.

Previous researchers have mainly focused on 2D cross sections. However, it is difficult to accurately describe the nonlinear response state by simply decomposing the immersed tunnel into in-plane and out-of-plane components under the oblique incidence of seismic waves. Unfortunately, it is very challenging to secure an accurate 3D model due to its complexity. Huang et al. [16] proposed a method to realize the SV and SH waves with arbitrary incident angles in ABAQUS and indicated that the nonlinear seismic responses of long lined tunnels are highly affected by the incident angles of S waves. The literature mainly centers around the half-space uniform field rather than the 3D horizontally layered nonlinear seismic response of the site. Actual construction sites are usually layered; the amplification effect of the layered site is significantly different from that of the equivalent uniform site due to the resonance amplification and filtering effect of the soil layer [17], and this is proved in our paper [18].

In the present study, we established a 3D refined model of horizontal layered site immersed tunnel. We used the dynamic stiffness matrix of the soil layer and half-space combined with viscous-spring boundary and equivalent node stress methods to conduct accurate simulations of 3D seismic responses in a horizontally layered immersed tunnel structure. We applied the equivalent linearization algorithm (self-programmed) to determine the nonlinear effects of the external site of the overall model. We also used the Mohr–Coulomb model to determine the nonlinear effects of soil inside the overall model. The nonlinear effects of concrete were determined by a plasticity damage model of concrete in ABAQUS. The nonlinear seismic response of an immersed tunnel in the Haihe River and the seismic behavior of shear keys and pipe joints under obliquely incident SV waves were then determined based on the proposed model.

2. Obliquely Incident Seismic Waves in ABAQUS

2.1. Viscous-Spring Boundary

We used the 3D viscous-spring boundary set provided by Huang et al. [19] to simulate the stiffness and radiation damping effects of semi-infinite strata in this paper. The viscous-spring boundary reflects the propagation of an advancing wave by superimposing the plane wave and the far-field scattered wave. The characteristics of wave attenuation and multiangle incidence are reflected by two empirical parameters; the wave field of the infinite field at the artificial boundary is transformed to stress on artificial boundaries. When the finite-element integral is stable, the viscous-spring boundary remains stable. The spring stiffness and damping coefficient of the 3D viscous-spring artificial boundary are shown in equations (1) and (2):
K N = 1 1 + A λ + 2 G r , C N = B ρ c p , (1)
K T = 1 1 + A G r , C T = B ρ c s , (2)
where KN and CN are the normal spring stiffness and damping coefficient of the nodes on the artificial boundary, respectively; KT and CT are the tangential spring stiffness and damping coefficient of the nodes on the artificial boundary, respectively; A and B are empirical parameters typically set to 0.8 and 1.1, respectively; G is the shear modulus; λ is the first Lame constant; r is the distance from the scattered wave source to the artificial boundary, which can be simply taken as the vertical distance from the geometric center of the structure to the artificial boundary; ρ is the soil density of the foundation; and cs and cp are S wave velocity and P wave velocity, respectively.

2.2. Earthquake Input Method Based on Viscous-Spring Boundary

Here, we combine the finite-element method with the time-domain method of viscous-spring boundaries. The displacement and stress of the artificial boundary caused by equivalent load input on the artificial boundary must be consistent with that of the original free field. In this way, the earthquake input is translated into a free-field motion problem on artificial boundary nodes, whereas free-field motion can be transformed into an equivalent nodal load on artificial boundary nodes [20]. The equivalent nodal load of artificial boundary node l in direction i is calculated as follows:
F t = A l σ l i f + k l i u l i f + c l i u ˙ l i f , (3)
where Al is the influence area of node l on the artificial boundary surface; σ l i f is the free-field stress tensor of node l in direction i; u l i f is the free-field displacement tensor of node l in direction i; u ˙ l i f is the free-field velocity vector of node l in direction i; kli is the viscous-spring boundary spring stiffness of node l in direction i; and cli is the viscous-spring boundary damping coefficient of node l in direction i.

2.3. Plane Wave Input under Oblique Incidence in a 3D Layered Site

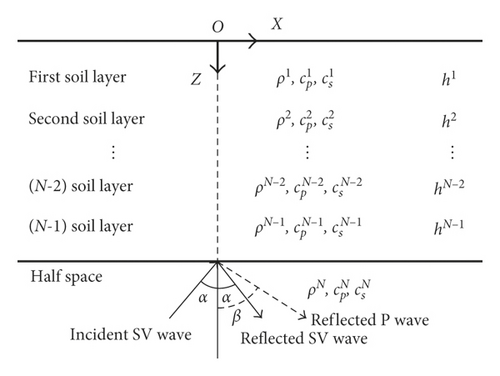
The schematic diagram of the input wave field when the SV wave is obliquely incident is shown in Figure 1 [20]. The plane SV wave with the incident angle α is reflected on the surface of the bedrock, forming a plane SV wave with the reflection angle α and a plane P wave with the reflection angle β, where β = arcsin(cpsinα/cs) and the critical value of the incident angle of the SV wave α = arcsin(cs/cp). When the problem is solved, the input schedule is first transformed to the frequency domain by Fourier transform, and then all the effective frequency points are calculated in the frequency domain. Finally, the time-domain results are obtained by inverse Fourier transformation. The direct stiffness method can be applied to the free-field solution in the frequency domain.
Details are in the caption following the image
Layered site model of SV wave under oblique incidence.
Wolf [21] gives an accurate dynamic stiffness matrix for layered soil and half-space. The dynamic equilibrium equations of i layer and half-space in the plane motion (P-SV wave) are calculated by equations (4) and (5), respectively:
P i i R i P b i R b = k 11 k 12 k 13 k 14 k 22 k 23 k 24 k 33 k 34 k 44 u i i w i u b i w b , (4)
P o i R o = r 11 r 12 r 22 u o i w o , (5)
where Pi, Ri, Pb, and Rb are horizontal and vertical load amplitudes of the upper and lower soil layers, respectively; Po and Ro are horizontal and vertical load amplitudes of the free surface in half-space; ui, wi, ub, and wb are horizontal and vertical displacements of the upper and lower surface of the soil layer; and uo and wo are horizontal and vertical displacements of the bedrock surface. The stiffness matrix is a symmetric matrix. The expressions of k11k44 and r11r22 are available in our references [21].
The stiffness matrix of each soil layer can be set and adjusted to obtain the overall space stiffness matrix SP-SV, which is a (2n + 2) order square matrix where n is the number of soil layers. The overall dynamic equilibrium equation of the site can be written as follows:
P = S P SV u , (6)
where P is the load vector, which is only related to the field characteristics, the incident wave amplitude, and the incident angle; the displacement vector u at the layer stratification can be solved accordingly.
The horizontal displacement and vertical displacement at any point within each soil layer can be expressed as equations (7a) and (7b). The velocity at any point can be derived from the displacement to the time as expressed by equations (8a) and (8b). Normal stress amplitude σz(x, z) and σx(x, z), as well as shear stress amplitude τxz(x, z), can be derived from the following constitutive equation:
u x , z = l x A P exp i k s z + B P exp i k s z m x t A SV exp i k t z B SV exp i k t z exp i k x , (7a)
w x , z = l x s A P exp i k s z B P exp i k s z m x A SV exp i k t z + B SV exp i k t z exp i k x , (7b)
u ˙ x , z = i ω u x , z , (8a)
w ˙ x , z = i ω w x , z , (8b)
where AP, BP, ASV, and BSV represent the incident and reflected amplitude of P and SV waves, respectively; k = ω/c is the wave number; c = c P / l x = c S / m x is the phase wave velocity; ω is the circular frequency; and s = i 11 / l x 2 , t = i 11 / m x 2 . For the incident SV wave, the direction cosine mx = cos α; lx is the P wave propagation direction cosine.
In this study, we investigated the nonlinear seismic response of the site by the equivalent linearization method. The soil characteristics in the matrix are replaced by the equivalent shear modulus G and damping ratio λ which match the equivalent shear strain:
G = G max 1 + γ / γ r , (9)
λ = λ max γ / γ r 1 + γ / γ r , (10)
where Gmax is the maximum shear modulus; γr is a reference shear strain during the earthquake (the value can be determined experimentally or empirically); γ is the dynamic shear strain; and λmax is the maximum damping ratio (which also can be obtained empirically or experimentally).

The coordinate system in the direct stiffness method differs from that in ABAQUS. After coordinate transformation, the solution is plugged into equation (3) to obtain the equivalent nodal load for use in ABAQUS.

3. Input Verification
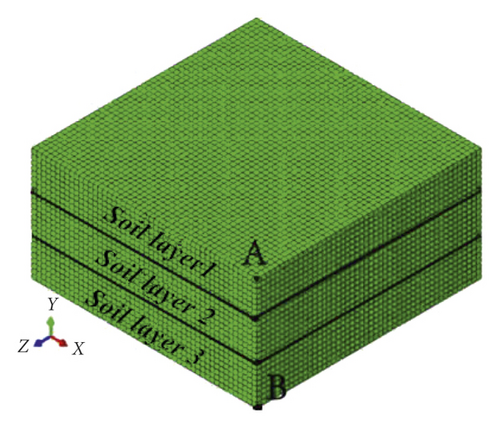
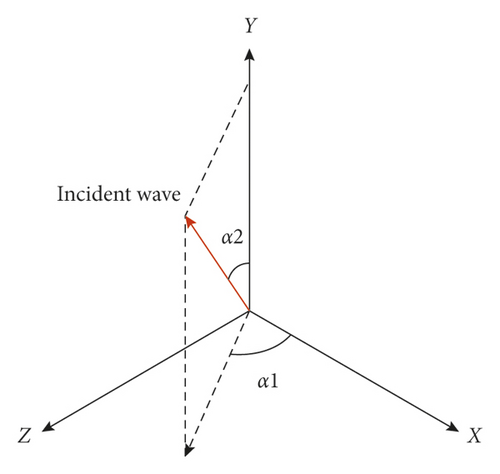
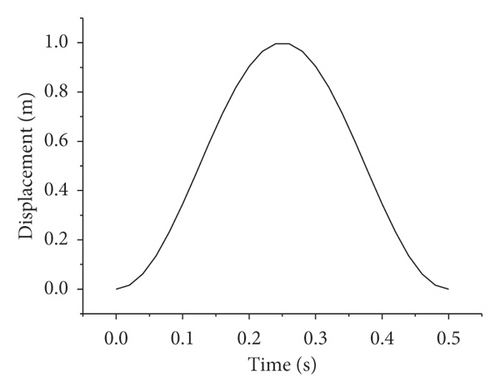
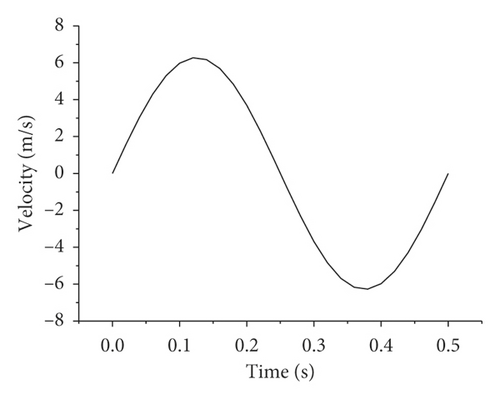
We established a 3D horizontally layered finite-element model (Figure 2(a)) and selected a 240 m × 240 m × 120 m cubic computational domain; 5 m × 5 m × 5 m hexagonal solid elements satisfying the precision requirements of the wave finite-element simulation (equation (11)) were used for discretization, in which A and B are monitoring points. We divided the soil into three layers each 40 m in thickness with the parameters shown in Table 1. The incident plane wave is a pulse wave (equation (12)). The waveform is shown in Figure 3. The SV wave incident angle is (α1, α2). The angle between the incident wave projecting to the Z-X plane and the X axis is α1, and the angle between the incident wave and the Y-axis is α2 (i.e., incident angle α in Section 2.3). We used the incident angle of (60°, 30°) for input verification.
h max = 1 5 1 8 v s f max , (11)
where hmax is the largest size for the grid, vs is the minimum shear wave velocity, and fmax is the maximum frequency of fluctuations.
u t = 1 2 1 cos 2 π f t , (12)
where f  = 2, 0 ≤ t ≤ 0.5.
Details are in the caption following the image
3D model of the horizontally layered site. (a) Finite-element model; (b) angle of incidence.
Details are in the caption following the image
3D model of the horizontally layered site. (a) Finite-element model; (b) angle of incidence.
Table 1. Soil layer parameters.
Category Thickness (m) Density (kg·m−3) Poisson’s ratio S wave velocity (m·s−1) P wave velocity (m·s−1)
Soil layer 1 40 2000 0.3 200 374.1657
Soil layer 2 40 2100 0.3 400 748.3315
Soil layer 3 40 2200 0.3 800 1496.663
Details are in the caption following the image
Displacement diagram and velocity diagram of pulse wave. (a) Displacement diagram of pulse wave; (b) velocity diagram of pulse wave.
Details are in the caption following the image
Displacement diagram and velocity diagram of pulse wave. (a) Displacement diagram of pulse wave; (b) velocity diagram of pulse wave.

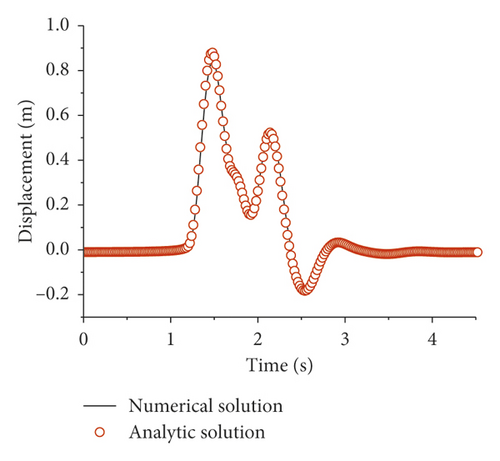
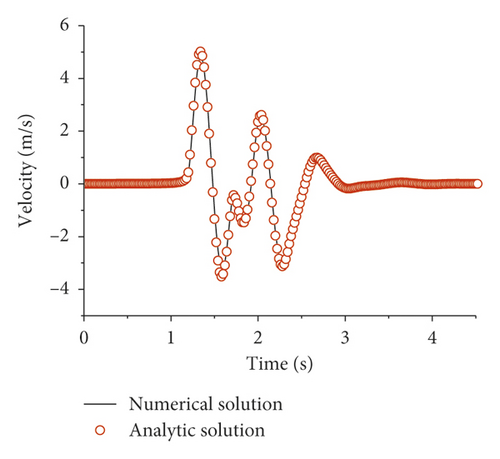
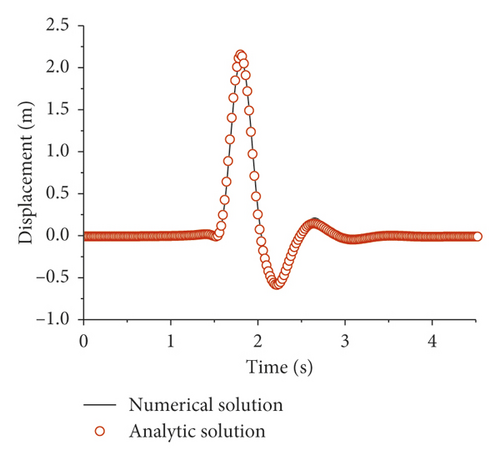
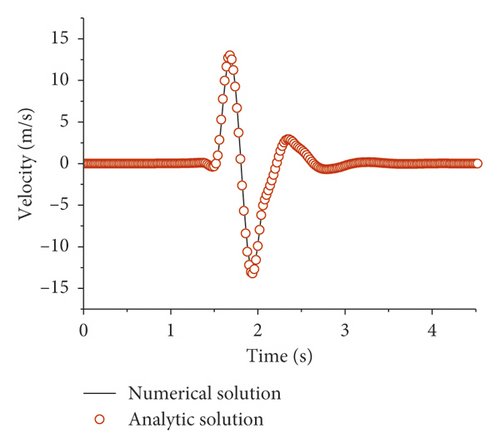
The reflection and refraction waveforms of the SV wave are shown in Figure 4. The viscous-spring boundary absorbs the reflected wave very well. The close agreement between the numerical solution and the analytic solution proves that the oblique-incidence plane wave input method yields accurate simulation results in a 3D layered field with viscous-spring boundaries.
Details are in the caption following the image
Displacement and velocity time curve of each node under incident angle (60°, 30°). (a) Displacement of point A; (b) velocity of point A; (c) displacement of point B; (d) velocity of point B.
Details are in the caption following the image
Displacement and velocity time curve of each node under incident angle (60°, 30°). (a) Displacement of point A; (b) velocity of point A; (c) displacement of point B; (d) velocity of point B.
Details are in the caption following the image
Displacement and velocity time curve of each node under incident angle (60°, 30°). (a) Displacement of point A; (b) velocity of point A; (c) displacement of point B; (d) velocity of point B.
Details are in the caption following the image
Displacement and velocity time curve of each node under incident angle (60°, 30°). (a) Displacement of point A; (b) velocity of point A; (c) displacement of point B; (d) velocity of point B.

4. Seismic Response of Immersed Tunnel under Seismic Wave Oblique Incidence

4.1. Calculation Model and Parameters

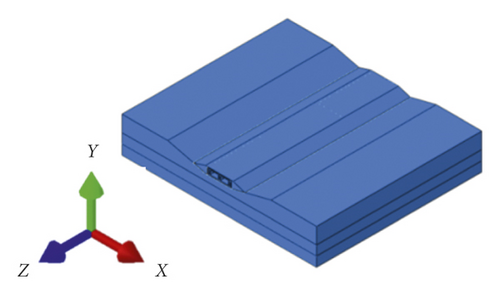
The tunnel immersed below the Tianjin Haihe River is a two-hole, three-pipe gallery structure (Figure 5(a)). The width of the immersed tunnel is 36.6 m, the height of its cross section is 9.65 m, and the thicknesses of the roof, floor, side wall, and partition wall are 1.35 m, 1.4 m, 1.0 m, and 0.6 m, respectively. The span of pipe gallery on both sides is 2.6 m, the span of the middle elements gallery is 2 m, and the span of the dual holes is 12.5 m. The tunnel consists of three pipes (E1–E3); the length of a single pipe is 85 m. The thickness of the crushed-stone soil cover above the structure is 1.0 m. The tunnel is composed of C40 concrete. The clay layer in the Haihe Tunnel is defined here as the soil layer, which is divided into three sublayers. The material parameters of the soil and structure are shown in Tables 2 and 3.

Details are in the caption following the image
Pipe model and overall model. (a) A single pipe model; (b) overall model.
Details are in the caption following the image
Pipe model and overall model. (a) A single pipe model; (b) overall model.
Table 2. Structural material parameters.
Material Density (kg·m−3) Modulus of elasticity (MPa) Poisson’s ratio
Concrete 2500 32500 0.16
Steel cable 7000 200000 0.3
Crushed-stone soil (superimposed soil) 1500 150 0.15
Table 3. Soil parameters.
Type Depth (m) Density (kg·m−3) Shear velocity (m) Poisson’s ratio Cohesion (kPa) Internal friction angle (°)
Soil layer 1 0–25 2000 200 0.27 14.6 24.3
Soil layer 2 25–40 2100 300 0.30 22.0 18.0
Soil layer 3 40–55 2200 400 0.30 24.0 20.0

We established a 3D finite-element model (300 m × 255 m × 55 m) of the Haihe River immersed tunnel using the parameters discussed above. The overall model includes three pipes (E1–E3), soil layers, and superimposed soil (Figure 5(b)). Around the cut-off boundary and the bottom boundary, a viscous-spring artificial boundary approximates an infinite field. We used the Mohr–Coulomb model for the soil and the plastic damage model in ABAQUS for the concrete.

4.2. Seismic Wave Input

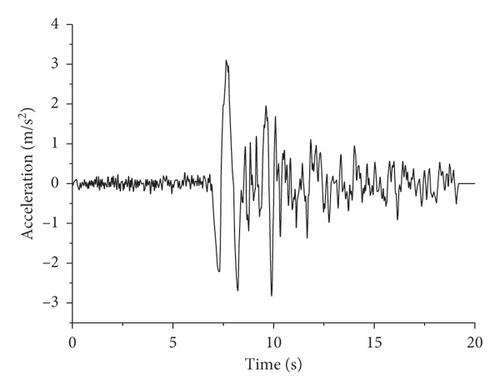
A Tianjin wave was input at the bottom of the model with a 20 s duration, 0.02 s interval, and peak acceleration of 3.1 m/s2 (Figure 6). Per the incident angle definition above (Figure 2) and the critical incident angle of the SV wave in this model (32.3°), the propagation directions of seismic waves are selected as α1 = 0°, 30°, 60° and α2 = 0°, 15°, 30°; this produced nine angle-of-incidence combinations. We used the dynamic relaxation method for static application. The seismic wave was input after 1 s of the static calculation; the entire calculation time was 21 s.
Details are in the caption following the image
Tianjin wave acceleration time history.

4.3. Results

The pipe joint and shear key are significant components in the immersed tunnel—their inherent weakness may result in serious, even irreversible damage to the whole tunnel in the case of an earthquake. We first calculated and analyzed the mechanical properties of the pipe joint and the shear key, then the deformation of the tunnel (including three pipes) under typical earthquake conditions.

4.3.1. Analysis of Shear Keys

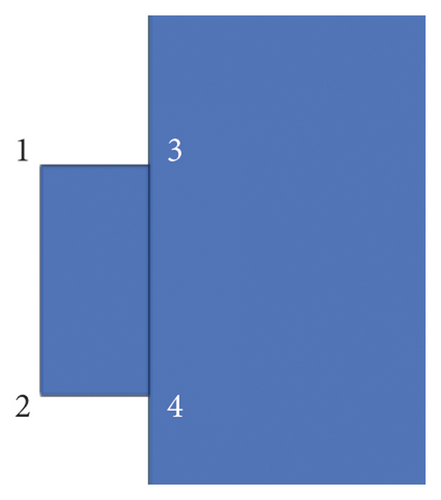
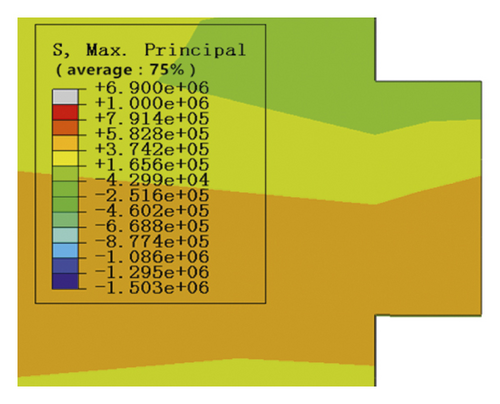
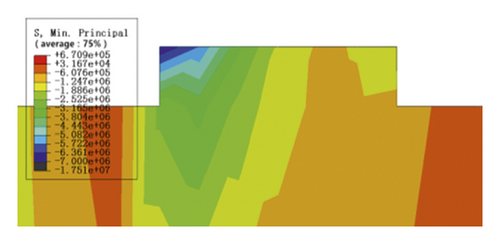
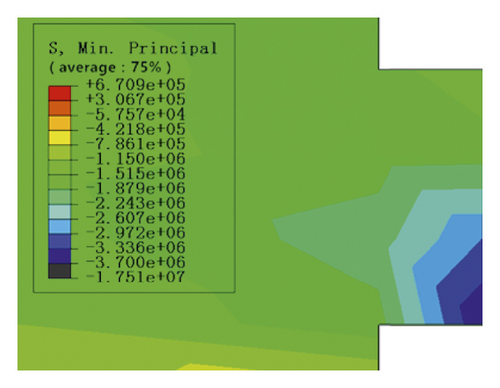
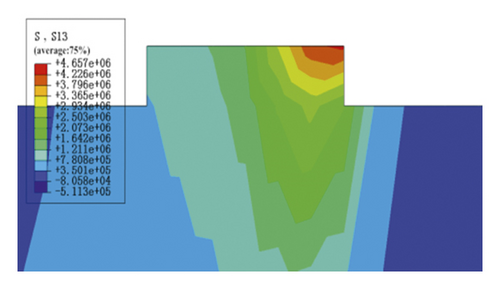
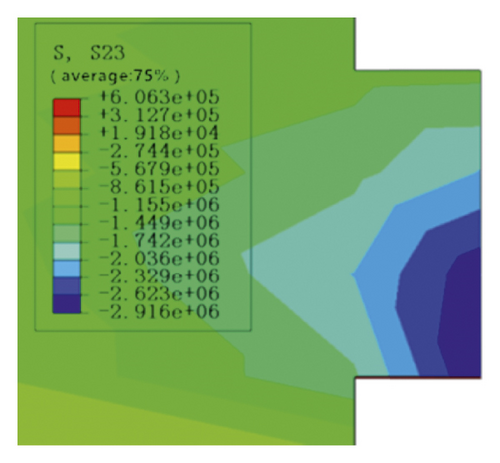
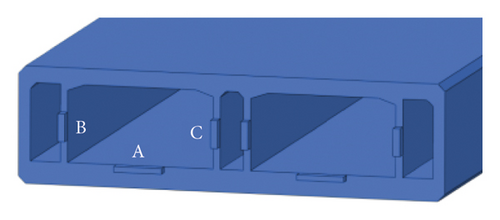
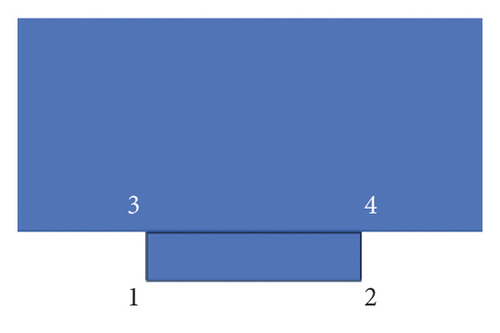
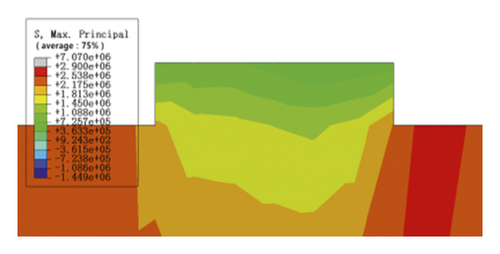
The three shear keys on the left side of the E1-E2 section interface are numbered A, B, and C. Each shear key was marked with four corners (numbered 1–4) as monitoring points, as shown in Figure 7. The maximum principal stress, minimum principal stress, and shear stress of each monitoring point under the nine different incident angle combinations were extracted as shown in Tables 46. Among them, the maximum principal stress, minimum principal stress, and shear stress value of each monitoring point of shear key are maximal when the incidence angle is (30°, 30°), indicating that the angle combination of (30°, 30°) is the most unfavorable (which is close to the critical angle of incidence of SV waves in the half-space). The second-worst is the angle of incidence (60°, 30°). Figure 8 shows a stress cloud chart of the horizontal shear key A and vertical shear key B (30°, 30°).
Details are in the caption following the image
Shear key sketches. (a) Shear key distribution at joint interface; (b) horizontal shear key A; (c) vertical shear key B and C.
Details are in the caption following the image
Shear key sketches. (a) Shear key distribution at joint interface; (b) horizontal shear key A; (c) vertical shear key B and C.
Details are in the caption following the image
Shear key sketches. (a) Shear key distribution at joint interface; (b) horizontal shear key A; (c) vertical shear key B and C.
Table 4. Maximum principal stress (MPa).
Points Angle
0°, 0° 0°, 15° 0°, 30° 30°, 0° 30°, 15° 30°, 30° 60°, 0° 60°, 15° 60°, 30°
A 1 0.611 0.407 1.481 0.619 0.458 2.647 0.418 0.290 1.580
2 0.270 0.299 0.808 0.334 0.343 2.769 0.245 0.264 1.513
3 2.285 2.095 4.394 2.014 1.842 3.548 1.537 1.270 3.003
4 1.039 1.128 3.659 1.207 1.076 6.312 1.047 0.944 4.629
  
B 1 0.0079 0.0086 0.0536 0.0114 0.0094 0.823 0.0147 0.0135 0.853
2 0.163 0.159 0.703 0.723 0.701 1.146 0.710 0.794 0.729
3 0.251 0.234 0.546 0.222 0.213 0.958 0.153 0.161 1.213
4 0.288 0.212 0.755 0.724 0.709 2.063 0.768 0.839 0.762
  
C 1 0.0061 0.0046 0.0258 0.0098 0.0101 0.0688 0.0163 0.0045 0.257
2 0.0628 0.0024 0.379 0.211 0.182 0.473 0.283 0.352 0.431
3 0.0620 0.0629 0.219 0.0590 0.0143 0.165 0.0862 0.0501 0.723
4 0.124 0.119 0.410 0.260 0.236 0.681 0.402 0.443 0.517
Table 5. Minimum principal stress (MPa).
Points Angle
0°, 0° 0°, 15° 0°, 30° 30°, 0° 30°, 15° 30°, 30° 60°, 0° 60°, 15° 60°, 30°
A 1 −3.737 −2.599 −7.800 −3.797 −2.279 −18.67 −2.908 −1.261 −17.22
2 −3.461 −3.389 −6.089 −4.080 −3.140 −25.53 −2.879 −2.875 −17.62
3 −3.737 −2.599 −7.800 −3.797 −2.279 −18.67 −2.908 −1.261 −17.22
4 −3.461 −3.389 −6.089 −4.070 −3.140 −25.53 −2.879 −2.875 −17.62
  
B 1 −1.281 −0.995 −2.160 −1.495 −1.414 −6.879 −2.653 −2.029 −7.228
2 −1.787 −1.943 −6.621 −4.193 −3.727 −13.04 −6.094 −6.270 −9.048
3 −1.890 −1.889 −2.879 −2.219 −2.091 −6.879 −2.705 −3.100 −7.228
4 −1.787 −1.943 −6.621 −4.193 −3.927 −13.04 −6.094 −6.270 −9.048
  
C 1 −0.641 −0.640 −1.458 −1.036 −0.898 −2.052 −1.761 −1.269 −4.529
2 −1.248 −1.307 −4.695 −3.144 −2.601 −6.897 −4.464 −3.885 −7.460
3 −1.266 −1.329 −2.138 −1.517 −1.373 −2.755 −1.950 −1.754 −4.529
4 −1.232 −1.307 −4.695 −3.144 −2.601 −6.897 −4.464 −3.885 −7.460
Table 6. Shear stress (MPa).
Points Angle
0°, 0° 0°, 15° 0°, 30° 30°, 0° 30°, 15° 30°, 30° 60°, 0° 60°, 15° 60°, 30°
A 1 1.105 0.938 2.273 1.134 0.770 5.050 0.938 0.490 4.782
2 1.127 1.103 2.366 1.307 1.051 7.600 1.009 0.988 5.372
3 1.105 0.938 2.273 1.134 0.770 5.050 0.938 0.490 4.782
4 1.127 1.103 2.221 1.307 1.051 7.600 1.009 0.988 5.372
  
B 1 0.326 0.343 1.055 0.731 0.690 1.900 0.986 0.991 1.226
2 0.359 0.419 1.723 0.945 0.885 3.678 1.505 1.517 2.691
3 0.318 0.248 0.939 0.560 0.516 1.900 0.856 0.853 1.345
4 0.359 0.419 1.723 0.945 0.885 3.549 1.505 1.517 2.691
  
C 1 0.194 0.218 0.711 0.506 0.437 1.005 0.714 0.620 1.161
2 0.217 0.252 1.218 0.752 0.580 1.878 1.096 0.924 2.179
3 0.194 0.202 0.653 0.392 0.315 1.061 0.633 0.520 1.078
4 0.217 0.252 1.174 0.752 0.499 1.729 1.096 0.918 2.175
  • Note. The angle is expressed as (α1, α2), the angle between the incident wave projecting to the ZX plane and the X axis is α1, and the angle between the incident wave and the Y-axis is α2.
Details are in the caption following the image
Shear key stress nephogram at incidence of (30°, 30°). (a) Maximum principal stress of shear key A; (b) maximum principal stress of shear key B; (c) minimum principal stress of shear key A; (d) minimum principal stress of shear key B; (e) shear stress of shear key A; and (f) shear stress of shear key B.
Tables 46 and Figure 8 altogether indicate the following.
  • (1)

    The shear key produces significant compressive stress during an earthquake while the shear stress and tensile stress are relatively low.

  • (2)

    When the seismic wave incidence transforms from vertical to oblique along the pipe cross section (that is, α2  gradually increases), and the incident angle is small (less than 15°), the stress value of the shear key-monitoring point is fairly stable. With further increase in the incident angle, the stress value increases significantly to a maximum stress of 25.53 MPa, which is 7.1 times greater than the corresponding vertical incidence.

  • (3)

    When the incidence direction of the seismic wave transforms from the tunnel transverse direction to the axial (that is, α1  gradually increases), the maximum principal stress, minimum principal stress, and shear stress of the horizontal shear key A and vertical shear key B increase at first and then decrease. The maximum principal stress of the vertical shear key C increases at first and then decreases while its minimum principal stress and shear force continue to increase.

  • (4)

    The horizontal shear stress distribution of compressive stress and shear stress is very uniform, the top corner has stress concentration phenomenon, and the tensile stress is mainly concentrated at the root of the shear key. The stress of the vertical shear keys B and C assumes a trapezoidal distribution, that is, the stress at the lower part of the shear key is greater than the upper stress. Tables 46 show that the stress of shear key B on the side wall is greater than that of shear key C on the middle partition wall. Seismic designers, to this effect, are recommended to focus on the root of the shear key which connects the shear key and immersed pipe body as well as the vertical shear key; the choice of reinforced concrete materials for the vertical shear key in the outer partition wall is particularly important.

4.3.2. Dislocation (Opening) of Pipe Joint

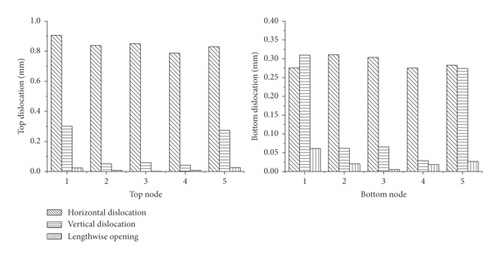
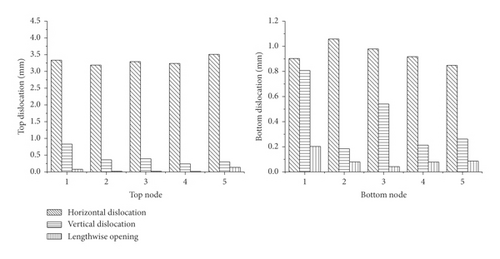
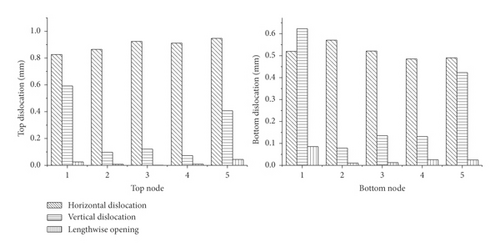
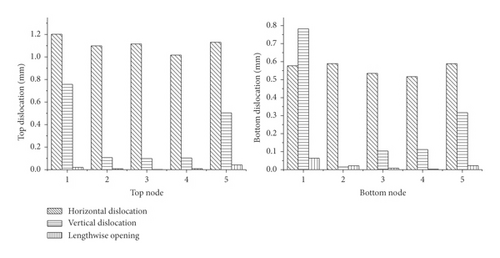
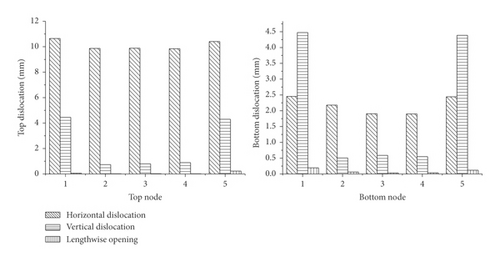
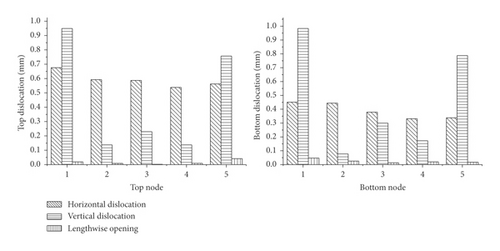
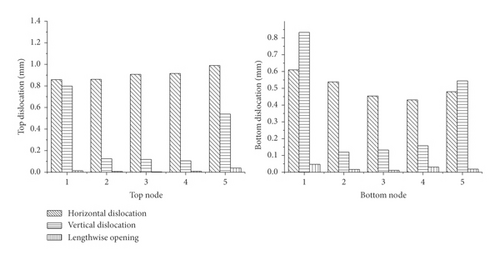
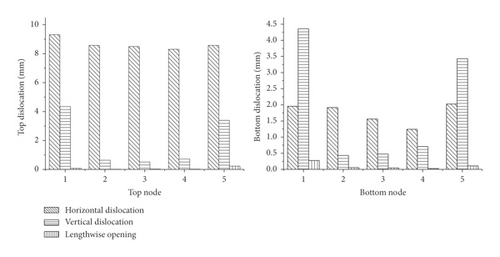
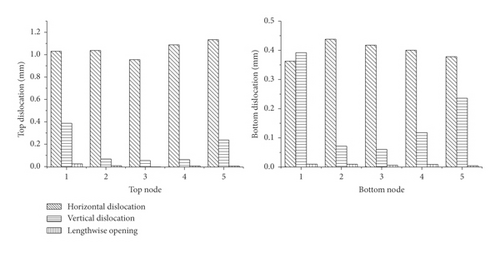
As shown in Figure 9, we selected five nodes of the roof and the floor, respectively, at the E1–E2 pipe joint interface and determined the relationship between the dislocation (opening) and the incident angle of the seismic wave. The results are shown in Figure 10.

Details are in the caption following the image
Nodes at the pipe joint interface.
Details are in the caption following the image
Joint dislocation (opening) at different angles of incidence. (a) Dislocation (opening) of roof and floor at pipe joints under incident angle (0°, 0°); (b) dislocation (opening) of roof and floor at pipe joints under incident angle (0°, 15°); (c) dislocation (opening) of roof and floor at pipe joints under incident angle (0°, 30°); (d) dislocation (opening) of roof and floor at pipe joints under incident angle (30°, 0°); (e) dislocation (opening) of roof and floor at pipe joints under incident angle (30°, 15°); (f) dislocation (opening) of roof and floor at pipe joints under incident angle (30°, 30°); (g) dislocation (opening) of roof and floor at pipe joints under incident angle (60°, 0°); (h) dislocation (opening) of roof and floor at pipe joints under incident angle (60°, 15°); and (i) dislocation (opening) of roof and floor at pipe joints under incident angle (60°, 30°).

The vertical dislocation value can be obtained without indicating the direction of dislocation, as shown in Figure 10. In fact, the vertical dislocation directions at both ends of the cross section of the model are opposite.

The dislocation volume at the joint is significantly affected by the seismic wave incidence angle. The horizontal and vertical dislocations of the roof and floor of the immersed tunnel joints increase as the local seismic wave incidence changes from vertical to oblique along the pipe cross section (α2  increases) and that of the maximum value is under (30°, 30°). The maximum value of horizontal dislocation at the roof is 10.64 mm, which is 11.9 times greater than the corresponding vertical incidence. The maximum horizontal dislocation at the floor is 2.45 mm, which is 3.7 times greater than the corresponding vertical incidence. The maximum vertical dislocation at the roof is 4.44 mm, which is 6.5 times greater than the corresponding vertical incidence. The maximum vertical dislocation of the floor is 4.47 mm, which is 6.2 times greater than the corresponding vertical incidence.

When the incidence direction of the seismic wave transforms from the tunnel transverse direction to the axial (α1  increases), the horizontal dislocation at the position of the roof and the floor of the pipe joint interface first increases and then decreases as vertical dislocation continuously increases. The lengthwise opening at the tunnel joint is very small (0.2 mm maximum at the bottom of the joint).

The horizontal dislocations at joints are similar at a certain angle of incidence. The end nodes are larger than the intermediate nodes in the vertical dislocation, and the direction of dislocation is opposite; in other words, the immersed tunnel shows torsional deformation. When the incident angle is (30°, 30°), the D-value of the vertical dislocation between the end node and the intermediate node of the floor joint is maximal (0.014°), which is in the scope of security.

4.3.3. Overall Deformation of Immersed Tunnel

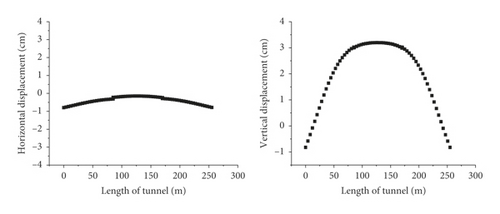
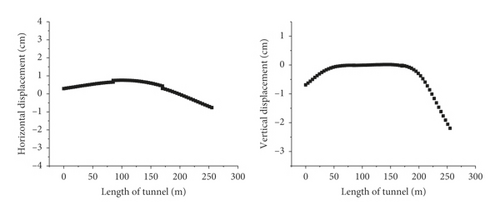
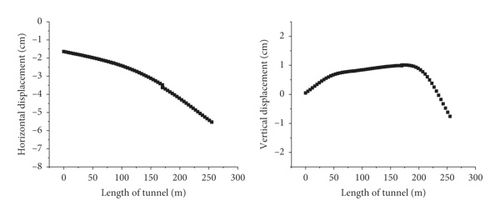
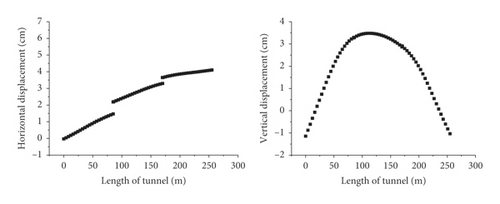
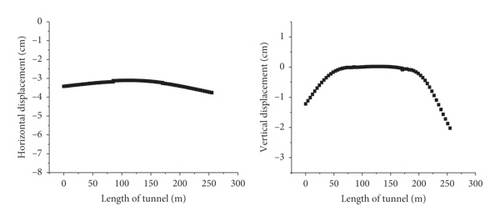
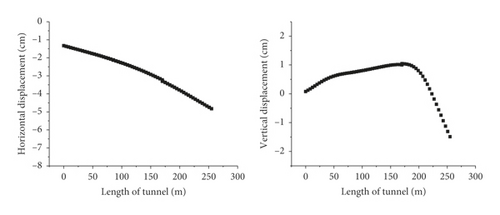
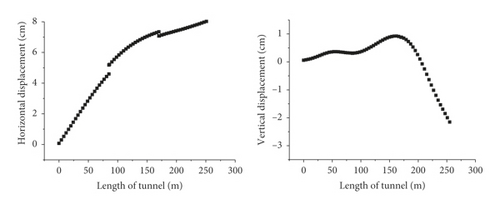
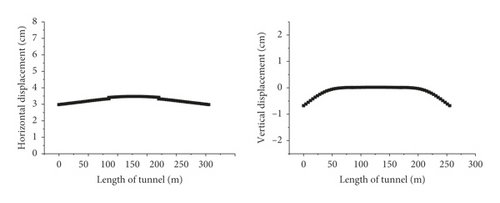
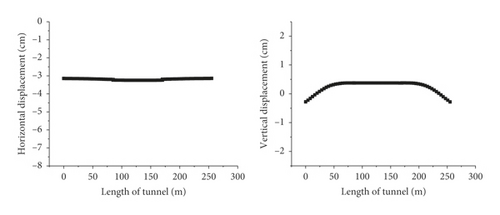
The nodes from the immersed tunnel’s central axis including three pipes were used to draw horizontal and vertical dislocation curves at the maximum stress (Figure 11).
Details are in the caption following the image
Horizontal and vertical displacements of immersed tunnel at different incident angles. (a) Horizontal and vertical displacement of immersed tunnel under (0°, 0°); (b) horizontal and vertical displacement of immersed tunnel under (0°, 15°); (c) horizontal and vertical displacement of immersed tunnel under (0°, 30°); (d) horizontal and vertical displacement of immersed tunnel under (30°, 0°); (e) horizontal and vertical displacement of immersed tunnel under (30°, 15°); (f) horizontal and vertical displacement of immersed tunnel under (30°, 30°); (g) horizontal and vertical displacement of immersed tunnel under (60°, 0°); (h) horizontal and vertical displacement of immersed tunnel under (60°, 15°); (i) horizontal and vertical displacement of immersed tunnel under (60°, 30°).

Figure 11 shows that as the seismic wave incidence changes from vertical to oblique along the pipe cross section (that is, α2  increases), the horizontal and vertical displacement of the immersed tunnel increases. When the incidence direction of seismic wave transforms from the tunnel transverse direction to the axial (that is, α1  increases), the overall horizontal and vertical displacement of the tunnel first increases and then decreases.

Furthermore, when the seismic wave is transversely incident (α1 = 0°), the horizontal and vertical displacement distributions at intermediate tunnel joints are larger than at both sides; the displacement of both sides of tunnel joints at the pipe ends is basically the same. The horizontal displacement difference and vertical displacement difference of both sides of the tunnel (E1 and E3) joint increase as α1 increases, resulting in axial tensile deformation. When the angle of incidence is (60°, 30°), the horizontal dislocation difference of the end tunnel section reaches its maximum value. The axial tensile strain is approximately 1.73e 7, which is in the scope of security.

4.3.4. Distribution of Cracks in Pipe Joint Cross Section

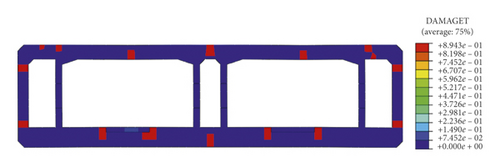
The distribution of tensile damage factors of the cross section of the immersed tunnel joint under incident angle (30°, 30°) is shown in Figure 12. This is an approximate representation of the distribution and progression of cross section cracks.

Details are in the caption following the image
Crack distribution of joint cross section under incident angle (30°, 30°). (a) t = 8 s, (b) t = 10 s, (c) t = 12 s, (d) t = 16 s, and (e) t = 20 s.
Details are in the caption following the image
Crack distribution of joint cross section under incident angle (30°, 30°). (a) t = 8 s, (b) t = 10 s, (c) t = 12 s, (d) t = 16 s, and (e) t = 20 s.
Details are in the caption following the image
Crack distribution of joint cross section under incident angle (30°, 30°). (a) t = 8 s, (b) t = 10 s, (c) t = 12 s, (d) t = 16 s, and (e) t = 20 s.
Details are in the caption following the image
Crack distribution of joint cross section under incident angle (30°, 30°). (a) t = 8 s, (b) t = 10 s, (c) t = 12 s, (d) t = 16 s, and (e) t = 20 s.
Details are in the caption following the image
Crack distribution of joint cross section under incident angle (30°, 30°). (a) t = 8 s, (b) t = 10 s, (c) t = 12 s, (d) t = 16 s, and (e) t = 20 s.

As shown in Figure 12, the end of the side wall produces cracks first and is followed by the midspan of the floor, which is connected to horizontal shear key cracks; the midspan of the roof then cracks followed by the midspan of the roof in the middle pipe gallery and four corner points of the tunnel roof. Key parts that should be strengthened in an actual engineering scenario include the tunnel corner, the midspan of the roof, and the floor—that is to say, the connections between the horizontal shear key and floor.

5. Conclusion

The 3D seismic response of an underwater immersed tunnel under obliquely incident seismic waves was investigated in this study based on simulations of the viscous-spring artificial boundary and seismic load. The influence of seismic SV wave incident angle on the 3D immersed tunnel joint and overall deformation of the tunnel is discussed by modelling the Tianjin Haihe River tunnel structure. Our main conclusions can be summarized as follows.
  • (1)

    The oblique incidence of seismic SV waves, unlike the vertical incidence, has a marked effect on the seismic response of the immersed tunnel.

  • (2)

    Among nine seismic wave combinations, the stress of the shear key is the largest under 30°, 30°; this is the worst-case angle to the site discussed in this paper. The tensile stress of the horizontal shear key is mainly concentrated where the shear key is connected to the main body of the immersed tube. The stress in the lower part of the vertical shear key is larger than that in the upper part, which makes it an important design point.

  • (3)

    The horizontal and vertical dislocation of the roof and the floor of the immersed tunnel joints increase as the seismic wave incidence angle increases; they are maximal at an incident angle of 30°, 30°. The maximum relative dislocation of tunnel joints observed in this study was about 10 mm, while the average residual compression of GINA water stops is 15 mm–25 mm. In other words, the dislocation is within a safe range. The vertical dislocation of the end section is greater than that of the intermediate node and the dislocation directions are opposite, which suggests that the deformation of the immersed tunnel is torsional.

  • (4)

    The overall horizontal and vertical displacement of the immersed tunnel increases as the seismic wave incidence angle increases. The displacement difference between the two ends of the same tunnel segment also increases, which can cause axial tensile deformation of the tunnel joints.

  • (5)

    Under the oblique incidence of SV waves, cracks appear in the ends of the side walls (the corners of the tunnel), the midspan of the roof and the floor, and the part of the horizontal shear key connected to the floor. In an actual engineering scenario, construction measures and anticracking treatment should be targeted to these key areas.

Conflicts of Interest

The authors declare that there are no conflicts of interest regarding the publication of this paper.

Acknowledgments

The research described in this paper was financially supported by the National Natural Science Foundation of China under grant numbers 51678389 and 51678390.

    Data Availability

    The data used to support the findings of this study are available from the corresponding author upon request.

      The full text of this article hosted at iucr.org is unavailable due to technical difficulties.