Frequency and Vibration Characteristics of High-Speed Gear-Rotor-Bearing System with Tooth Root Crack considering Compound Dynamic Backlash
Abstract
Considering the microstructure of tooth surface and the dynamic characteristics of the vibration responses, a compound dynamic backlash model is employed for the gear transmission system. Based on the fractal theory and dynamic center distance, respectively, the dynamic backlash is presented, and the potential energy method is applied to compute the time-varying meshing stiffness, including the healthy gear system and the crack fault gear system. Then, a 16-DOF coupled lateral-torsional gear-rotor-bearing transmission system with the crack fault is established. The fault characteristics in the time-domain waveform and frequency response and statistics data are described. The effect of crack on the time-varying meshing stiffness is analyzed. The vibration response of three backlash models is compared. The dynamic response of the system is explored with the increase in crack depth in detail. The results show that the fault features of countershaft are more obvious. Obvious fluctuations are presented in the time-domain waveform, and sidebands can be found in the frequency domain responses when the tooth root crack appears. The effect of compound dynamic backlash on the system is more obvious than fixed backlash and backlash with changing center distance. The vibration displacement along meshing direction and dynamic meshing force increases with the increase in crack depth. Backlash and variation of center distance show different tendencies with increasing crack depth under different rotational speeds. Amplitude of the sidebands increases with crack depth increasing. The amplitude of multiplication frequency of rotational frequency has an obvious variation with growing crack depth. The sidebands of the multiplication frequency of meshing frequency show more details on the system with complex backlash and crack fault.
1. Introduction
The gear transmission systems are widely used in many machinery fields, which are employed for transmitting power and changing speed. The steady operation is a necessary condition for the gear system. Therefore, the mechanism and dynamic characteristics of gear failure are a major subject in the dynamic field.
The gearbox failure is closely related to gear tooth, including spalling, pitting, crack, and broken tooth, which potentially lead to a complete damage. In order to clearly detect and diagnose in the gear transmission system, the vibration responses and fault features of the gear transmission system with fault are developed [1–3].
The typical kinds of damage are crack failure and spalling failure. The vibration responses of the gear system are closely related to the time-varying meshing stiffness (TVMS) of the gear pair. Yang and Lin [4] calculated TVMS by the potential energy method considering axial compressive energy, Hertzian energy, and bending energy. Tian [5] further investigated TVMS of a gear pair with crack. Govind et al. [6] studied TVMS, crack propagation behaviour, and the vibration responses of spur gear. Chen et al. [7] presented two improved calculation models for gear tooth fillet-foundation stiffness. When a gear pair appeared a large crack length, the computational accuracy of the two models was compared. Chen and Shao [8] developed a gear pair meshing stiffness calculation method considering tooth profile modification and tooth root crack.
Many outstanding scholars have made great contributions to the research of healthy gear system. Zhou et al. [9] presented a coupled lateral-torsional 16-DOF gear-rotor-bearing system considering piecewise periodic stiffness, friction, and eccentricity, and the motion states and frequency variations were analyzed in detail. In addition, the backlash is an important factor to ensure smooth and reliable operation. Chen et al. [10] investigated the dynamic backlash with the fractal feature and the effect of the dynamic backlash on the 2-DOF gear system. Li et al. [11] researched TVMS that was affected by tooth profile changes and developed bifurcation characteristics of the gear system. Xiang and Gao [12] calculated the differential equation of the gear transmission model with dynamic friction, TVMS, and dynamic backlash on the basis of the 4th order Runge–Kutta method and observed the effect of dynamic backlash and gear eccentricity under different rotational speeds.
Many scholars had made a mountain of work for the gearbox with crack fault. Saxena et al. [13] studied the influences of the meshing stiffness and damping on the flexible rotor-shaft system. They explored vibration responses and frequency characteristics in detail. Mohammed and Rantatalo [14] established a 6-DOF dynamic gear model to study the natural frequency and time-frequency with different crack sizes. Saeed et al. [15] researched vibration responses in the presence of single- and multi-tooth simultaneous crack using the finite element method (FEM). Ma et al. [16] established a perforated gear system with different degree cracks. The gear crack propagation paths, frequency components, and frequency values were analyzed in detail. Ma et al. [17] built a meshing stiffness model for a cracked gear system, and the influences of the crack depth and initial position were analyzed by FEM. Chen et al. [18] presented a meshing stiffness calculation method for the nonuniform tooth root crack along the tooth width. The meshing stiffness and vibration response calculated by three different algorithms were compared. Ma and Chen [19] established a 4-DOF gear system to investigate the dynamic characteristics and vibration responses with local failure and explore the failure mechanism. Hu et al. [20] presented a finite element node dynamic model for gear with crack. The RMS (root-mean-square) of the gear system parameters, vibration waveform, and frequency spectra were analyzed. Chen and Shao [21] investigated the effect of crack on a planetary gear system. Liu et al. [22] studied vibration characteristics of the planetary gear system when sun gear appeared a tooth root crack.
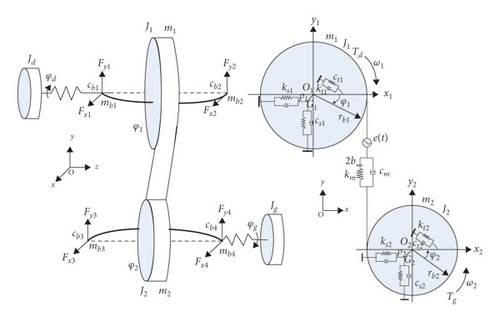
For the research of crack, some scientists devoted to establish a simple gear model, such as simplifying backlash as a fix value, employing a periodic meshing stiffness, and establishing a few-DOF model. In this paper, a 16-DOF coupled lateral-torsional gear-rotor-bearing transmission system considering compound-type dynamic backlash, TVMS, eccentricity, and friction force is established. The compound dynamic backlash on the basis of the microstructure characteristics and vibration features is defined. TVMS is calculated by the potential energy method. This complex model is employed for investigating the effect of crack faults and researching crack failure features. The vibration responses of the gear system are researched by analyzing influences of the rotational speed and crack depth value variation. The differential equations of motion are solved using the Runge–Kutta numerical method. The simulation results, including time-domain waveforms, frequency-domain spectra, and waterfall plots, are shown. We focus on the effect of the crack depth growing on a complex gear system. The amplitude statistics of sideband supply an effective reference for the condition monitoring and fault diagnosis of the gear-rotor-bearing system.
2. Dynamic Model of the Gear-Rotor-Bearing System
2.1. Lumped Mass Model of the Gear System
2.2. Time-Varying Meshing Stiffness for Gears with Tooth Crack
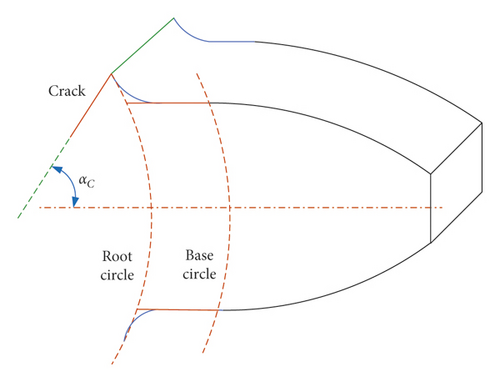
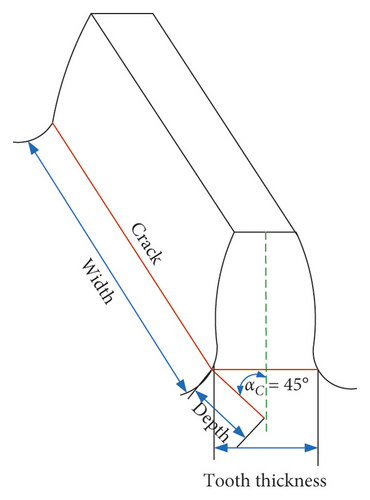
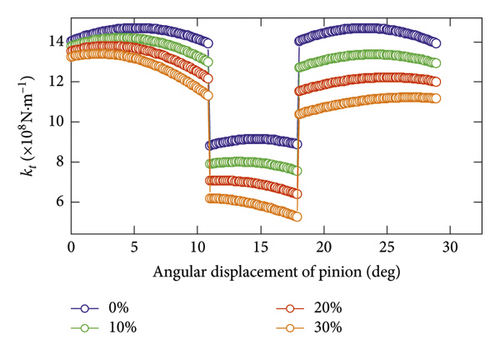
The meshing stiffness model of a gear pair with a tooth root crack was described by Tian in 2004. The energy method was used to solve the mathematical modeling problem of the gear meshing stiffness. On the basis of the research, we further investigated the gear system with a tooth root crack with time-varying meshing stiffness. The schematic graph of tooth crack is shown in Figures 2(a) and 2(b).
The overall effective meshing stiffness is given by the equations. Crack position is a tooth root of pinion. Equation (14) is input into equation (8), and then TVMS can be calculated. The time-varying meshing stiffness can be provided as shown in Figure 3.
2.3. Dynamic Backlash
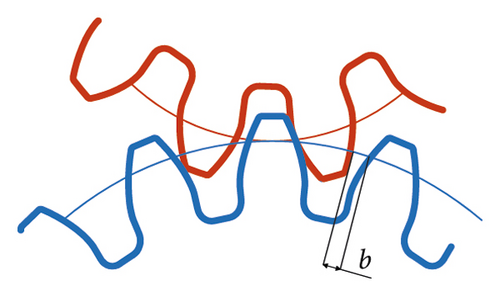
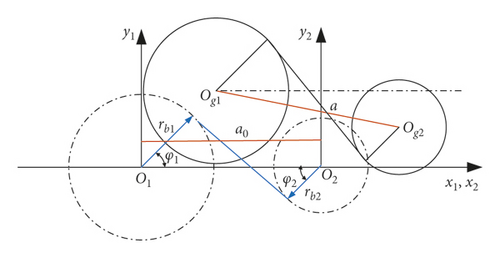
In the gear mesh process, the backlash is one of the most important factors. The backlash is the distance between two tooth profiles. In order to prevent the gears from getting stuck and ensure lubrication of gears, the backlash must exist. Rough tooth surfaces are not considered as an inherent characteristic. In the section, the compound dynamic backlash model is established considering rough tooth surface and vibration characteristic of the gear system. The sketch of backlash is shown in Figure 4. The relative displacement is generated when two rough teeth surface gears mesh.
2.4. The Friction Force
2.5. Ball Bearing Model
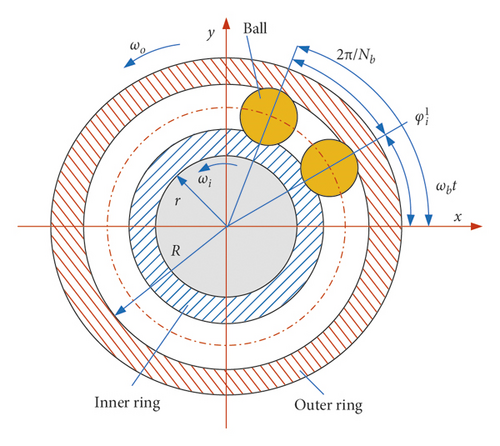
2.6. Mathematical Model of the GRBS
The nonlinear differential equation (33) of the GRBS are evolved from Lagrange’s equation.
The gear-rotor-bearing model with strong nonlinear and time-varying characteristics is established. The dynamic backlash and time-varying meshing stiffness with crack are included in the system. The main parameters are shown in Tables 1 and 2.
| Parameter | Symbol | Numerical value |
|---|---|---|
| Pressure angle | α | 20° |
| Moment of inertia | J1/J2 | 7.1 × 10⁻³/1.39 × 10−4 kg·m2 |
| Moment of inertia of input/output | Jd/Jg | 1.25 × 10⁻⁴/5.75 × 10−4 kg·m2 |
| Mass | m1/m2 | 2.6/0.9 kg |
| Stiffness of bearings | k1/k2 | 2/2 × 108 N·m−1 |
| Teeth | z1/z2 | 30/20 |
| Module | m | 4 mm |
| Tooth width | L | 0.03 m |
| Mean/amplitude of the transmission error | e0/er | 2 × 10⁻⁵/3 × 10−5 m |
| Eccentricity | ρ1/ρ2 | 3 × 10⁻⁵/2 × 10−5 m |
| Driving torque | Tl | 270 N·m |
| Loading torque | Td | 160 N·m |
| Damping ratio of gear meshing | ξm | 0.02 |
| Damping ratio of shaft | ξs/ξt | 0.1/0.1 |
| Parameter | Symbol | Numerical value |
|---|---|---|
| Outer ring radius of bearing | R1/R2 | 0.031/0.021 m |
| Inner ring radius of bearing | r1/r2 | 0.02/0.015 m |
| Contact stiffness | Kb1/Kb2 | 13.34 × 10⁹/10.56 × 109 Nm3/2 |
| Bearing clearance | γ01/γ02 | 3 × 10⁻⁵/2 × 10−5 m |
| Ball number | N1/N2 | 14/18 |
3. Dynamic Response and Discussion
3.1. Comparison of Three Backlash Models
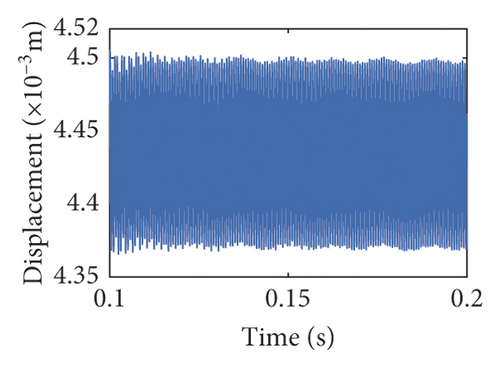
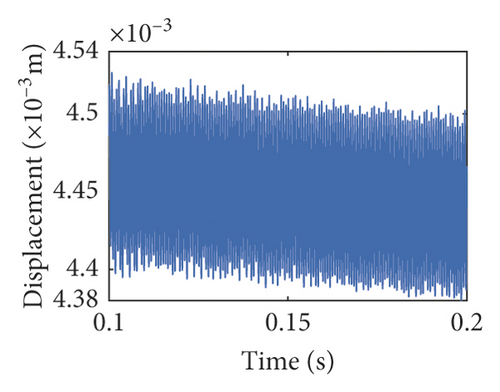
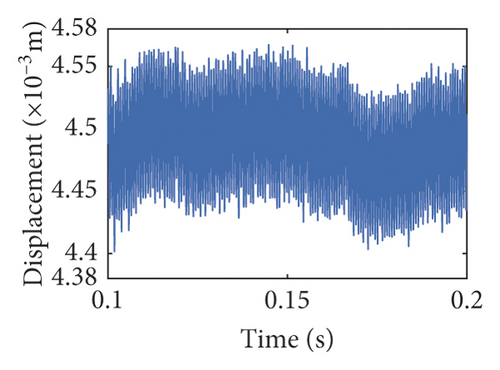
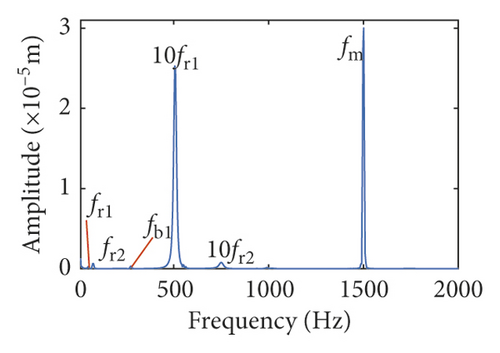
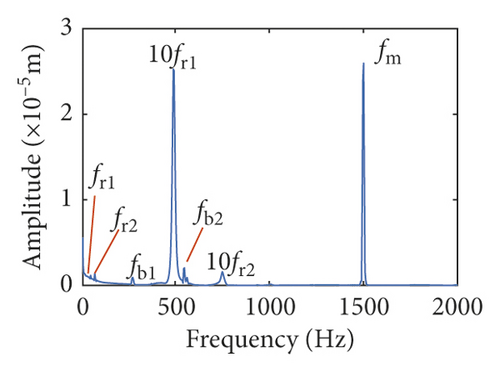
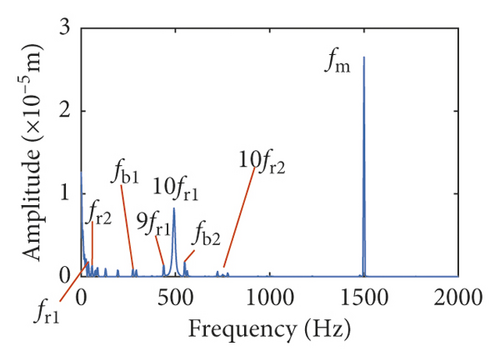
In the section, the three models about backlash are explored by the same parameters. The time-domain waveforms and frequency spectra are shown in Figures 7 and 8. The waveform of fixed backlash is stable, as is shown in Figure 7(a). The vibration waveform of dynamic backlash based on the dynamic center distance model produces significant fluctuations in Figure 7(b). It is clearly seen that the vibration displacement fluctuations of the compound dynamic backlash model are the biggest in Figure 7(c). In addition, the amplitude of 10fr1 has an obvious difference among Figures 8(a)–8(c). The frequency components of compound dynamic backlash are more than the others. It is distinct that the waveforms, frequency components, and amplitude are most different for the three models.
3.2. Dynamic Response of the Gear System with a Tooth Root Crack
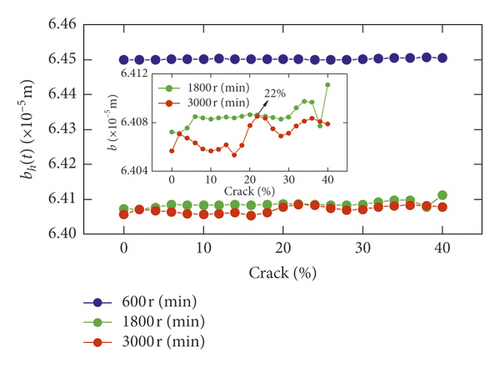
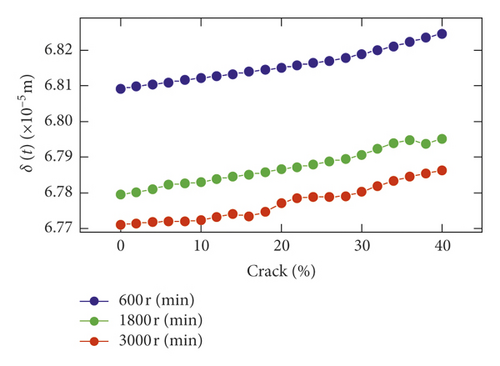
On the basis of the gear transmission system model equation (30), the vibration responses of the gear system with different crack depths are listed to investigate the effect on the system. Fractal dimension D is assumed to be 1.5, and friction coefficient μ = 0.05. The crack depth is set from zero to forty percent of the tooth thickness. Considering the different spindle speeds, such as 600 r/min, 1800 r/min, and 3000 r/min, the response characteristics are investigated under the different crack depths. In Figures 9(a)–9(d), the RMS of each significant parameter is presented, including the dynamic meshing force Fm, variation of dynamic center distance of gears Δa, the comprehensive elastic deformation δ(t), and the backlash bh(t) of the gear. Apparently, in Figure 7(a), it is stationary for the 600 r/min of the blue line with increasing crack depth. Within the limits of 0–30%, the RMS green curve of bh(t) is little different. When the rotational speed is 3000 r/min, the maximum value of the red line of bh(t) is crack 22%.
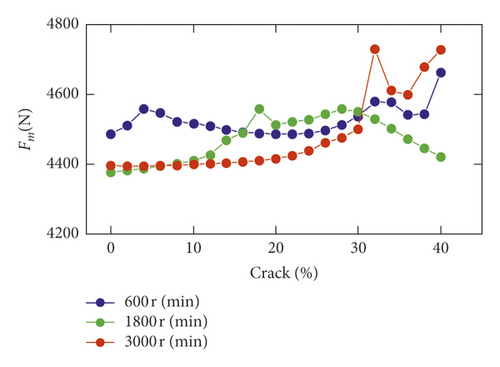
The dynamic meshing force Fm increases with the increase in crack depth in the range of 0% and 30% in Figure 9(b), setting to 1800 r/min or 3000 r/min. It indicates that Fm increases with crack depth within the limits of high speed. But, it slightly decreases in the range of low speed. When the crack is severe in the range of 30% and 40%, Fm of 600 r/min and 3000 r/min has a rapid, fluctuating increase. However, Fm of 1800 r/min is a rapid fall.
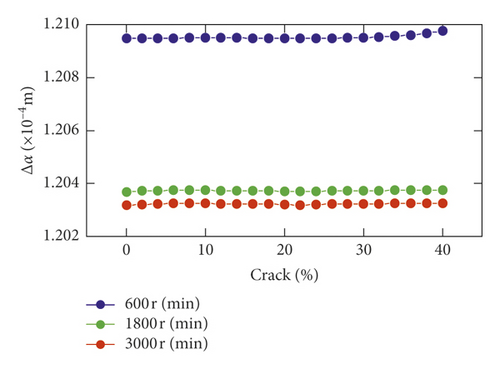
The RMS of comprehensive elastic deformation δ(t) speed increases with the increase in crack depth in Figure 9(c). But it is a fall with the increase in speed. The variation of center distance Δa(Δa = a − a0) is shown in Figures 9(d) and 10(a)–10(c). The larger the speed set, the smaller the variation value of center distance. An enlarged view of each speed is shown in Figure 10.
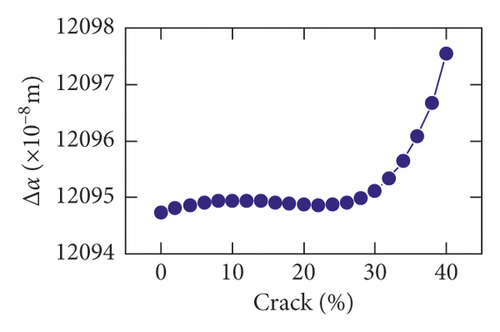
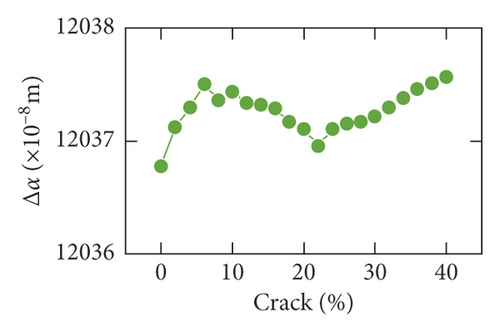
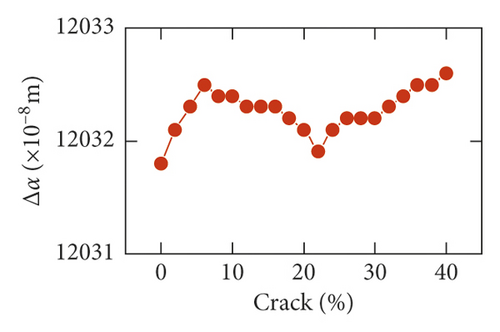
When the speed is low, the RMS of Δa slowly increases in the range of 0% and 30%, and it grows rapidly within the limit of 30% and 40%. With increasing speed, an increase in volatility is shown in Figures 10(b) and 10(c). The value corresponding to the crack 22% is the minimum value. The value corresponding to the crack 40% is the maximum value.
3.3. Vibration Responses and Frequency Characteristics with Different Crack Depths
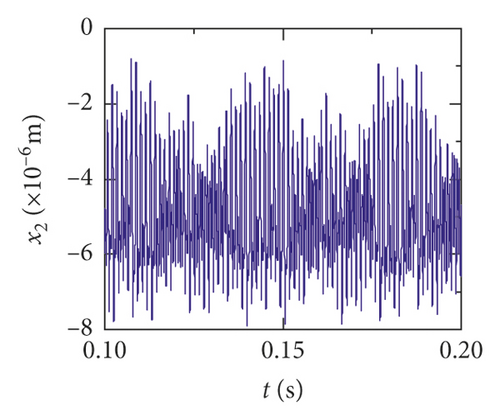
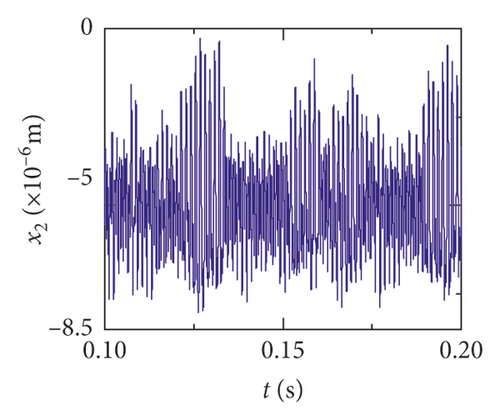
In order to study the effect of crack on dynamic responses of the system, the time-domain waveform and frequency-domain response are shown with different crack depths. The rotational speed is set to 3000 r/min. The crack depth is set to 0%, 10%, and 30% of the tooth thickness. Figures 11(a)–11(e), 12(a)–12(e), and 13(a)–13(e) display the vibration displacements of the gears and the bearings, which are, respectively, at 0%, 10%, and 30% of the tooth thickness. Figures (14)–(16) show the frequency domain responses at the different crack depths.
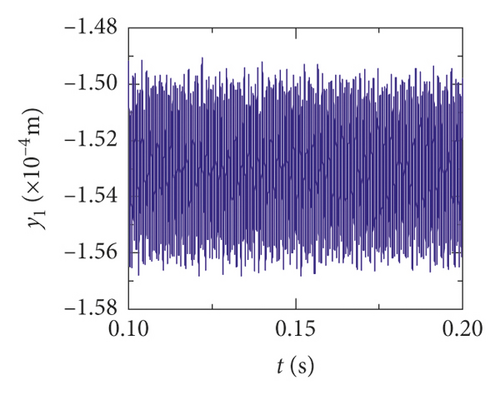
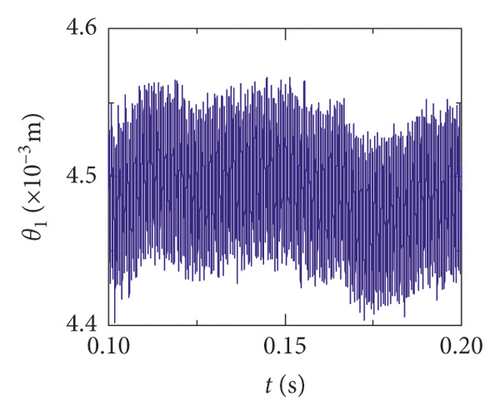
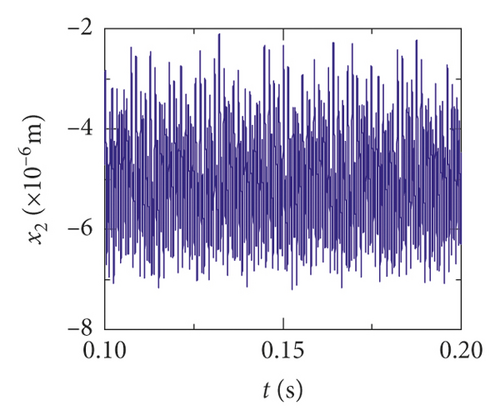
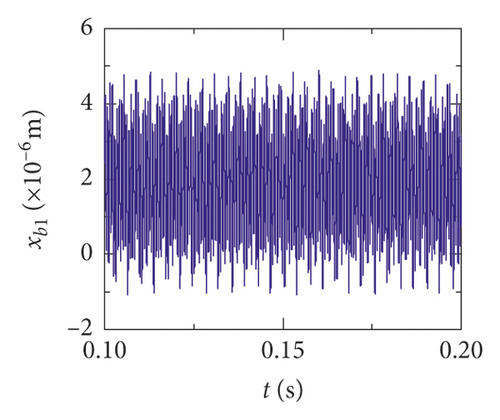
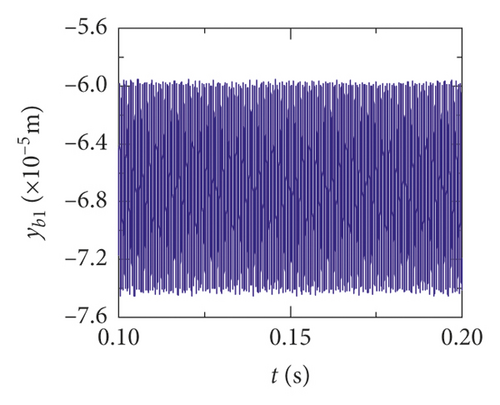
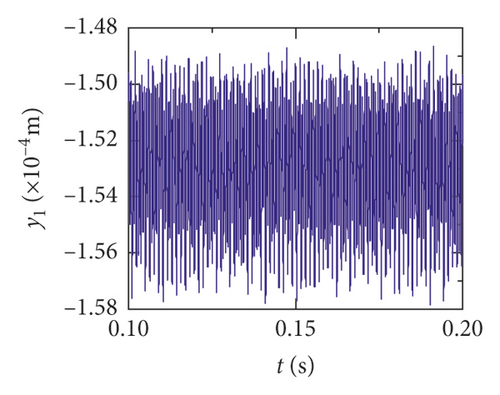
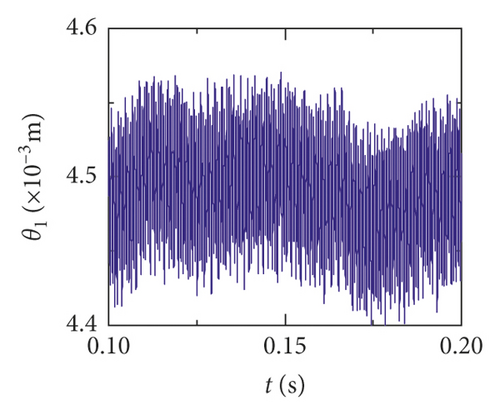
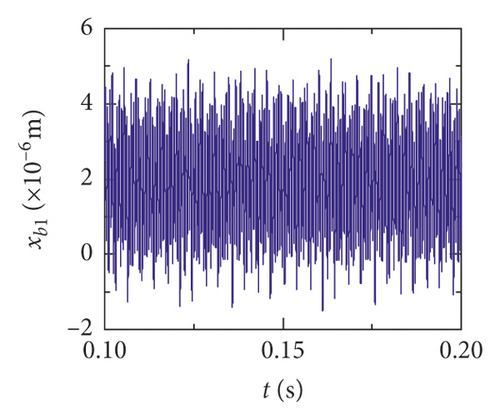
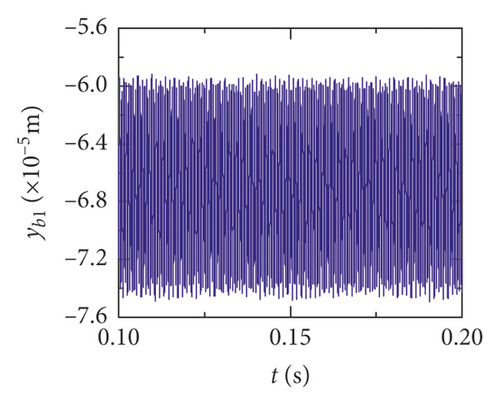
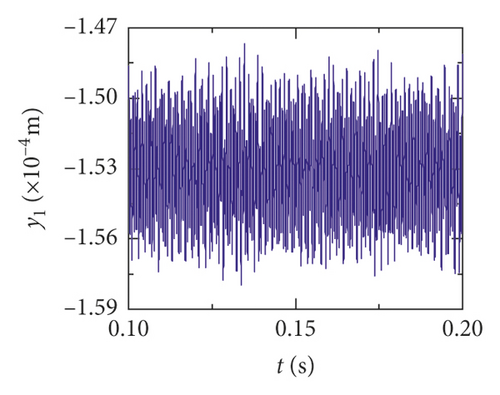
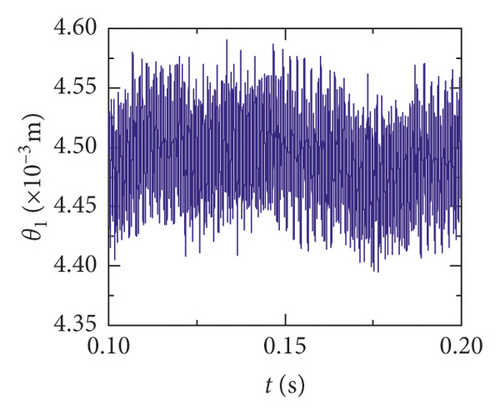
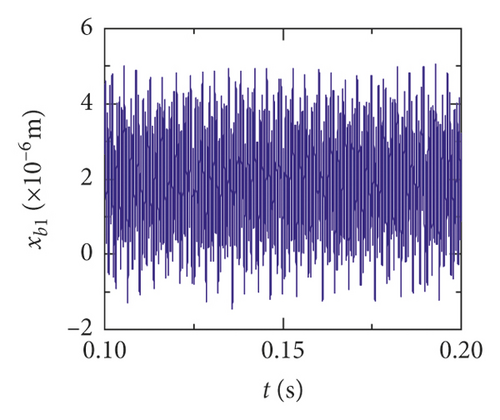
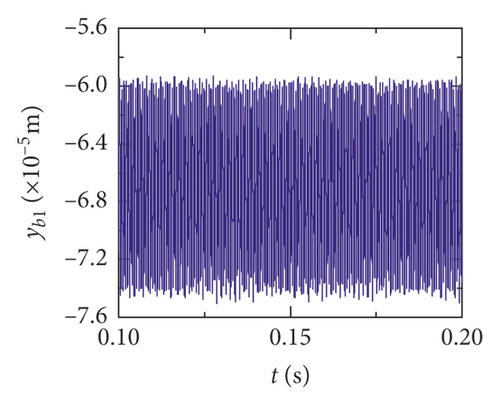
For the healthy gear system shown in Figure 11(b), the fluctuation of the vibration displacement in torsional direction (θ1) is more obvious than others. It indicates that the vibration response in torsional direction (θ1) is more sensitive to nonlinear factors and excitation. In Figure 11(e), those factors have less impact on the vibration of the bearing.
The time-domain waveform will exist as a pulse in theory when a tooth root crack appears. Though the variation of waveform in all directions is obvious in Figures 12 and 13, a pulse is covered with the fluctuation caused by other excitation factors. So, the pulse form that should have been generated is not so obvious. The amplitude of the pinion in x2 direction is distinctly increased because of the crack fault, and the change of waveform is also obvious in Figures 12(c) and 13(c). In addition, the amplitude of the other directions has a slight increase, as is shown in Figures 12(a), 12(b), 13(a), and 13(b). The vibration response of the bearing is among those least affected in Figures 12(d), 12(e), 13(d), and 13(e).
Obviously, the effect of a tooth root crack on vibration response of the gear system components is different. In the case of vibration response in x2 direction, the statistic datum from the results shows that the amplitude of crack 10% increases by 1.428 times than the healthy system. The amplitude increases by 1.735 times than the healthy system. But the rate of increase of vibration amplitude on the bearing does not exceed 15%. In addition, the time-domain waveform fluctuates more intense in x2 direction. For transverse (xb1) and longitudinal (yb1) vibrations of the bearing, the vibration waveforms become more disordered because a tooth root crack appears, as is shown in Figures 12(d), 12(e), 13(d), and 13(e). But the amplitudes of vibration are less changed.
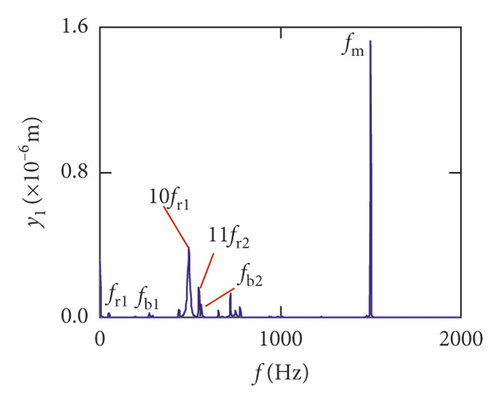
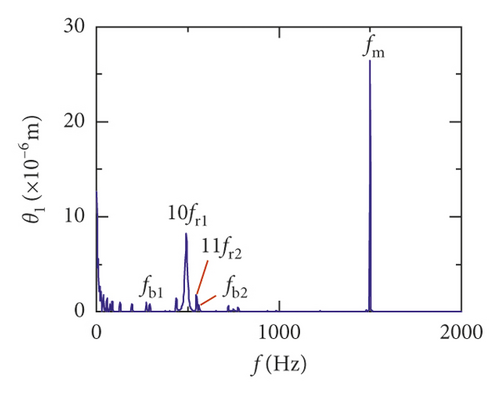
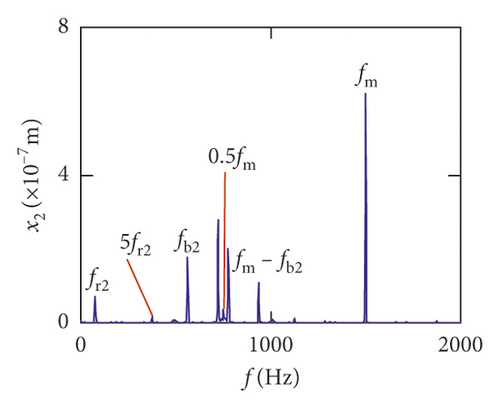
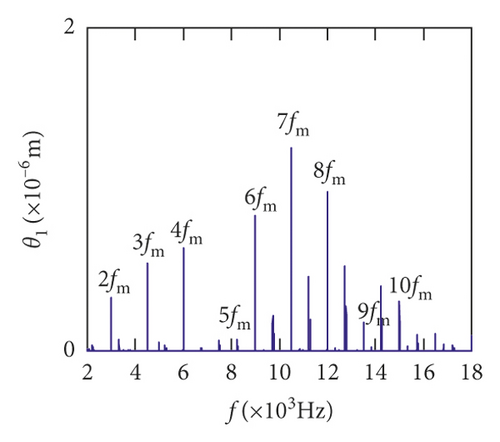
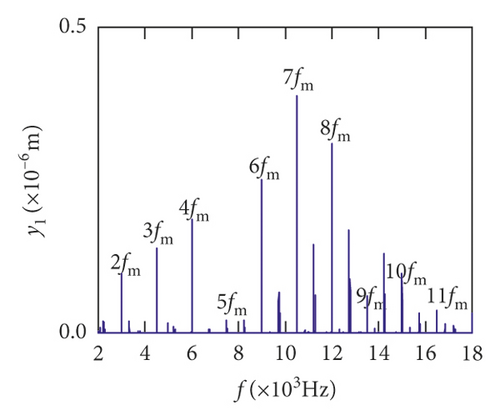
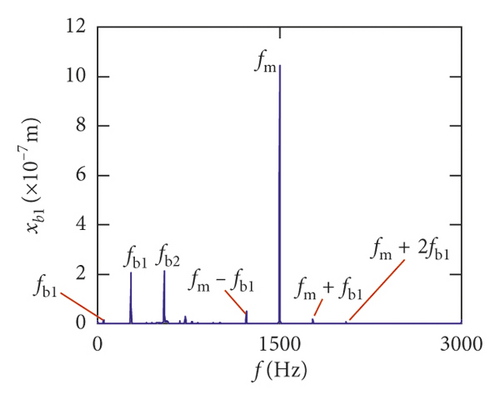
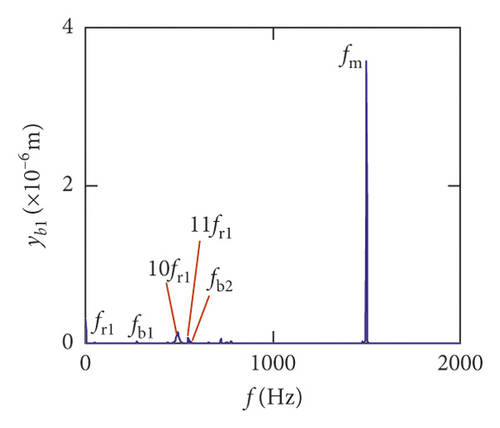
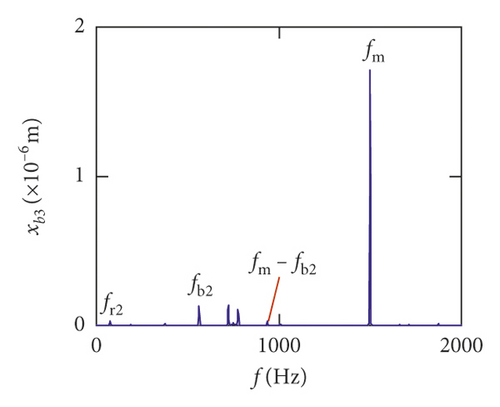
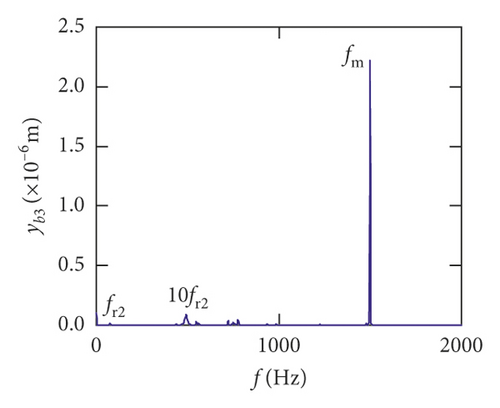
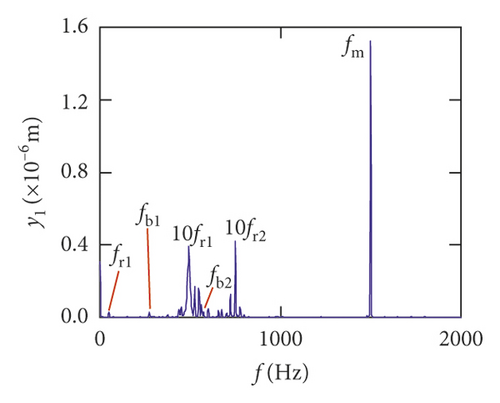
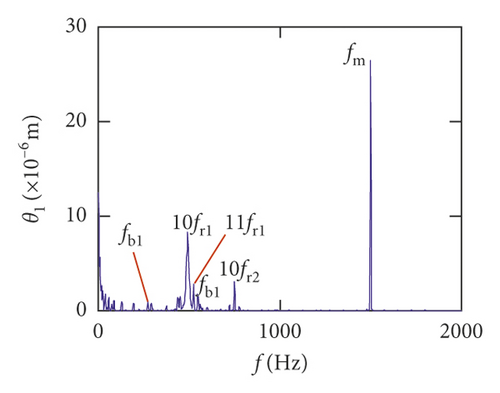
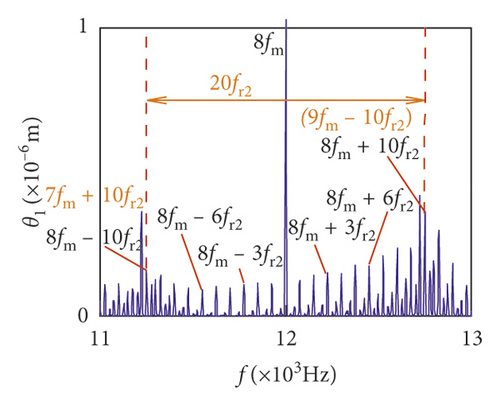
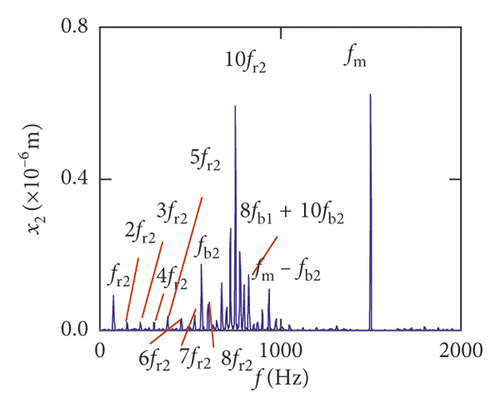
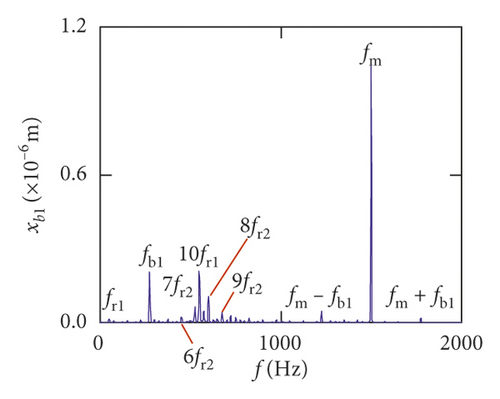
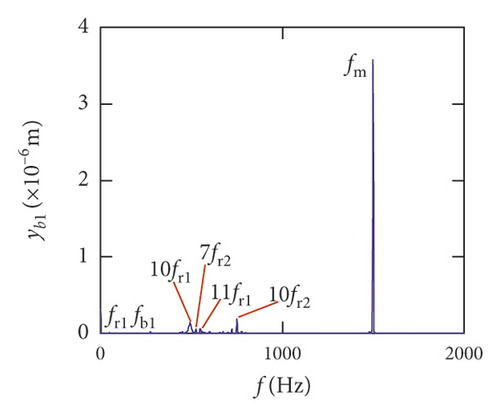
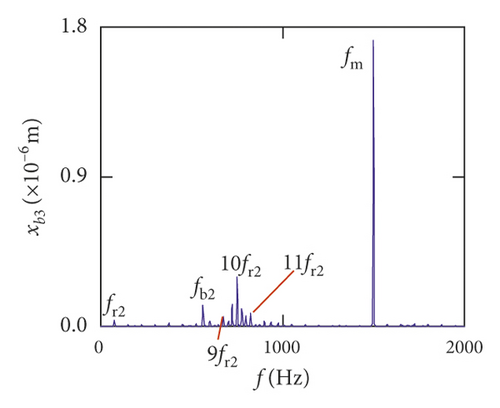
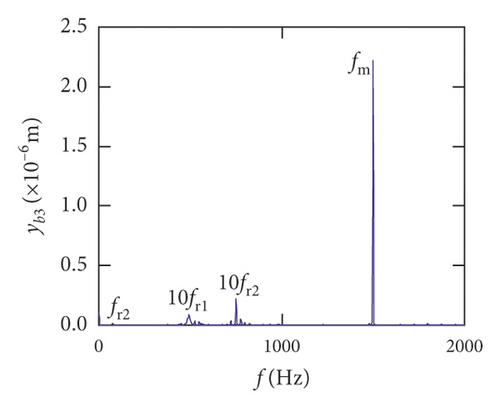
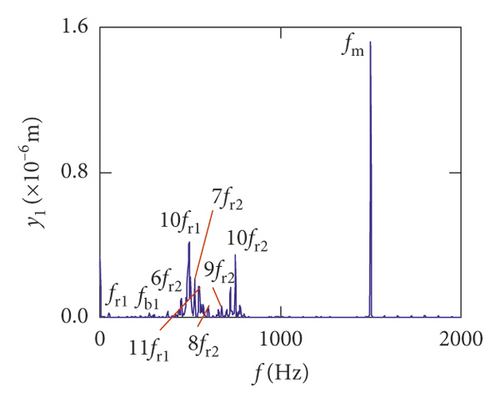
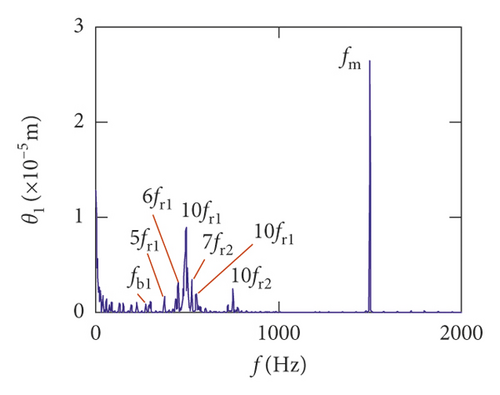
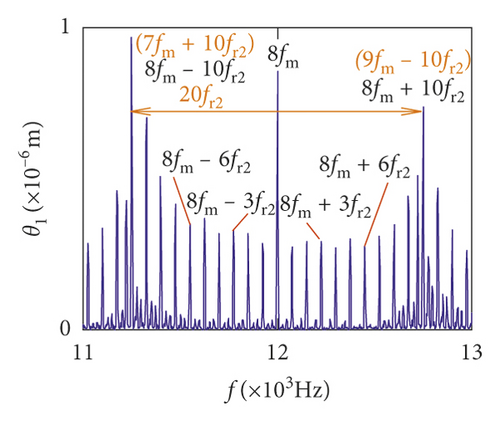
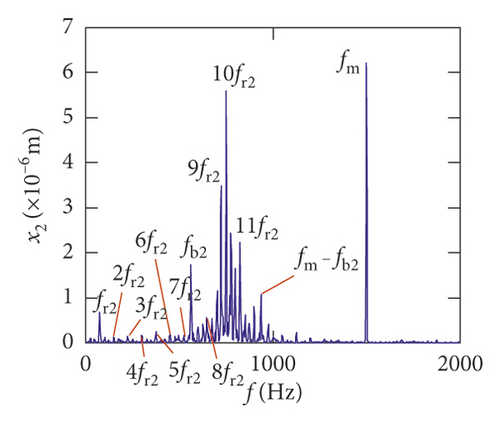
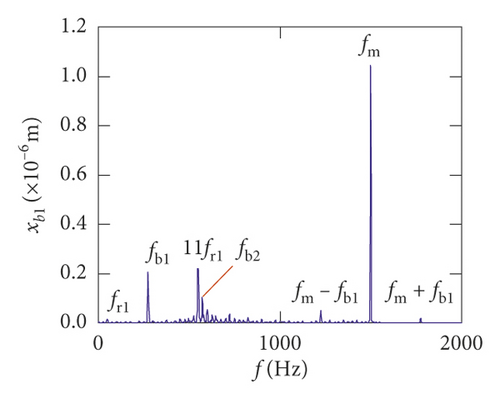
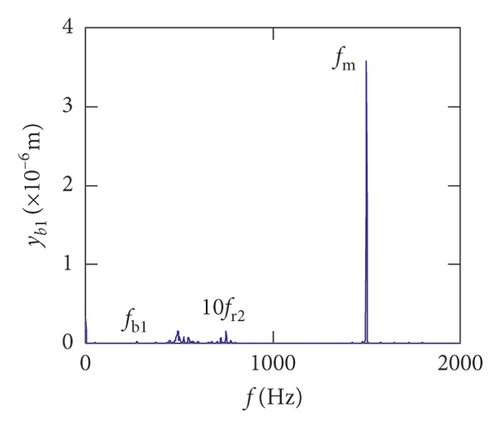
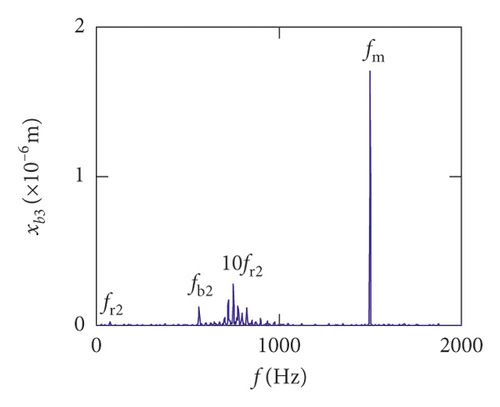
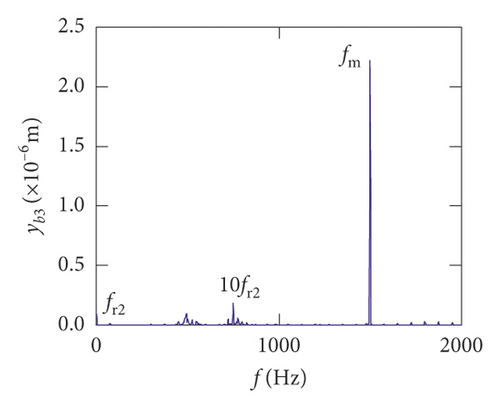
Figures (14)–(16) display, respectively, the frequency spectra of the healthy gear system, gear system with crack 10%, and gear system with crack 30%. The vibration frequency on the healthy gear system is explained in Figures 14(a)–14(i). In the healthy frequency spectra, it is obviously shown that the rotating frequency fr1 (fr1 = n1/60 = 50 Hz) and the mesh frequency fm (fm = n1z1/60 = 1500 Hz) are presented in Figure 14. However, besides fr1 and fm, the rotating frequency fr2 (fr2 = n2/60 = 75 Hz), variable stiffness frequencies fb1 (fb1 = N1r1n1/60(R1 + r1) = 274.3 Hz) and fb2 (fb1 = N2r2n2/60(R2 + r2) = 563.4 Hz), and combination frequency 0.5fm(10fr2), 2fm, 3fm, fm − fb1, fm + fb1, and fm − fb2 can be observed in the frequency spectra.
The meshing frequency fm is the highest amplitude and the (0.5fm)10fr1 is the second highest in y1 and θ1 direction, as is shown in Figures 14(a) and 14(b). Besides, multiplication frequency of meshing frequency fm can be seen in Figures 14(d) and 14(e), including 2fm, 3fm, 4fm, 5fm, 6fm, 7fm, 8fm, 9fm, 10fm, and 11fm. In order to further explore the bearing vibration frequency, Figures 14(f)–14(i) are presented. It is clearly observed that fm are the highest amplitude frequency. But the frequency components of the transverse (xb1, xb3) are more abundant than longitudinal (yb1, yb3).
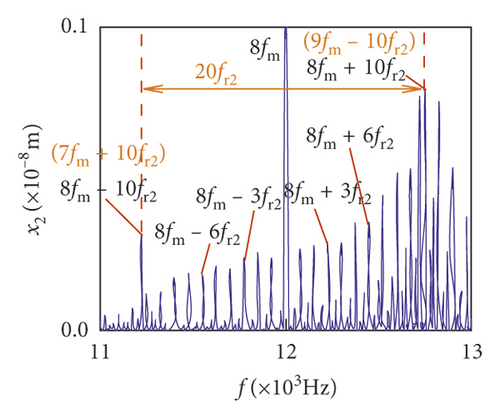
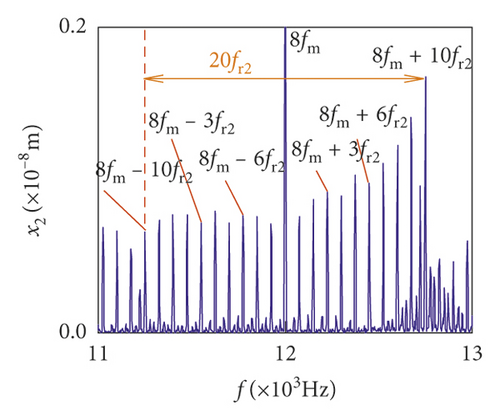
For crack 10%, the sidebands near multiplication frequency components can be found in Figures 15(b) and 15(d). The range of the whole sideband of 8fm is 20fr2. In addition, it is a significant phenomenon for the early cracked gear system that obvious multiplication frequency of fr2 (75 Hz) is observed in Figures 15(f)–15(i). This phenomenon is not found from the healthy gear system. In bearing frequency spectra, sidebands in xb1 and xb3 directions are more obvious than in yb1 and yb3 directions. In addition, 0.5fm(10fr2) amplitude increases in all directions.
As the crack depth increases, the changes in the amplitudes of meshing frequency and the multiplication frequency are not obvious. But sidebands of the multiplication frequency of fm are distinctly changed by the crack. In Figures 15(c), 15(e), 16(c), and 16(e), the amplitude of the sideband gradually increases with the increase in crack depth. For crack 30%, the frequency component becomes more complex than early crack (10%) and healthy system. 0.5fm(10fr2) and fm are the dominant frequencies in all directions.
The statistics data of the sidebands are shown in Tables 3 and 4. In Tables 3 and 4, the amplitudes of sideband sharply increase when the crack depth changes from 10% to 20%. From 20% to 30%, the variations will become a slow increase or decrease.
| Crack depth (%) | 8fm − 6fr2 (Hz) | Amplitude (×10−6 m) | 8fm − 3fr2 (Hz)(a) | Amplitude (×10−6 m) | 8fm + 3fr2 (Hz)(a) | Amplitude (×10−6 m) | 8fm + 6fr2 (Hz)a | Amplitude (×10−6 m) |
|---|---|---|---|---|---|---|---|---|
| 0 | 11550 | ≈0 | 11775 | ≈0 | 12225 | ≈0 | 12450 | ≈0 |
| 10 |
|
0.0913 |
|
0.1103 |
|
0.1489 |
|
0.1741 |
| 20 | 0.3017 | 0.3009 | 0.3866 | 0.4004 | ||||
| 30 | 0.3503 | 0.3309 | 0.2918 | 0.2270 |
- aThe first line is the frequency of sideband, respectively, and the other lines indicate the growth rate when every crack 10% increases.
| Crack depth (%) | 8fm − 6fr2 (Hz) | Amplitude (×10−8 m) | 8fm − 3fr2 (Hz)(a) | Amplitude (×10−8 m) | 8fm + 3fr2 (Hz)(a) | Amplitude (×10−8 m) | 8fm + 3fr2 (Hz)a | Amplitude (×10−8 m) |
|---|---|---|---|---|---|---|---|---|
| 0 | 11550 | ≈0 | 11775 | ≈0 | 12225 | ≈0 | 12450 | ≈0 |
| 10 |
|
0.0183 |
|
0.0238 |
|
0.0292 |
|
0.0358 |
| 20 | 0.0536 | 0.0553 | 0.0846 | 0.1048 | ||||
| 30 | 0.0720 | 0.0767 | 0.0922 | 0.0978 |
- aThe first line is the frequency of sideband, respectively, and the other lines indicate the growth rate when every crack 10% increases.
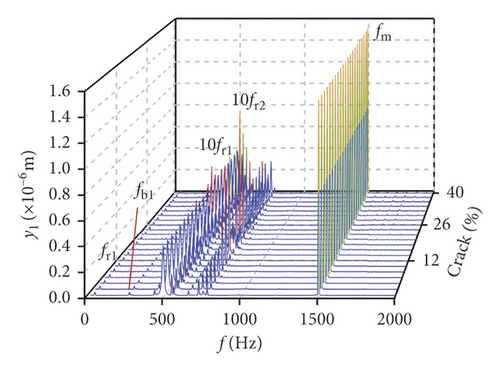
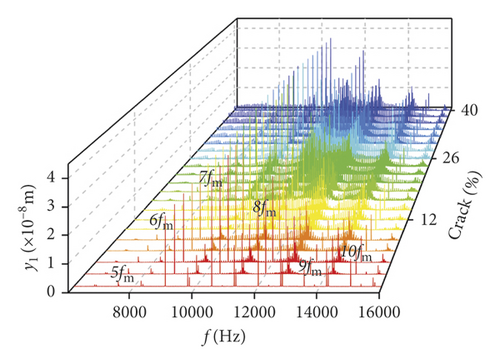
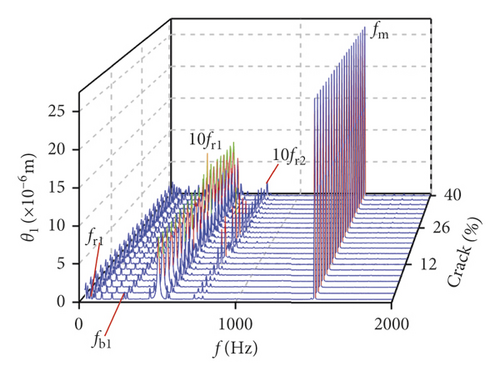
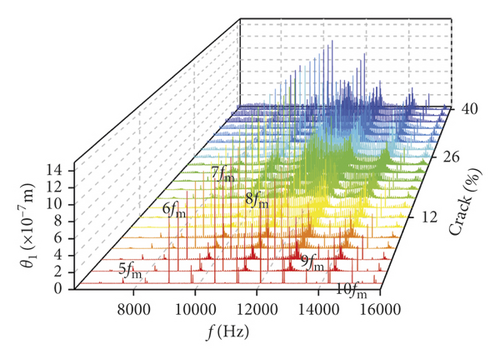
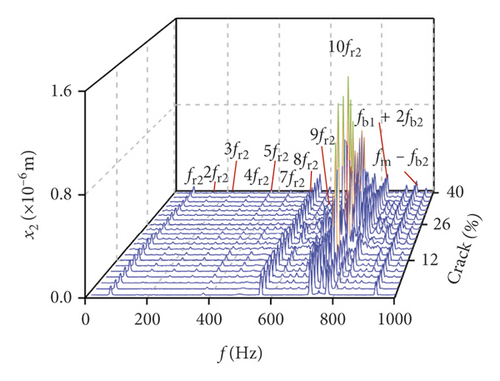
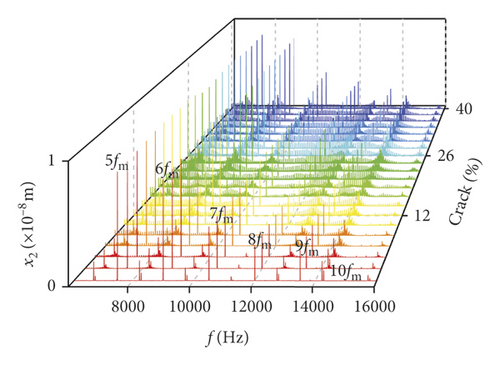
In order to further research the influences of a tooth root crack, waterfall maps of different crack depths in all directions can be seen in Figure 17. The amplitude of 0.5fm(10fr2) in y1 direction increases in the range of (0%, 22%) in Figure 17(a). When the crack depth is 22%, the amplitude of 0.5fm(10fr2) is the biggest. Then the amplitude decreases in the range of (24%, 40%). The amplitude of 10fr1 only appears a slight fluctuation near crack 22%. The amplitude of fm shows less variation. In Figure 17(b), the multiplication frequency of fm is shown, including 5fm, 6fm, …, 10fm. The sidebands appear near multiplication frequency. These sidebands are irregular, and the amplitude of sidebands is different. The change rules of 0.5fm(10fr2), fm, and 10fr1 in θ1 direction are similar to those in y1 direction, as is shown in Figure 17(c). In addition, some noise frequency occurs in the lower frequency. In x2 direction, fr2 and its multiplication frequency 2fr2, 3fr2, …, 10fr2 appear and some compound frequencies fb1 + fb2, fm − fb2 also exist in Figure 17(e). The multiplication frequency of fm in x2 direction is different from that in y1 and θ1 directions (compare Figure 17(f) with Figures 17(b) and 17(d)). The amplitude of sidebands increases with crack growing in all directions, as is shown in Figures 17(b), 17(d), and 17(f).
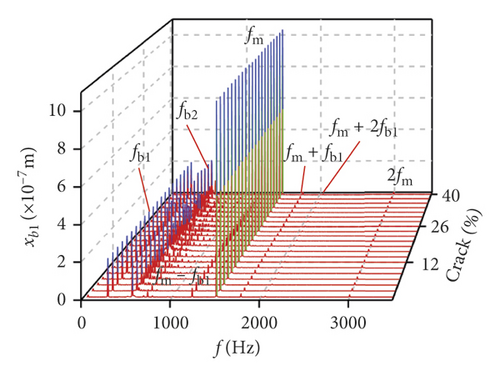
Influences of crack growing on the bearing is shown in Figures 18(a)–18(d). It can be seen that the frequency changes of transverse (xb1, xb3) vibrations are more violent than those of the longitudinal (yb1, yb3) vibrations. fb1, fb2, 0.5fm, and fm are found from the bearings in xb3 direction, and the amplitude of 0.5fm(10fr2) is changed as the crack depth increases, as is shown in Figure 18(a). The number of noise frequencies in the spectra of transverse vibration is more than that in the frequency spectra of longitudinal vibration.
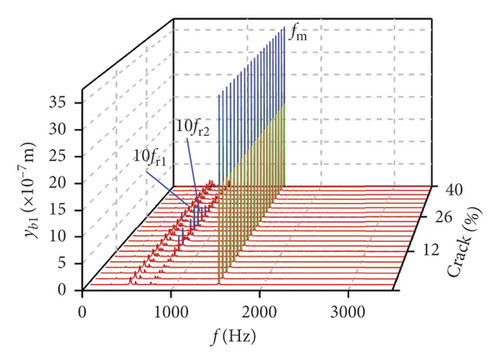
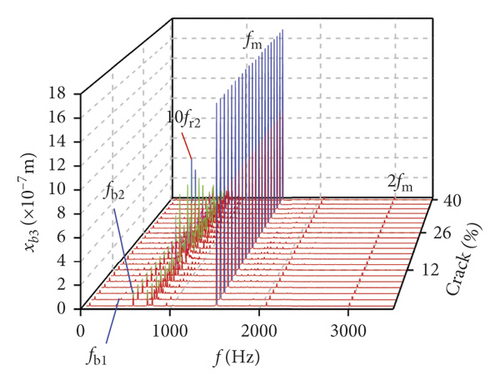
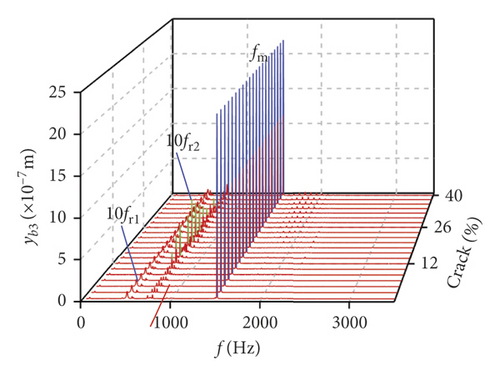
In Figures 18(b) and 18(d), the frequency components include 0.5fm(10fr2), 10fr1, and fm.
For the comprehensive comparison, the impact in the transverse vibration is more dramatic than that in the longitudinal vibration from the change of the crack, whether the bearings or the gears. Moreover, besides the sidebands, 0.5fm(10fr2) and the noise frequency, the amplitude variation of other frequency components is inconspicuous, as shown in Figure 18.
4. Conclusion
- (1)
The effect of crack growing on meshing force of the gear system is distinct at high rotational speed. With the increase in crack, different crack degrees show different vibration responses. In addition, for high speed, the meshing force slowly increases in the range of crack (0, 30%). But the meshing force rapidly increases within the limits of 30% and 40% when the rotational speeds are 600 r/min and 3000 r/min. The meshing force declines in the range of 30% and 40% when the speed is 1800 r/min. The comprehensive elastic deformation δ(t) and the variation of center distance Δaare mainly affected by rotational speed. In addition, δ(t) and Δa slowly increase with growing crack depth. Moreover, the dynamic backlash RMS exhibits peak at crack 22% when the speed is 3000 r/min. The backlash is a main reason causing the amplitude variation of 0.5fm(10fr1).
- (2)
The shaft frequency and multiplication frequency of the dominant frequency can be found in the frequency domain spectra when the gear system appears crack fault. And the amplitudes of these sidebands and the amplitudes of part multiplication frequency go up with the growing of the crack depth, yet the amplitude of frequency components is not changed. For this spur gear model, the pinion and shaft 2 show more obvious fault characteristics due to which sideband effect and time-domain waveforms are more complex as the crack increases.
Nomenclature
-
- Ax:
-
- Area of the tooth cross section at point x
-
- Axc:
-
- After appearing crack, area of the tooth cross section at point x
-
- b(t):
-
- Dynamic backlash
-
- Δb(t):
-
- Microscopic backlash
-
- bh(t):
-
- Vibration variation backlash
-
- cbij:
-
- i = x, y, and j = 1–4, bearing damping in x and y directions
-
- cm:
-
- Mesh damping
-
- csi:
-
- i = 1-2, bending damping
-
- cti:
-
- i = 1-2, torsion damping
-
- D:
-
- Fractal dimension controlling the complexity of the fractal curve
-
- E:
-
- Young’s modulus
-
- e(t):
-
- Static transmission error
-
- e0:
-
- Mean error
-
- er:
-
- Amplitude error
-
- Ff:
-
- Friction
-
- fi:
-
- i = 1–N, contact force of the ith rolling element
-
- Fmj:
-
- j = 1-2, dynamic force
-
- Fxj:
-
- Bearing force in x direction
-
- Fyj:
-
- Bearing force in y direction
-
- G:
-
- Shear modulus
-
- Gc:
-
- Characteristic scale coefficient
-
- H:
-
- Heaviside function
-
- hc:
-
- Distance between the root the crack and the central line of the tooth
-
- hx:
-
- Distance between the point on the tooth’s curve and the tooth’s central line
-
- Ix:
-
- Area moment of inertia of the tooth cross section at point x
-
- Ixc:
-
- After appearing crack, area moment of inertia of the tooth cross section at point x
-
- ka:
-
- Axial compression stiffness of gear
-
- kb:
-
- Bending stiffness of gear
-
- kh:
-
- Hertzian contact stiffness of gear
-
- ks:
-
- Shear stiffness of gear
-
- ksi:
-
- i = 1-2, bending stiffness of shafts
-
- kt:
-
- TVMS
-
- kti:
-
- i = 1-2, torsion stiffness of shafts
-
- L:
-
- Width of tooth
-
- Ls:
-
- Sampling width
-
- lbi:
-
- i = 1–4, distances between gear’s centers and centers of bearing
-
- lj:
-
- j = 1-2, length of shafts
-
- :
-
- Friction arm
-
- :
-
- Friction arm
-
- rb1:
-
- Basic circle of gear
-
- rb2:
-
- Basic circle of pinion
-
- Rq:
-
- RMS roughness
-
- Tf1:
-
- Friction torque
-
- Tf2:
-
- Friction torque
-
- Ua:
-
- Axial compression energy
-
- Ub:
-
- Bending energy
-
- Us:
-
- Shear energy
-
- vb:
-
- Velocity of cage
-
- vi:
-
- Contact point velocities between the rolling elements and inner ring
-
- vo:
-
- Contact point velocities between the rolling elements and outer ring
-
- vM1:
-
- Velocity on the meshing point of gear
-
- vM2:
-
- Velocity on the meshing point of pinion
-
- vs:
-
- Relative sliding velocity of the meshing point M of the tooth pairs
-
- xgi:
-
- Abscissa of centers of mass
-
- ygi:
-
- Ordinate of centers of mass
-
- φi:
-
- i = 1,2, d, g angle displacement
-
- :
-
- i = 1–N, rotational angle of the ith rolling ball
-
- δ(t):
-
- Deformation between two gears along meshing direction
-
- δxi:
-
- Elastic deformations of the shaft in x direction
-
- δyi:
-
- Elastic deformations of the shaft in y direction
-
- :
-
- Deformation of the ith rolling ball
-
- λ(vs):
-
- Direction coefficient
-
- ωb:
-
- Angular velocity of cage
-
- ωh:
-
- Upper cutoff frequency
-
- ωi:
-
- Angular velocity of the inner ring
-
- ωo:
-
- Angular velocity of the outer ring
-
- ωk:
-
- Lower cutoff frequency
-
- ωm:
-
- Meshing frequency
-
- ρi:
-
- i = 1-2, eccentricity
-
- ξm:
-
- Meshing damping ratio
-
- γn:
-
- Space frequency of flank profile
-
- μ:
-
- Friction coefficient.
Conflicts of Interest
No potential conflicts in this paper are declared by the authors about research, relationship, and publication.
Acknowledgments
This work was funded by the Natural Science Foundation of China (no. 51675350), and Key project of Natural Science Foundation of Science and Technology Department of Liaoning Province (20170540673).
Open Research
Data Availability
All the data are included within the manuscript, and all parameters are valid. Interested researchers can obtain the numerical solution files by contacting the authors via mail ([email protected]).


