Path Formation Time in the Noise-Limited Fractionated Spacecraft Network with FDMA
Abstract
Connectivity and path formation time are very important for the design and optimization in fractionated spacecraft network. Taking frequency division multiple access (FDMA) with subcarrier binary phase-shift keying (BPSK) modulation as an example, this paper focuses on the issues of constraint to orbital elements and path formation time for the noise-limited fractionated spacecraft network percolating. First, based on the proposed evolution of the dynamic topology graph in the fractionated spacecraft network, we prove the constraint condition of orbital elements for noise-limited fractionated spacecraft network percolating, and the definition of path formation time is provided and the mobility model is established. Next, we study the relationship between first docking time and spatial initial distribution and the relationship between first separating time and spatial initial distribution. These relationships provide an important basis for the orbit design in the fractionated spacecraft network. Finally, the numerical results show that the network topology for fractionated spacecraft is time-varying and dynamic. The path formation time and hop length scale linearly with path length within each orbital hyperperiod and change periodically. Besides, the time constant gradually tends to a stable value with path formation time increasing, that is, path length. These results powerfully support percolation theory further under the environment of the noise-limited fractionated spacecraft network.
1. Introduction
Since fractionated spacecraft network (FSN) has the advantages of fast response, strong robustness, flexibility, low cost, and long lifetime, this innovative structure has been considered as the next generation of distributed space system [1, 2]. FSN is a kind of ad hoc network which needs to accomplish cluster flight on orbit, and it is composed of multiple module nodes which can be homogeneous or heterogeneous. The module nodes are required to maintain bounded relative distances between tens of kilometers and hundreds of kilometers and to keep loose geometry for the entire mission lifetime. This leads to greater dynamic and random characteristics between node connectivity [3–5]. However, FSN needs a higher demand for signal dissemination between the nodes: even if the whole nodes cannot be completely connected in each time, FSN can realize the information distribution in the full network finally. Therefore, the study on message dissemination delay, that is, the research on the characteristic of path formation time, is quite significant. Undoubtedly, it is also worthwhile to research the design and performance optimization of FSN.
Recently, percolation theory has been used to study connectivity and message dissemination delay in static multihop wireless networks [6–10]. Percolation theory studies the existence of phase transitions in random graphs. For instance, by constructing a weighted graph model and adopting first passage percolation, the first-arrival path and time delay in weighted graph is met in [11], but their model did not consider multiple access interference. Node connection depends not only on Euclidean distance between nodes but also on the location of other nodes in interference environment [12]. For the dynamic network topology caused by Medium Access Control (MAC) planning and load change in [13], the authors research the dynamic connection between nodes within Additive Links Online Hawaii Area (ALOHA) access control, and they derive the distributional properties of message dissemination delay.
In static wireless networks, in order to guarantee that any node in the network can receive the message from the source node, it is required that the network is fully connected. In mobile wireless networks, however, the situation is quite different from that for static networks. In a moving environment, connectivity should not be assessed at a fixed time instant. Rather, two nodes can exchange a message and thus share a link. Because different nodes can share a link at different times, the connection is time-dependent. Ignoring the propagation delay, all the nodes on the connected branch of the source node will receive the signal from the source node. However, as time goes on and nodes move, the nodes carrying a message will transmit the signal to the new nodes whenever the transmitted nodes share a link with the new nodes. Of course, it will naturally be put forward such a problem, namely, how long it takes for all nodes to receive the message. This is the so-called path formation time or node connection time [14, 15].
For this problem, percolation theory is a natural tool, where percolation refers to the formation of the infinite component in a graph [16–18]. Also, first passage percolation is used to describe the paths reachable in a graph [19–21]. Many scholars have studied path formation time using first passage percolation. For instance, taking information distribution time or path formation time as first passage percolation is simulated in [22, 23]. Path formation time is also studied by using the subadditive ergodic theorems in [24, 25]. But few references are available in path formation time for FSN with a loose geometric structure.
In this paper, we focus on some important issues of node connection and path formation time in FSN. Firstly, the system model is established. We mainly discuss the evolving graph of network topology associated with FSN, the path formation time, the node mobility model, and constraint to complete percolating in the noise-limited network in Section 2. Secondly, using the principles of orbital dynamics, we analyze the orbital element constraints to percolation in noise-limited FSN and the condition of ensuring cluster flight of fractionated spacecraft and FSN percolating in Section 3. Then using first passage percolation in Section 4, we study the relationship between nodes first docking time and spatial initial distribution and the relationship between first separating time and spatial initial distribution in FSN. Section 5 presents simulation results. Finally, Section 6 concludes the paper.
2. System Models
2.1. Earth-Centered Inertial Coordinate System
If the vector r = [x, y, z]T denotes the position of any satellites in FSN in the ECI coordinate, v = dr/dt is the velocity, and is equatorial projection of the position vector, as well as the maximal and minimal equatorial projections of the position vector of satellite at time t, given by and .
2.2. The Evolution of the Dynamic Topology Graph in FSN
Based on (2), it is denoted that the construction of network topology depends entirely on the path loss factor l(ri − rj), if P, N0, and Γ are known.
Therefore, let V be the set of nodes of FSN, Vt(k) denote the set of transmitting nodes at time k, and Vr(k) denote the receiving set of nodes, as well as Vt(k) ∪ Vr(k) = V. If the threshold Γ is less than SINR between transmitting node si ∈ Vt(k) and receiving node sj ∈ Vr(k), there is a bidirectional connection path to form an edge set denoted by Ek. So it is seen that SINR directly affects the construction of network topology.
Hence, the dynamic topology graph can be defined as the following.
Definition 1. Let si ∈ Vt(k) and sj ∈ Vr(k) at time k. If the edge set between nodes is denoted by Ek, the dynamic topology graph is g(k) = G(V, Ek).
Based on orbit dynamics theory, the orbital hyperperiod can be divided into T0, T1, T2, …, TT times for fractionated spacecraft [27, 28]. So there are T time slots in an orbital period. If the edge set is denoted by in time slot σk = [Tk−1, Tk)(k = 1, 2, …, T), the topology graph denoted by can be supposed to remain static in the time slot. The orbital hyperperiod is H = (TT − T0) [27]. Then one defines the evolving graph of the dynamic topology graph for FSN as follows.
Definition 2. If the orbital hyperperiod can be divided into T0, T1, T2, …, TT times for fractionated spacecraft, there are T time slots. Then the evolving graph of dynamic topology for FSN in the orbital hyperperiod is defined as
Certainly, the evolving graph of dynamic topology in time slot l can be denoted by G(1, l) according to Definition 2.
2.3. Constraint to Complete Percolating in Noise-Limited FSN
Equation (6) indicates that the topology of the noise-limited FSN completely depends on spatial distribution of nodes.
For any time k, if , that is, SIR ≥ Γ, the node i can connect with the node j.
Furthermore, due to the high-speed mobility of FSN, even if (9) is not satisfied at some time, that is, node i cannot connect with node j, node i will send the signal to node j next one or few time slots successfully by using store and forward function of fractionated spacecraft. The time slots are just node connection time, that is, path formation time.
2.4. Node Mobility Model
It is needed to construct a mobility model of nodes, because of high-speed mobility of FSN.
For convenience, we use a twin-satellites model to study the mobility model of nodes. Because fractionated spacecraft are required to maintain bounded relative distance for the entire mission lifetime, the node positions can be viewed as a uniform distribution within a sphere with (M − m)/4 radius in Figure 1.
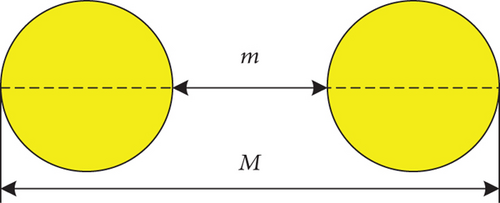
So the mobility model Model(t) of nodes for FSN can be defined as the following.
Definition 3. In ECI coordinates, if the position set of n nodes of FSN is R(0) = {r1(0), r2(0), …, rn(0)} at initial time T0, the position set is R(k) = {r1(k), r2(k), …, rn(k)}, and the positions are uniformly distributed within sphere B(ri(0), a)(i = 1, 2, …, n) at time k, where ri(0) and a = (M − m)/4 are the center and radius of the sphere, respectively. Moreover, positions among all nodes are mutually independent and independent of all previous locations.
In addition, in order to study dynamic connectivity, it is necessary to define the two important concepts about time.
Definition 4. In ECI coordinates, given R(0) at initial time T0 and M(t) of FSN, the first docking time of two nodes i and j can be defined as follows:
Conversely, Definition 5 is given as the following.
Definition 5. In ECI coordinates, given R(0) at initial time T0 and M(t) of FSN, the first separating time of two nodes i and j can be defined as follows:
Obviously, if , Tdocking(i, j) = 0 and Tseparating(i, j) > 0; if , Tdocking(i, j) > 0 and Tseparating(i, j) = 0.
So, one can also define the concepts about the FSN graph using the two definitions above.
Definition 6. Given R(0) at initial time T0 and M(t) of FSN, if and only if , there exists an instant connectivity graph Gs and a path between node i and node j, and if and only if E[Tdocking(i, j)] < ∞, there exists a long-time connection graph G(1, t) and a path between the two nodes.
3. Noise-Limited FSN Percolating
Without controlling, two initially close modules—a chief and a deputy—rapidly separate due to differential accelerations. It is thus necessary to identify orbits on which the modules remain within some prespecified relative distance for the entire mission lifetime [2, 5].
For obtaining the initial constraint to fractionated spacecraft with respect to keeping bounded relative distance, the lemma is given as follows [2, 5].
Lemma 1 (see [2].)Consider two modules, the chief module C and the deputy module D, having identical constant ballistic coefficients, that is,
Then, the distance between the satellites C and D is required to be satisfied as follows:
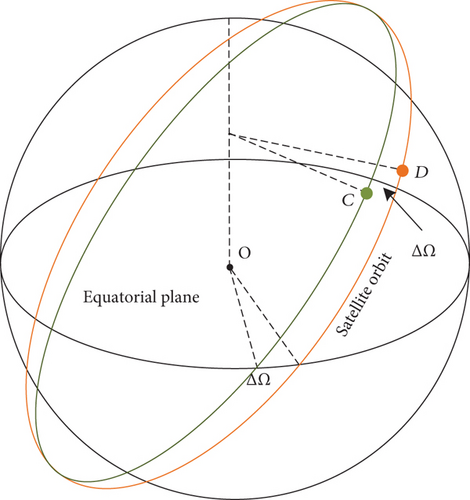
According to Lemma 1, the following theorem can be proved.
Theorem 1. The chief module C and the deputy module D of FSN have identical constant ballistic coefficients. If the SIR between the two modules is satisfied (7), ∣Δt∣ and ∣ΔΩ∣ are satisfied as
Proof 1. By Lemma 1, if modules are required to remain bounded relative distance, the following conditions must be met:
Using (19) and (20), it can be obtained the feasible region with respect to sin(|ΔΩ|/2) and ∣Δt∣. And the feasible region includes two cases as follow.
Case 1. When M/ηmax ≥ m/ηmin, the feasible region is shown in Figure 3.
Case 2. When M/ηmax < m/ηmin, the feasible region is shown in Figure 4.
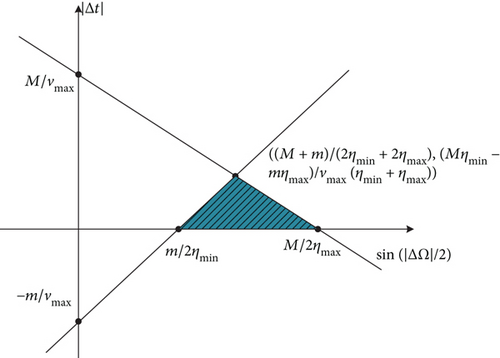
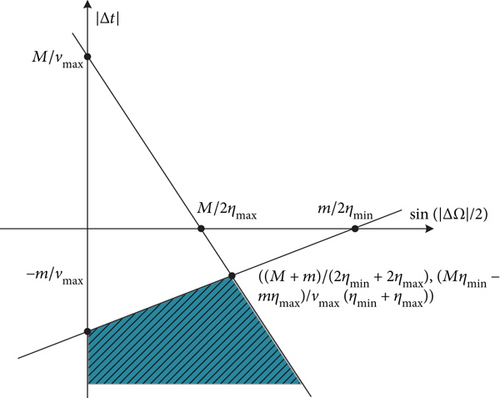
So, if the SIR between the two modules satisfies (9), ∣Δt∣ and ∣ΔΩ∣ satisfy (17) or (18), respectively, the noise-limited FSN percolates. q.e.d.
4. First Docking Time, First Separating Time, and Initial Spatial Distribution
In aerospace engineering, the spacecraft performance is directly affected by the initial orbital elements, which determine the initial spatial distribution and affect the connectivity of FSN. Therefore, it is very important to study the relationship of the first docking time and the first separating time with the initial spatial distribution.
First, the following theorem is given.
Theorem 2. For any two nodes i and j in FSN, the initial position ri(0) and rj(0) and mobility model M(t) are given. If and only if , one has 0 < E[Tdocking(i, j)] < ∞.
Proof 2. For convenience, one gives a proof in 2-dimension because of the symmetry of a sphere. So, the circular area at r with radius a is denoted by A(r, a).
Remark 1. Nodes i and j are located in A(ri(0), (M − m)/4) and A(rj(0), (M − m)/4), respectively, in Figure 1. And if , then for all time k. According to (6), Tdocking(i, j) = ∞ and E[Tdocking(i, j)] = ∞.
Now, suppose , three cases are considered.
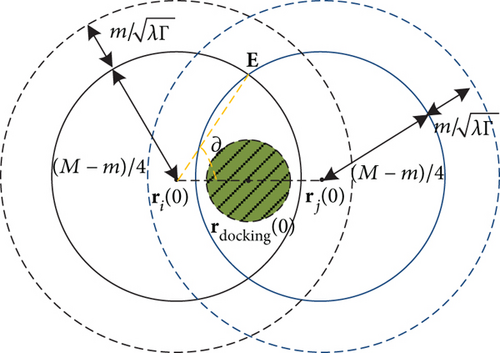
Case 1. Let rdocking(0) denote the midpoint between ri(0) and rj(0) and draw a circle centered at rdocking(0) with radius . If the circle is completely contained in the overlapping area of A(ri(0), (M − m)/4) and A(rj(0), (M − m)/4) as shown in Figure 5, then we have . Obviously, the nodes i and j can appear in.
When nodes i and j simultaneously appear in , the two nodes are able to communicate with each other directly. Hence, one has E[Tdocking(i, j)] ≤ E[T1(i, j)], where T1(i, j) is the first time that the two nodes appear in the circle and T1(i, j) follows geometric distribution with parameter p1. Parameter p1 can be calculated as follows:
where ‖⋅‖ is two-dimensional Lebesgue measure, that is, the area, ∂ = arccos(2|ri(0) − rj(0)|/(M − m)) is the angle between the straight line which pass through points ri(0) and E and another straight line which pass through points ri(0) and rj(0) at point ri(0), and E is the upper intersection point of the cycles ri(0) and rj(0) in Figure 5.
So, one has
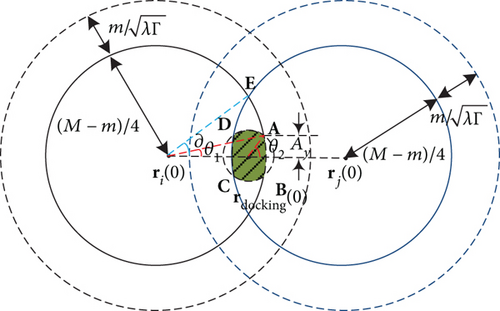
Case 2. Similar to Case 1, if the circle of radius is incompletely contained in the overlapping area of the circles (ri(0), (M − m)/4) and (rj(0), (M − m)/4), then , as shown in Figure 6.
When nodes i and j simultaneously appear in the shaded area ABCD, the two nodes are able to communicate with each other directly. Hence, we have E[Tdocking(i, j)] ≤ E[T2(i, j)], where T2(i, j) is the first time that the two nodes appear in the shaded area ABCD and E[T2(i, j)] can be given as follows:
where θ1 = arcsin(4Ay/(M − m)), , and in Figure 6.
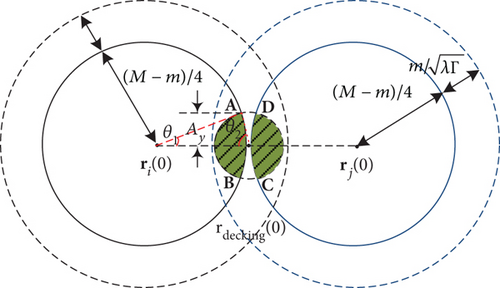
Case 3. Applying the same method as Case 2, T3(i, j) is the first time that the two nodes simultaneously appear in the two shaded areas in Figure 7.
When , E[T3(i, j)] can be given as follows:
In summary, when , there exists 0 < E[Tdocking(i, j)] < ∞. q.e.d.
Similar to Theorem 2, we can prove Theorem 3 as follows.
Theorem 3. In ECI coordinates, the initial position ri(0) and rj(0) and mobility model M(t) are given. If and only if for any nodes in M(t), 0 < E[Tseparating(i, j)] < ∞.
5. Numerical Results and Analysis
5.1. Orbital Elements
Using STK (Satellite Tool Kit), we have Vmax = 8.061 km/s, ηmax = 8231.725 km, and ηmin = 5523.656 km.
Using (16), when 0.010° ≤ |ΔΩ| ≤ 0.421°, we have |Δt| ≤ 1370.46sin(|ΔΩ|/2) − 0.124. In accordance with (17), when 0.421° ≤ |ΔΩ| ≤ 0.696°, we have Δt∣ ≤ 12.405 − 2042.358sin(|ΔΩ|/2).
Hence, if ΔΩ of B, C, D, and E are chosen as −0.023°, 0.057°, 0.086°, and 0.126°, respectively, all near circular orbital elements are listed in Table 1.
| Parameter | B | C | D | E |
|---|---|---|---|---|
| ΔΩ (deg) | −0.023 | 0.057 | 0.086 | 0.126 |
| Δt | 0.1 | −0.2 | −0.5 | 1.2 |
| a(t0) (km) | 7499.9996 | 7500.001 | 7500.0015 | 7500.0022 |
| e(t0) | 0.09960 | 0.10100 | 0.10150 | 0.10219 |
| β(t0) (deg) | 34.9771 | 35.0573 | 35.0860 | 35.1260 |
| ω(t0) (deg) | 359.9771 | 0.05725 | 0.08581 | 0.12635 |
| f(t0) (deg) | 359.9827 | 0.04591 | 0.05747 | 0.19439 |
| Ω(t0) (deg) | 359.9771 | 0.0573 | 0.0860 | 0.1260 |
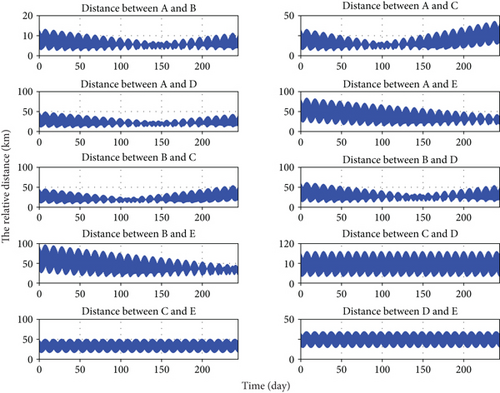
According to Table 1, all orbital periods can be calculated and are approximated as 6464 seconds using STK; so we believe the orbital hyperperiods of the FSN are also 6464 s. In addition, we can also calculate all relative distances shown in Figure 8 in 244 days by STK. It is observed that the relative distance between any two modules always remains below 100 km and above 1 km. It is shown that the orbital elements are effective, because of satisfying the condition of bounded relative distance, and this outcome verifies Theorem 1 reasonable.
5.2. Construction of the Adjacency Matrix
The topology in wireless networks can change dynamically depending on the link connectivity between each node pair. The network topology is modeled by the adjacency matrix [29–31].
Let Tf = 1/2000 s, |fw − fj| = 2.5/Tf(|w − j| = 1), and σk = 60s(k = 1, 2, …, 108). The orbital hyperperiod of the FSN is divided into 108 time slots, and each time slot is 60 s. So, we can construct the adjacency matrix of the FSN using STK and MATLAB, and other parameters used are listed in Table 2.
| Parameter | Value | Parameter | Value |
|---|---|---|---|
| Γ | 12 dB | f1 | 5 kHz |
| P | 0.15 W | f2 | 10 kHz |
| Q | 3 | f3 | 15 kHz |
| Smin | 1/(5π)2 | f4 | 20 kHz |
| — | — | f5 | 25 kHz |
Constructing the adjacency matrix within 26 orbital hyperperiods, we can also observe that the adjacency matrix of the FSN is a sparse matrix in which most of the elements are zero in most time slots of orbit hyperperiod.
5.3. Path Formation Time and the Path Length
In order to investigate the relationship between the path formation time and path length, we use shortest path algorithms to find shortest path length and calculate path formation time from the source node to the destination node in STK and MATLAB.
Under the same simulation environment as described in Section 5.2, we calculate the path formation time and path length within 26 orbital hyperperiods using STK and MATLAB. In addition, we consider three types of path formation from the source node to the destination node, that is, E is the destination node, while A, B, and C are source nodes, respectively. First, we construct the adjacency matrices of the FSN within 26 orbital hyperperiods using previous results. Second, we use Dijkstra’s algorithm [32, 33] to find the shortest path. Dijkstra’s algorithm is an algorithm for finding the shortest paths between nodes in a graph. Using the algorithm, if the last visited node is not a destination node in some time slot, then this node is viewed as a source node to find the shortest path again. Until the last visited node is a destination node, this algorithm is over. In this process, the number of time slots to find the shortest paths is just the path formation time. Also, we can calculate the minimum number of hops, that is, hop length between two nodes, using the algorithm.
Based on above analysis, we give the simulation results shown in Figures 9–12. Figures 9, 10, and 11 are the simulation results of the 1st hyperperiod, the 5th hyperperiod, and the 12th hyperperiod, respectively. And Figure 12 is the simulation results of the 25th hyperperiod.
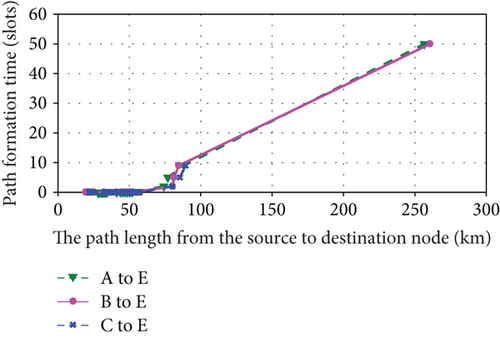
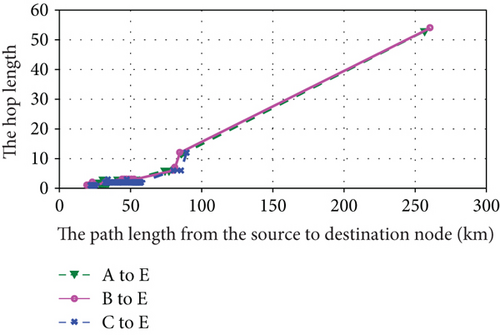
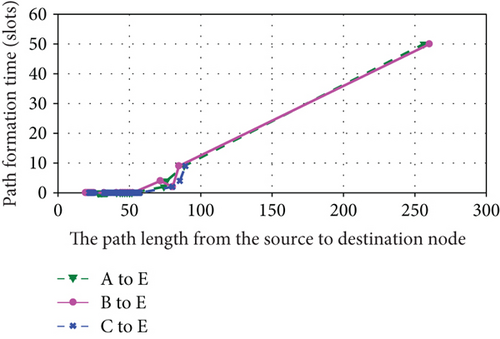
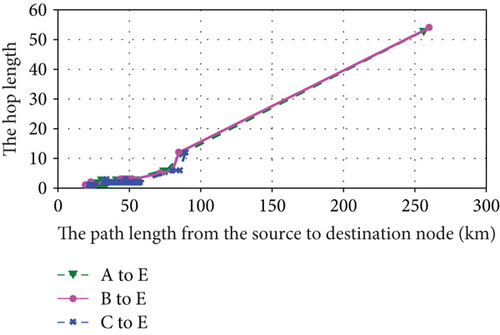
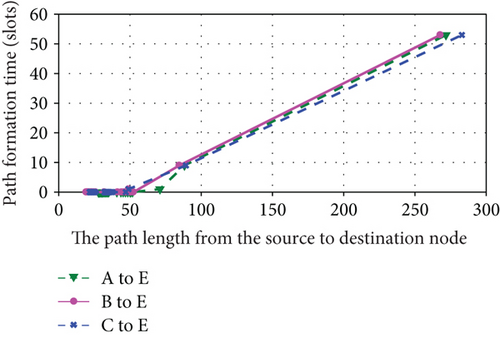
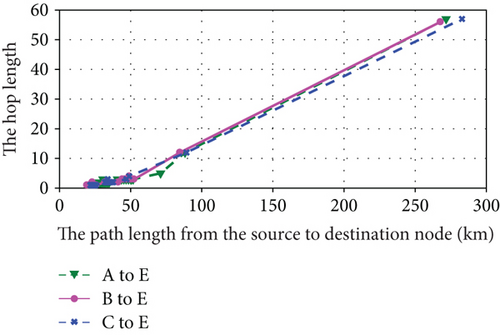
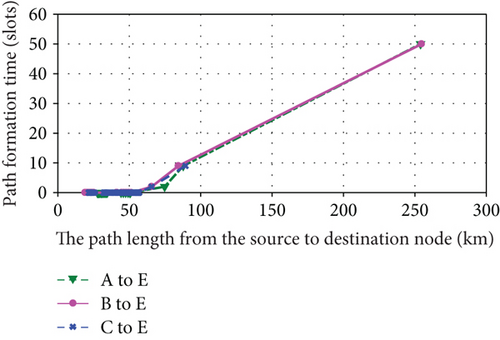
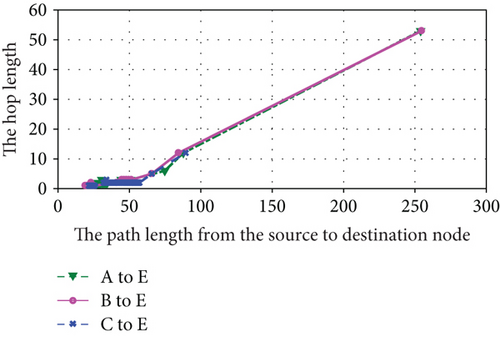
It is observed that the path formation time and hop length nearly scale linearly with path length within each orbital hyperperiod shown in Figures 9, 10, 11, and 12. Moreover, although a part of relationships within 26 orbital periods are shown, the path formation time and hop length change periodically. Maybe due to the influence of orbital perturbation, there exists a slight difference in each orbital hyperperiod.
It is also observed that the formation times and hop lengths of three paths exist slight difference. Its reasons are the adjacency matrix is a sparse matrix and there exists a few edges in most slots of hyperperiod. When Dijkstra’s algorithm is used to find the shortest path, a part of shortest paths are same in the three paths.
5.4. Connection Time Constant between Two Module Nodes
The connection time constant depends on the ratio between path formation time and path length. Just as the results in Section 5.3, path formation time nearly scales linearly with path length. For convenience, we analyze the relationships between connection time constant and path formation time. Under the same simulation environment as described in Section 5.2, Figure 13 shows the relationships between connection time constant and path formation time of three paths, that is, A to E, B to E, and C to E, within 26 orbital hyperperiods.
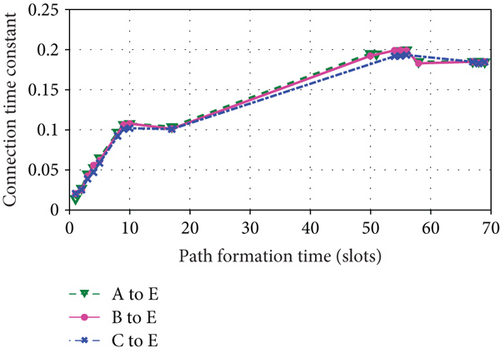
In Figure 13, when path formation time is smaller than 50 slots, connection time constant increases with path formation time. When path formation time is larger than 50 slots, the increasing trend of time constant is gradually slow. Finally, the trend is nearly constant. Obviously, the time constant gradually tends to a stable value with path formation time increasing, although the path formation time and hop length change periodically. This result strongly supports percolation theory further.
6. Conclusion
- (i)
Due to the mobility, network topology is time-varying for fractionated spacecraft, and the connection is dynamic. Satisfying the constraints presented in this paper, the cluster flight and FSN percolating can be maintained in long-term bounded relative distances.
- (ii)
The initial spatial distribution, that is, the initial orbital elements, directly affects the first docking time and the first separating time.
- (iii)
The path formation time and hop length nearly scale linearly with path length within each orbital hyperperiod, and this relationship changes periodically.
- (iv)
The time constant increases with path formation time. When path formation time is larger, time constant gradually tends to a stable value, despite of the path formation time and hop length changing periodically.
Conflicts of Interest
The authors declare that there is no conflict of interest regarding the publication of this paper.
Acknowledgments
The authors wish to thank the reviewers for their valuable comments, corrections, and suggestions, which led to an improved version of the original paper. The authors thank Professor Yang Zhen from National Space Science Center, CAS, China. This research is a project partially supported by the National Natural Science Foundation of China (Grant no. 61561009).
Open Research
Data Availability
The data generated or analyzed during this study are included within the article, but the programs analyzed during the current study are not publicly available as they are part of the simulation programs in use.


