Fuzzy State Machine Energy Management Strategy for Hybrid Electric UAVs with PV/Fuel Cell/Battery Power System
Abstract
Energy management strategies are the key technology for hybrid electric UAVs. This paper proposes a fuzzy state machine (FSM) energy management strategy with an online potential to control the power flow for the hybrid electric UAV which includes the photovoltaic, fuel cell, and battery power sources. The FSM strategy couples the fuzzy logical strategy with a state machine strategy where the fuzzy logical strategy controls the power split between a fuel cell and a battery and the state machine deals with the power flow of photovoltaics and battery. To evaluate the FSM strategy, a simulation platform integrating the hybrid power system model and UAV model is developed with a Matlab/Simulink tool. An existed online thermostat control strategy for the same type of UAV is employed to compare with the proposed strategy based on the developed platform. The energy management process and the state of each power source are analyzed under a given mission scenario. The comparison of the two strategies about the power and energy contribution rates of each power source, the battery state of charge, and the hydrogen consumption is presented. The results indicate that the FSM strategy can satisfy the demand power effectively during the mission and performs better than the thermostat control strategy on power distribution and fuel consumption.
1. Introduction
The hybrid electric UAVs in this paper are defined as the full electric UAVs powered by three or more kinds of power sources. In recent years, photovoltaic (PV) panels, fuel cells, and batteries are usually used as the electric propulsion energy. Heavily influenced by the climate, photovoltaic panels generally need to coordinate with batteries to power the UAVs which are called solar-powered UAVs. The relatively low energy density of batteries results in the extreme design of the solar-powered UAVs for a lighter structure weight. Fuel cells with higher energy density compared to batteries are potential for longer endurance. Due to soft electric characteristics and relatively slow response, the fuel cells are usually hybrid with batteries in the fuel cell-powered UAVs. Based on the principle of complementary advantages, the hybrid electric power system consisting with the photovoltaic, fuel cell, and battery power sources for UAVs has been proposed. Different dynamic characteristics of the three kinds of power sources make the hybrid power system more complicated. Thereby, a reasonable and efficient energy management is very important and necessary.
Energy management strategies (EMS) determine the power allocation among different power sources and promote the energy efficiency and service life of the hybrid power system. In general, the energy management strategies can be classified into two categories [1]: optimization-based strategies and rule-based strategies. Optimization-based strategies include, dynamic programming (DP) [2–7], Pontryagin’s minimum principle (PMP) [8–10], genetic algorithm (GA) [11], and particle swarm optimization (PSO) [12]. Such optimal strategies usually can get the local or global optimal fuel economy. However, they cannot be used for online management because of the high computational cost. For real-time optimization, some instantaneous optimization strategies are proposed by introducing a cost function that depends only on the present state of the system parameters. Then the concept of energy consumption minimization strategy (ECMS) [13–16] and model predictive control (MPC) [17] is introduced for online optimal energy management of the hybrid electric vehicles. But for hybrid electric UAVs, they are still on research.
Most online strategies for hybrid electric vehicles and UAVs are based on the rule-based strategies, mainly containing the fuzzy logical control (FCL) [18–24] and the state machine (SM) [25–29]. These strategies are easily implemented online to manage the power flow in the hybrid power system, because they can handle complex “black box” problems with low computational cost. Only a few of researchers tried to use the modified dynamic programming called the iterative dynamic programming (IDP) [30, 31] on the hybrid electric UAVs with an internal combustion engine and a motor as the hybrid propulsion system.
For the full electric UAVs with different types of power sources, most researchers only considered two types of power sources, such as a fuel cell and a battery (FC + B) [32–37] or photovoltaics and a battery (PV + B) [38–44]. Very few of researchers concentrated on the hybrid PV/fuel cell/battery (PV + FC + B) [25, 29, 45, 46] power system as they are more complicated. So the rule-based strategies were mostly used as they are more suitable and easier to be implemented online. Li et al. [25, 47] and Lee et al. [28, 46] built a hybrid photovoltaic/fuel cell/battery power system for UAVs to estimate the behaviors of each power source using state machine strategy. However, their studies only developed the hybrid power system model with a given demand power profile and paid little attention to UAV models. The influence of the flight dynamic on the hybrid power system and energy management was not directly presented and analyzed. Zhang et al. [29] used the simple linear kinematic and dynamic UAV model to investigate the rule-based power tracking strategy for the PV + FC + B hybrid electric UAVs. But the UAV model was constrained in a vertical plane. Neither turns nor banks were considered. The EMS used in the three studies were all rule-based strategies with simple rules and limited applicability. To investigate more advanced online energy management strategies for PV + FC + B, a platform that can simulate the real flight of full electric UAVs is needed and necessary.
In this study, a fuzzy state machine strategy combing the fuzzy logical control with the state machine strategy is proposed for PV + FC + B hybrid electric UAVs. To evaluate the FSM strategy, a closed loop simulation platform integrating the hybrid power system model and UAV model is developed to simulate the real flight conditions. The developed platform is also verified by comparing with the gasoline Aerosonde UAV model under a classical mission scenario. Based on such platform, the FSM strategy is compared with an existing online thermostat control strategy which has been implemented online for the same type of UAV. The comparison of the two strategies about the battery state of charge, the hydrogen consumption, and the power and energy contribution rates of each power source are discussed and analyzed.
The rest of the paper is organized as follows: the fuzzy state machine strategy for hybrid electric UAVs is described in Section 2, including the hybrid electric UAV framework and the details of the fuzzy state machine strategy. Section 3 provides the development and integration of the simulation platform containing the hybrid power system and the UAV model. Section 4 presents the simulation results and associated discussion including the comparison of the strategies. Finally, the conclusions are made in Section 5.
2. Fuzzy State Machine Strategy for Hybrid Electric UAVs
2.1. Sizing of Hybrid Electric UAV
The hybrid electric UAV is constructed by modifying the Aerosonde UAV [37] with the hybrid power system developed above to replace the GA propulsion system with an internal combustion (IC) engine. The Aerosonde UAV was developed by Aerosonde Pty Ltd. in Australia. To be comparable, the gross weight and aerodynamic configuration of the hybrid electric UAV remain the same with that of the IC engine Aerosonde UAV. The configuration sizes and weight breakdowns of the Aerosonde UAV and hybrid electric UAV are presented in Table 1.
| Aerosonde UAV | Hybrid electric UAV | |||
|---|---|---|---|---|
| Configuration size | Length (m) | 1.74 | Length (m) | 1.74 |
| Wingspan (m) | 2.87 | Wingspan (m) | 2.87 | |
| Wing area (m2) | 0.55 | Wing area (m2) | 0.55 | |
| Weight distribution (kg) | Airframe | 3.6 | Airframe | 3.6 |
| Avionics/payload | 2.1 | Avionics/payload | 2.1 | |
| Fuel and fuel tank | 5.6 | H2 and tank | 0.9 | |
| Power plant | 2.2 | BLDC motor | 0.4 | |
| Electric speed controller | 0.04 | |||
| Propeller | 0.06 | |||
| Fuel cell | 3 | |||
| Li battery | 0.9 | |||
| PV panel | 1 | |||
| DCDC converter | 1.2 | |||
| MPPT | 0.1 | |||
| Flight controller | 0.2 | |||
| Gross weight | 13.5 | Gross weight | 13.5 | |
As shown in Table 1, the wing area is only 0.55 m2 which limits the photovoltaic panel available on board. That also means the photovoltaic panel will not be the main power source. To match the weight, the sizing of the fuel cell and that of the battery are both limited. The cruise power of the Aerosonde UAV determines the fuel cell size. The peak power demand and the climb phase give a reference for the sizing of the battery.
2.2. Hybrid Electric UAV Framework
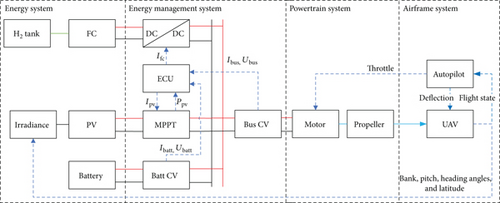
The framework of the hybrid electric UAV contains four parts: energy system, energy management system, powertrain system, and airframe system as illustrated in Figure 1. The energy system, energy management system, and powertrain system constitute the hybrid power system for the UAV. The energy system, including a hydrogen tank, a fuel cell (FC), a battery, photovoltaic panels (PV), and solar irradiance, provides electric energy for the powertrain system through the energy management system. The energy control unit (ECU) as the core processor of energy management system generates the current command for the DCDC converter and the maximum power point tracker (MPPT) based on the system state and power demand information from the current and voltage sensors, such as Batt CV and Bus CV. The DCDC and MPPT are the actuators to control the output power of FC and PV, respectively, and their output voltages are matched with the battery. The solar irradiance on the PV panel surface is influenced by the UAV flight state, such as bank, pitch, heading angles, and the latitude. The powertrain system includes a motor and a propeller to convert the electrical energy to mechanical energy and provides thrust and torque to the airframe system. The motor is controlled by the autopilot to generate the online demand power for the energy management system. The autopilot gets the flight state information from the UAV model and provides deflection angles for the control surfaces of the UAV. This framework can simulate the online situation at every flight moment with the causal relationship between demand power and energy management.
2.3. Purposes of Energy Management Strategy
- (i)
The PV panel has the top priority to discharge. Through the MPPT, the PV panel always works at the maximum power point to provide energy as much as possible for flying or charging the battery.
- (ii)
The battery, cooperating with the PV panel and fuel cell, makes up for surplus demand power. It is also responsible for sharp fluctuations of the power demand and peak power demand. The battery can be charged by the PV panel and fuel cell with a limited charge rate.
- (iii)
The fuel cell generally has the lowest output priority to save the fuel for longer endurance.
- (iv)
The DC bus demand power is always satisfied by the three kinds of power sources:
(1)where PD is the DC power demand and Ppv, Pbatt, and Pfc are the power extracted from the PV panel, battery, and fuel cell, respectively.
2.4. Implementation of Fuzzy State Machine
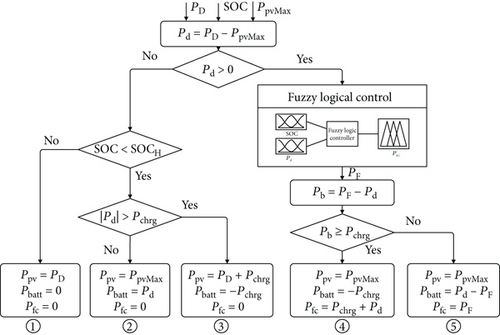
- State 1:
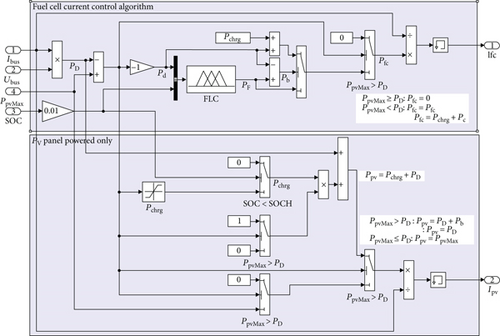
the maximum available power of the PV panel (PpvMax) is higher than the demand power (PD). That means the surplus demand power (Pd) is negative. The battery with a high state of charge does not need to be charged. The PV panel alone is selected to satisfy the power demand.
- State 2:
the PV has the ability to satisfy the demand power. The redundant power from the PV panel for charging the battery is lower than the maximum charge power (Pchrg). Then the PV panel outputs its maximum power to meet the demand power and charge the battery.
- State 3:
the maximum power from the PV panel is higher than the summation of demand power (PD) and maximum charge power (Pchrg). Then the output power of the PV panel equates to the power summation.
- State 4:
the PV panel cannot satisfy the power demand alone. To save the fuel, the PV panel gives its maximum power. Then the fuzzy logical control algorithm is used to decide the desired output of fuel cell PF. Considering the constraints of the battery’s maximum charge rate, the fuel cell power is modified to be the summation of surplus demand power (Pd) and maximum charge power (Pchrg).
- State 5:
the PV panel operates with maximum available power. And the desired fuel cell power PF is under the constraint of (3); then the fuel cell will output the desired power.
(3)
From state 1 to state 3, the EMS only uses the state machine strategy to deal with the output power of the PV panel and battery. The last two states couple with the fuzzy logical control strategy to control the output power of the fuel cell and battery. The PV power and fuel cell power are directly decided using the FSM strategy, but the battery power is derived automatically based on the power balance principle.
2.5. Fuzzy Logic Control
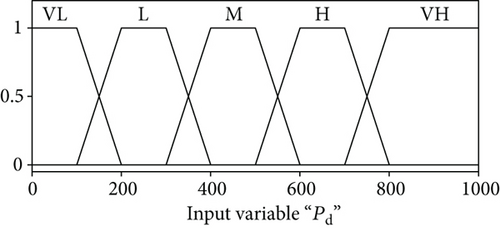
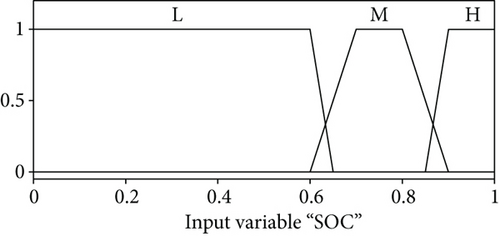
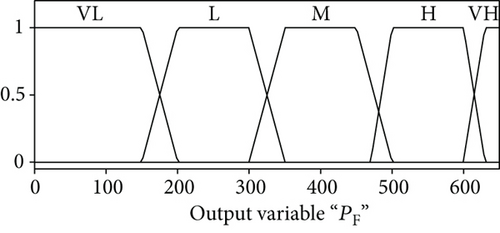
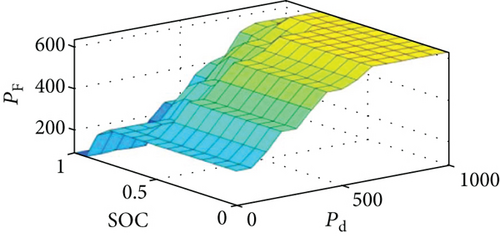
The fuzzy logical control has two input variables and one output variable, where the surplus demand power Pd and the state of charge SOC are the input variables and the desired fuel cell power is the output variable. The battery SOC is categorized into three different statuses called low (L), middle (M), and high (H). Similarly, the Pd is assigned into five regions: very high (VH), high (H), middle (M), low (L), and very low (VL). The fuzzy output PF is also defined in five statuses just like Pd, such as VH, H, M, L, and VL. The rule base which has 15 rules for the fuzzy logical control algorithm is given in Table 2. The membership functions of the Pd, SOC, and PF are given in Figures 3(a)–3(c), respectively. The fuel cell power rule base surface is presented in Figure 3(d). Mamdani’s fuzzy inference approach is used along with the centroid method for defuzzification.
| PF | Pd | |||||
|---|---|---|---|---|---|---|
| VH | H | M | L | VL | ||
| SOC | L | VH | VH | H | M | L |
| M | VH | H | M | L | L | |
| H | H | M | L | VL | VL | |
The ECU module with the FSM strategy is modeled for the hybrid power system as shown in Figure 4. The PD is calculated using the Ibus and Ubus which are measured at every time step. The EMS generates the reference current for the fuel cell and PV panel using the output power commands dividing the DC bus voltage. The battery will compensate the demand power automatically based on (1).
3. Development of Simulation Platform
3.1. Modeling of the Hybrid Power System
3.1.1. Battery Model
3.1.2. Solar Irradiance and PV Panel Model
3.1.3. Fuel Cell Model
3.1.4. Powertrain Model
3.1.5. Integration of the Hybrid Power System
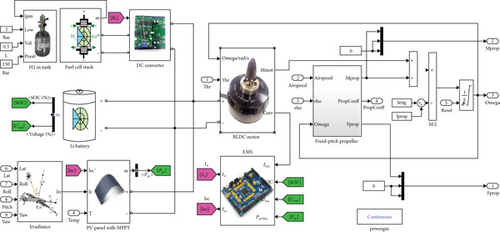
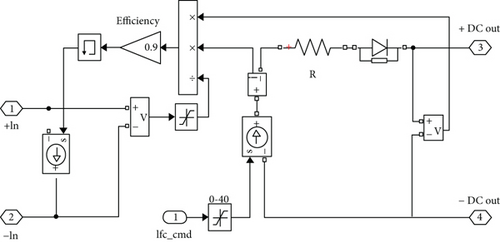
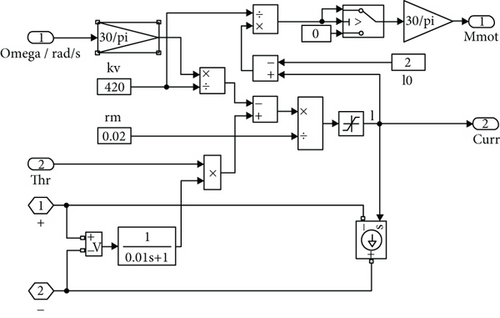
By integrating these models presented above, the topology of the hybrid power system model is shown in Figure 5. The fuel cell current is controlled by the DCDC converter. The simple DCDC converter and BLDC motor simulation models are shown in Figure 6.
3.2. Closed-Loop Simulation Platform of Hybrid Electric UAV
The closed-loop simulation platform of a hybrid electric UAV is developed with the AeroSim Blockset library in Matlab/Simulink as shown in Figure 7. The general aviation (GA) engine propulsion system is replaced by the developed hybrid power system as shown in Figure 5. Except for the UAV model, the platform also contains the aircraft control module and flight planner module. Using the great circle navigation method, the flight planner module calculates the necessary bearing/yaw adjustment, target altitude, and target airspeed based on the waypoint information including the latitude, longitude, altitude, and airspeed. Then the UAV will trace the waypoints correctly. The aircraft control module uses the current and target position, altitude, and airspeed information to generate the throttle signal, rudder deflection angle, aileron deflection angle, and elevator deflection angle. The classical PID control algorithm is used in this module. The throttle range is between 0 and 1. The details of the autopilot model are given in [50].

3.3. Simulation Parameters
The mission scenario includes basic UAV operations such as climb, cruise, descent, and loiter. The waypoint information is listed in Table 3 [50]. It is assumed that the takeoff time is 12:00 at noon on the summer solstice and the maximum irradiance of the day is 1200 W/m2.
| Waypoint | Latitude | Longitude | Altitude (m) | Airspeed (m/s) |
|---|---|---|---|---|
| WP1 (origin) | 26°34′51′′S | 151°50′28′′E | 800 | 20 |
| WP2 | 26°33′58′′S | 151°51′10′′E | 900 | 20 |
| WP3 | 26°34′08′′S | 151°51′25′′E | 900 | 20 |
| WP4 | 26°34′18′′S | 151°53′13′′E | 750 | 30 |
| WP5 | 26°34′08′′S | 151°53′18′′E | 750 | 20 |
| WP6 | 26°33′59′′S | 151°53′13′′E | 750 | 20 |
| WP7 | 26°34′08′′S | 151°53′25′′E | 900 | 20 |
| WP8 | 26°34′14′′S | 151°53′17′′E | 900 | 20 |
| WP9 (end) | 26°34′51′′S | 151°50′28′′E | 800 | 30 |
The initial parameters of the hybrid power system are listed in Table 4 which includes the parameters of the battery, fuel cell, H2 tank, photovoltaic panel, motor, propeller, and DCDC converter. The propeller is still the same as the original Aerosonde UAV. The CT and CP of the propeller are given in [50]. The simulation used the ode14x solver with the fixed-step, and the step size is 0.1 s.
| Power source | Parameters | Values | Unit |
|---|---|---|---|
| Battery | Nominal voltage | 22.2 | V |
| Rated capacity | 6 | Ah | |
| Fully charged voltage | 25.2 | V | |
| Cut-off voltage | 21 | V | |
| Internal resistance | 0.04 | Ω | |
| Capacity at nominal voltage | 5.0 | Ah | |
| Exponential zone | [23.5, 1] | [V, Ah] | |
| Initial state of charge | 90 | % | |
| Maximum charge power | 200 | W | |
| Fuel cell | Voltage at 0A and 1A | [37, 33.7] | V |
| Nominal operating point | [24, 25] | [A, V] | |
| Maximum operating point | [23, 28] | [A, V] | |
| Number of cells | 41 | — | |
| Nominal stack efficiency | 43 | % | |
| Operating temperature | 50 | °C | |
| Nominal air flow rate | 40 | lpm | |
| Nominal supply pressure [fuel, air] | [0.55, 1] | bar | |
| Nominal composition [H2, O2, H2O (air)] | [99.95, 21, 1] | % | |
| Volume of H2 tank | 0.5 | L | |
| Purge water period | 15 | ms | |
| Maximum H2 flow rate when purging water | 40 | lpm | |
| Initial pressure in tank | 200 | bar | |
| Out of fuel pressure in tank | 2 | bar | |
| Photovoltaics | Solar irradiance | 1200 | W/m2 |
| PV panel area | 0.5 | m2 | |
| PV efficiency | 0.3 | — | |
| MPPT efficiency | 0.98 | — | |
| Motor | Motor idle current | 10 | A at 10 V |
| Rotation speed constant | 420 | rpm/V | |
| Motor internal resistance | 33 | mΩ | |
| Motor shaft rotational inertia | 0.0001 | kg·m2 | |
| Propeller | Propeller diameter | 0.254 | m |
| Propeller rotational inertia | 0.002 | kg·m2 | |
| DCDC | Conversion efficiency | 0.9 | — |
| Output voltage | 25 | V | |
4. Results and Discussion
4.1. Hybrid Electric UAV Model Validation
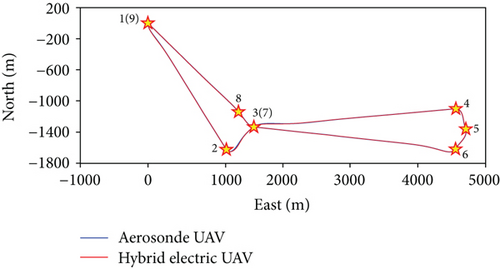
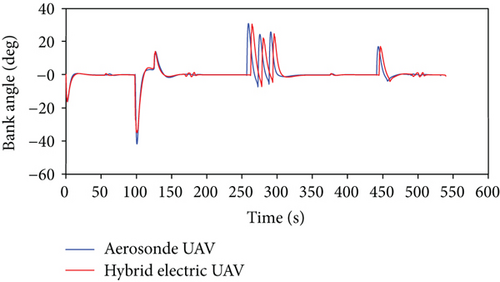
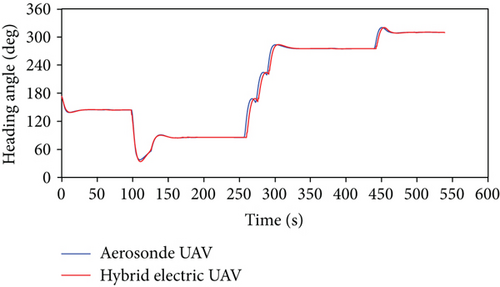
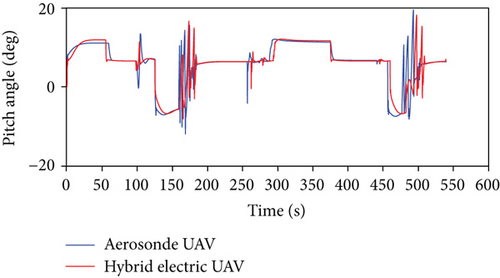
The hybrid electric UAV model is verified by comparison with the original gasoline Aerosonde UAV in Matlab/Simulink under the same mission scenario. The comparison results are presented in Figures 8 and 9. The top and side views of flight paths agree with each other for the two UAVs. The bank and heading angles of the UAVs are the same with each other. That is also the reason for the coincidence of top view paths. Figure 9(c) shows the pitch angles of the two UAVs are a little different during the transition from descent to level flight. That results in the difference of the transitional path as seen in Figure 8(b). The comparison of the two UAVs proves that the hybrid electric UAV model almost has the same performance with the original Aerosonde.

4.2. Energy Management Analysis
- Stage 1
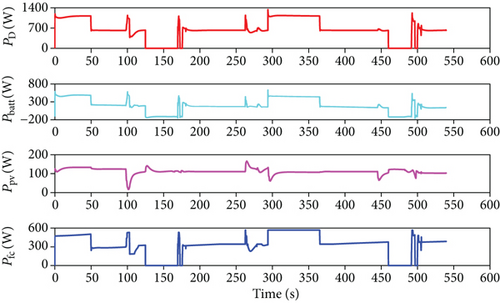
(S1): from waypoint 1 to waypoint 2 about 0–98 s, the UAV climbs from 800 m to 900 m then turns to level flight. During the climb, the demand power is about 1100 W much higher than the maximum power of the PV panel which has the highest priority to provide power. The surplus demand power is split between the battery and the fuel cell by the fuzzy logical control strategy. Since the initial SOC is high, the battery gives more power than the fuel cell. When reaching target altitude 900 m, the UAV turns to level flight, the demand power down to 620 W; the output power of the PV panel shows slight variations due to the decrease of the pitch angle. The output powers of the battery and fuel cell both fall down.
- Stage 2
(S2): from waypoint 2 to waypoint 3 about 98–126 s, the UAV turns left and the bank angle significant changes at about 100 s. The power demand also arises a sudden change which is followed by the battery and fuel cell successfully. The bank angle results in a serious power loss of the PV panel.
- Stage 3
(S3): from waypoint 3 to waypoint 4 about 126–265 s, the UAV changes from descent to level flight. In descent, it glides without any power in need. The power of the PV panel is higher than the demand power which means the PV panel can save the surplus energy by charging the battery. When approaching the target altitude 750 m, the UAV turns to level flight. The pitch angle oscillates heavily. The demand power also waves strongly. The outputs of the battery and fuel cell following the demand power present serious fluctuations, but the power of the PV panel presents light change. Then the UAV gives a long time stable level flight until reaching waypoint 4. Each power source provides a constant output during the level flight.
- Stage 4
(S4): from waypoint 4 to waypoint 6 about 265–290 s, the UAV turns right three times in a short time which causes the variations of the demand power. The PV panel power fluctuates with the bank angle and heading angle. The surplus demand power is followed by the battery and fuel cell.
- Stage 5
(S5): from waypoint 6 to waypoint 7 about 290–448 s, the UAV changes from climb to level flight. At the beginning of the climb, the demand power presents a sharp increase which is tracked by the battery as the demand power is much higher than the maximum power of the fuel cell and PV panel. During this climb, the demand power is up to 1100 W again; the fuel cell operates near the maximum power point, until the UAV is arriving at the target altitude 900 m. Then the UAV turns to level flight and the demand power decreases to 620 W, the output power of battery and fuel cell both decrease, and the PV panel still provides the maximum power to decrease the onboard fuel consumption.
- Stage 6
(S6): from waypoint 7 to waypoint 8 about 448–460 s, the UAV turns right and the demand power changes slightly. The PV panel power varies with the Euler angles. The battery makes up the loss of PV panel, but the fuel cell output makes no change.
- Stage 7
(S7): from waypoint 8 to waypoint 9 about 460–540 s, the UAV glides from 900 m to 800 m, then turns to level flight until reaching the end waypoint. During gliding, the battery is charged again by the PV panel. The fluctuation of the pitch angle during the turning maneuver causes the heavy change of power demand which is followed by the battery and fuel cell. The PV panel power remains relatively stable. After the turning, the UAV has a short level flight to reach waypoint 9 with a stable demand power. The output power of each power source is also stable.

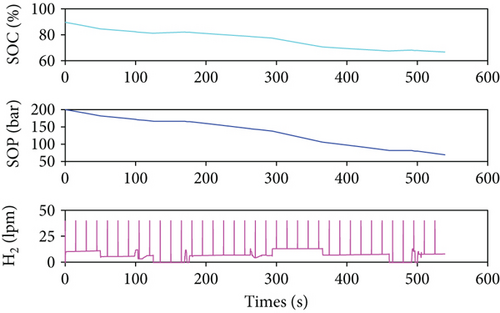
As an assumption, 60% of the SOC belongs to low level considering the battery health and the service life in practical application. Furthermore, to prevent the wind disturbance or other emergencies during the mission, the SOC should not be used too low. The battery SOC, hydrogen SOP, and the consumption flow rate of hydrogen during the mission are shown in Figure 12(a). The SOC varies from 90% to 65% keeping in the ideal operating range. As the SOC decreases, the output power of the fuel cell is higher in the second climb than that in the first climb. The hydrogen in the tank is consumed from 200 bar down to 70 bar. Except for purging water at every 15 s, the hydrogen flow rate varies with the fuel cell power. About 35 g hydrogen is consumed in the mission. The irradiance on the PV panel surface and the output of PV panel are influenced by the flight attitude angles, especially the bank angle in this mission as shown in Figure 12(b).

4.3. Comparison with Thermostat Control Strategy
To be compared with the proposed FSM strategy for the same mission, a constrained thermostat control (CTC) strategy proposed by Lee et al. [28] for the hybrid electric UAV using the same power sources is illustrated in Figure 13. The CTC maintains a certain SOC during the flight process in order to cope with the influence of the weather on the PV panel. The CTC also takes the PV panel as the highest priority output. The surplus power of the PV panel is used to charge the battery. When the SOC is higher than SOCL, the battery is used to make up the insufficient power of the PV panel and fuel cell during high power demand.
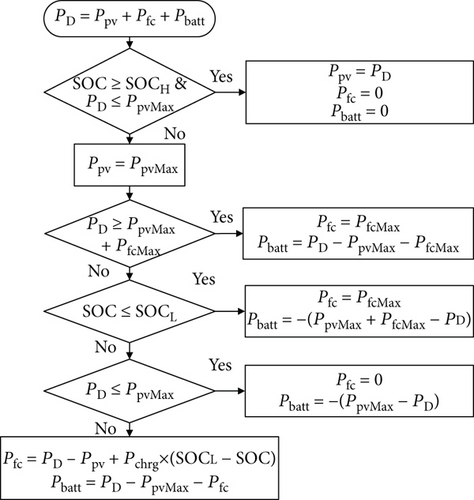
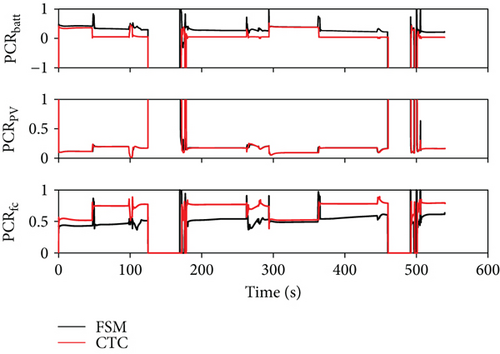
The power contribution rate (PCR) and energy contribution rate (ECR), used to analyze the contribution of each power source, are defined as the output power and energy of each power source divided by the total consumed power and energy, respectively.
The PCR and ECR of each power source for the FSM and CTC strategies are seen in Figure 14. Figure 14(a) shows that the PCRs of the PV panel in both strategies are almost the same. When the demand power is zero, the PCRs of the battery, PV panel, and fuel cell for both strategies are the same, and they are −100%, 100%, and 0%, respectively. But the PCRs of the battery and the fuel cell for the two strategies are different. The PCR of the battery for FSM is higher than that for CTC during most time of the mission. Contrarily, the PCR of the fuel cell for FSM is lower than that for CTC.
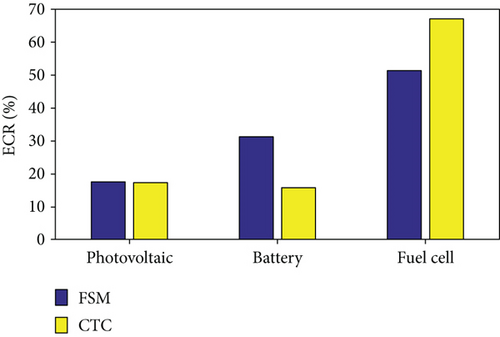
For the battery and the fuel cell in the two strategies, different PCRs result in different ECRs as shown in Figure 14(b). In the FSM test, the ECRs of the PV panel, battery, and fuel cell are 18%, 31%, and 51%, respectively. But in the CTC test, they are 17%, 15%, and 67%, respectively. The energies from the PV panel in the two strategy tests are almost the same. But the energy from the battery for FSM is more than twice as much as that for CTC. The energy from the fuel cell for CTC is obviously more than that for FSM.
The state variations of the battery and the hydrogen in the two strategy tests are shown in Table 5. With the same initial SOC and SOP, the battery is used more efficiently in the FSM test. Compared with the consumed hydrogen under the CTC strategy, less hydrogen is consumed for the FSM strategy. The amount of saved hydrogen fuel is 26.7% under the FSM strategy.
| SOC (%) | SOP (bar) | Consumed H2 (L) |
|||||
|---|---|---|---|---|---|---|---|
| Initial | Final | Consumed | Initial | Final | Consumed | ||
| FSM | 90 | 65 | 25 | 200 | 70 | 130 | 66 |
| CTC | 90 | 77 | 13 | 200 | 19 | 181 | 90 |
5. Conclusions
- (1)
By comparison with the Aerosonde UAV, it indicates that the developed platform is reasonable and acceptable for energy management researches. The platform with a fixed-step size can generate the demand power at every time step for energy management strategies to simulate the online situation.
- (2)
Under the FSM strategy, the PV panel generally provides its maximum available power which is only influenced by the flight attitude, especially the bank angle for this mission. The battery is charged by the PV panel during descent stages, and it can compensate for the surplus demand power or peak power demand. The fuel cell can automatically regulate its output power based on the demand power and battery SOC.
- (3)
In both strategies, the ECRs show that the fuel cell as the main power source provides the most energy for the propulsion system and the PV panel as the additional power source outputs the least energy. The battery as the assist power source responses to high demand power and can be charged at low power demand.
- (4)
The contribution of the PV panel for the FSM strategy is almost the same with that for the CTC strategy. The FSM strategy prefers to consume more battery energy than CTC does. Compared with the CTC strategy, less fuel cell energy is consumed in the FSM strategy which leads to 26.7% of the hydrogen fuel saved.
Nomenclature
-
- αe:
-
- Azimuth angle of the sun (rad)
-
- αs:
-
- Zenith angle of the sun (rad)
-
- δ:
-
- Declination angle of sthe un (rad)
-
- ηdc:
-
- Efficiency of the DCDC converter
-
- ηmppt:
-
- Efficiency of the MPPT
-
- ηpv:
-
- Efficiency of the photovoltaic panel
-
- ρ:
-
- Air density (kg/m3)
-
- ϕ:
-
- Bank angle (rad)
-
- ω(t):
-
- Hour of the sun (rad)
-
- Θ:
-
- Pitch angle (rad)
-
- ψ:
-
- Heading angle (rad)
-
- :
-
- Rotation speed (r/min)
-
- A:
-
- Exponential voltage (V)
-
- B:
-
- Exponential capacity (Ah)
-
- CP:
-
- Power coefficient of the propeller
-
- CT:
-
- Thrust coefficient of the propeller
-
- E0:
-
- Constant voltage
-
- F:
-
- Faraday constant
-
- Fp:
-
- Thrust of the propeller (N)
-
- H2%:
-
- Percentage of hydrogen in fuel
-
- i:
-
- Incidence angle (rad)
-
- ib:
-
- Battery current (A)
-
- i∗:
-
- Filtered current (A)
-
- I0:
-
- Idle current without load (A)
-
- Ibatt:
-
- Current of the battery in simulation (A)
-
- Ibus:
-
- Current of bus (A)
-
- Ifc:
-
- Current command of fuel cell (A)
-
- Iin:
-
- Input current of DCDC (A)
-
- Im:
-
- Terminal current of the electric motor (A)
-
- Iout:
-
- Output current of DCDC (A)
-
- Ipv:
-
- Current command of photovoltaics (A)
-
- J:
-
- Rotational inertia of the motor shaft and propeller (m4)
-
- K:
-
- Polarization constant
-
- kv:
-
- Rotation speed constant
-
- Mm:
-
- Torque produced by motor (N·m)
-
- Mp:
-
- Torque of the propeller (N·m)
-
- n:
-
- Date in the year, n = 1 when the date is the 1st of January
-
- ncell:
-
- Number of cells
-
- P0:
-
- Initial pressure of H2 (bar)
-
- Pair:
-
- Absolute supply pressure of air (atm)
-
- Pb:
-
- Desired output of battery (W)
-
- Pbatt:
-
- Power of battery (W)
-
- Pchrg:
-
- Maximum charge power (W)
-
- Pd:
-
- Means the surplus demand power (W)
-
- PD:
-
- DC power demand (W)
-
- PF:
-
- Desired output of fuel cell (W)
-
- Pfc:
-
- Power of fuel cell (W)
-
- :
-
- Absolute supply pressure of fuel (atm)
-
- Plow:
-
- Low pressure (atm)
-
- Ppv:
-
- Power of photovoltaics (W)
-
- PpvMax:
-
- Maximum available power of PV (W)
-
- Qb:
-
- Maximum battery capacity (Ah)
-
- Qirr:
-
- Solar irradiance (W/m2)
-
- Rp:
-
- Radius of the propeller (m)
-
- R:
-
- Universal gas constant
-
- R0:
-
- Internal resistance of battery (Ω)
-
- R1:
-
- Rotation matrices about the bank angle (ϕ)
-
- R2:
-
- Rotation matrices about the pitch angle (θ)
-
- R3:
-
- Rotation matrices about the heading angle (ψ)
-
- rm:
-
- Terminal resistance of electric motor (Ω)
-
- S:
-
- Area of the PV panel on the wing surface (m2)
-
- :
-
- Unit vector to the sun in the earth-fixed frame
-
- SOC:
-
- State of charge
-
- SOP:
-
- State of pressure (bar)
-
- T:
-
- Temperature of fuel cell (K)
-
- tlocal:
-
- Current hour of the day (hour)
-
- UAV:
-
- Unmanned aerial vehicle
-
- Ubatt:
-
- Voltage of battery (V)
-
- Ubus:
-
- Voltage of bus (V)
-
- :
-
- Rates of utilizations of hydrogen
-
- Uin:
-
- Input voltage of DCDC (V)
-
- Um:
-
- Terminal voltage of the electric motor (V)
-
- Uout:
-
- Output voltage of DCDC (V)
-
- :
-
- Rates of utilizations of oxygen
-
- Vcell:
-
- Single-cell voltage of fuel cell (V)
-
- Vlpm(air):
-
- Air flow rate (L/min)
-
- Vlpm(H2):
-
- H2 flow rate (L/min)
-
- Vlpm(t):
-
- H2 flow rate (L/min)
-
- Z:
-
- Number of moving electrons.
Conflicts of Interest
The authors declare that there is no conflict of interest regarding the publication of this paper.


