Spectral Characteristics of Acoustic Emission in Carbon Fiber-Reinforced Composite Materials Subjected to Cyclic Loading
Abstract
The article is devoted to the investigation of the spectral characteristics of acoustic emission signals that appear under various schemes of composite materials loading. The tests involved samples of composites reinforced with layers sheets of carbon fiber fabric and dispersed carbon fibers. Based on the results of laboratory tests, a comparison is made between the traditional parameters of acoustic emission and the complete spectrograms of the acoustic emission response developed with the use of a special algorithm. The relationship between the emission activity and the change in the spectral composition of emission hits is shown. For example, for some composites, the acoustic emission memory effect (Kaiser effect) manifests itself not only in the time domain but also in the spectral domain in a form of a sharp change in the amplitudes in the frequency range 130/150 kHz. Also, when the samples were loaded according to the Brazilian scheme, the presence of the so-called “inverse” Kaiser effect is observed, in which the memory carrier “remembers” the previously experienced level of tensile stresses and reproduces this information during subsequent unloading. Such effect manifests itself in the form of a sharp change in the amplitudes in the low-frequency region of the spectrum.
1. Introduction
The method of acoustic emission (AE) is widely known as an effective tool for assessing the degree of disturbance of various composite materials [1–4] both at the stage of testing samples in laboratory conditions and when monitoring the state of products and structures. Less well known is the use of AE for studying the stress-strain state of complex and structurally heterogeneous media (rocks, building structures, etc.). This application is based on the so-called acoustical-emission memory effect, also known as the Kaiser effect (KE). This effect is observed in rocks, metals, and composite materials and consists in nonreproducibility of acoustic emission parameters in the subsequent loading cycle in comparison with the previous, when instant recovery of these parameters take place at the moment of reaching the maximum stress level of the preceding cycle [5]. To this day, as the main informative parameters in the analysis of AE, time characteristics are used, such as activity, total activity, and count.
The first attempts of practical application of KE for the evaluation of stress fields in the rock mass refer to the second half of the 1970s. In this case, rock samples extracted from the massif by column drilling were used as a “memory carrier” [6, 7]. Tests of these samples under various conditions of mechanical loading with simultaneous measurement of AE informative parameters made it possible to estimate the stresses acting in the rock massif. However, the accuracy of such an estimate was inadequate in a number of cases, which was associated with a large scatter of mechanical properties and the disturbance of rocks of even one genotype. Further development of the method consisted in determining the parameters of formation and manifestation of KE in rock samples of different genotypes under different loading schemes [8–12].
In recent years, the method based on the use of KE has evolved by replacing the “memory carrier” in the form of rocks with difficult-to-predict properties for composite materials whose acoustic and mechanical properties are being set at the synthesis stage [13]. The use of composites placed in measuring boreholes significantly reduced the spread of stress estimates in the massif by eliminating the uncertainty factor caused by the random distribution of properties in the “memory carrier.” An additional advantage of using materials with programmable properties is the possibility of using specific techniques and algorithms for processing the results of measurements [14]. At the forefront in this case comes the spectral analysis of AE signals, which makes it possible to obtain additional information on the defects growth in the investigated medium.
Attempts to use the analysis of acoustic emission spectra usually face a number of problems of an instrumental and methodical nature. Thus, when the maximum frequency of the spectrum fmax is used as the main informative parameter, it becomes necessary to use broadband acoustic transducers [15]. It is known that the sensitivity of such transducers is significantly lower in comparison to their resonant counterparts [16].
Another approach to the spectral processing of AE signals based on a detailed analysis of the spectra of individual acoustic hits was taken at different loading stages of the samples [17, 18]. The interpretation results in this case are characterized by low reliability and repeatability due to a significant random component in each separate AE hit. A combined analysis of all AE hits without additional processing is also uninformative, as it will be demonstrated further on.
Overcoming of the described problems is possible due to the complex spectral analysis of all waveforms of registered AE hits.
2. Materials and Methods
Studies were performed on cylindrical samples with a diameter of 45 mm and a height of 90 mm made from materials, synthesized under laboratory conditions. The matrix for all samples was the epoxy resin Poxy Systems L. Two types of filler were used: dispersed carbon fibers, with a length of 3 mm, a thickness of 15 μm, and a weight ratio to matrix 1/1000 (series of samples “A”) and sheets of carbon fiber fabric located parallel to the axis of the cylinders (series of samples “B”). Before the entire polymerization of the matrix, all samples were subjected to evacuation at a pressure of 0.3 bar to remove air bubbles and maintain the consistency of the properties of synthesized materials. The fillers used in groups “A” and “B” composites have the same mechanical characteristics. The difference between composites is in the size and form of the initial inhomogeneities. Dispersed fibers create heterogeneities of a small size. In that case, crack growth under loading should be accompanied by the AE in the region of small wavelengths (high frequencies). When using carbon fiber sheets, the dimensions of the inhomogeneities are much larger and changes in the spectral composition should be expected in the low-frequency band. The polished sections of the samples of both series are shown in Figure 1.
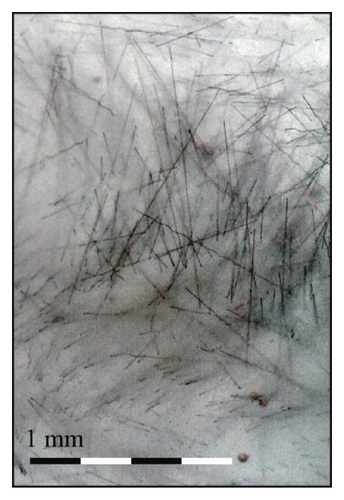
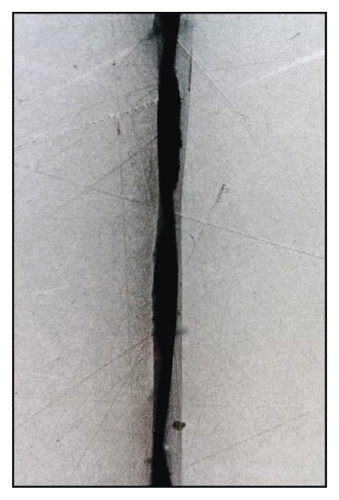
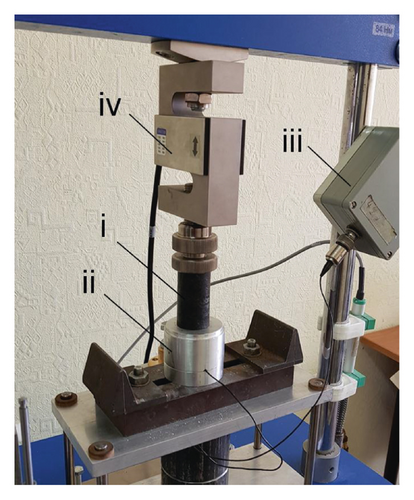
Samples of both series were divided into two groups of 5 pieces in each. Samples of the first group underwent uniaxial multicyclic loading according to the classical scheme (along the axis of the cylinder). Samples of the second group were loaded by the so-called Brazilian scheme (along the diameter of the cylinder), suggesting the occurrence of significant tensile stresses [19]. In this case, the main parameters of the AE and the complete waveforms of all recorded pulses were recorded with the aid of the multichannel acoustic emission complex A-Line 32D with a set of resonant acoustic transducers GT-200. The bandwidth of the entire measuring path was 25–500 kHz. Each AE waveform was recorded separately using the threshold principle. The threshold value was set to 32 dB. The recording time of one waveform was 4096 samples at a sampling interval of 0.2 μs. Also, the time of occurrence of each AE hit was recorded with an accuracy of 1 μs. Scheme of the laboratory setup is shown in Figure 2.
3. Results and Discussion
The results of the experiment were the obtained dependences of the axial mechanical load σ and the acoustic emission activity Ṅ on the loading time t, as well as the package of individual oscillograms of each AE hit. All the obtained oscillograms were subjected to a FFT to transform them into a spectral form. The set of amplitude spectra obtained in this way was presented in the form of a so-called spectrogram—a three-dimensional image, where the AE hit number N is plotted along the horizontal axis, the frequency f is plotted along the vertical axis, and the amplitude is encoded by color. It should be noted that, in the building of a spectrogram, it was not the window Fourier transform of one long record, but the successive fast Fourier transform of the individual AE waveforms. For correct interpretation of the spectrograms obtained, it is required to superimpose σ(t) on them. The peculiarity of the formation of a spectrogram is the sequential arrangement of the spectra in it as a function of the ordinal number. In this case, in the σ(t) dependence, the time with the sampling period ts = 1s is plotted along the horizontal axis. Taking into account the fact that several AE hits occur in one second, the spectrogram and the load graph are “out of synch”. To solve this problem, there are two ways of correction of the spectrogram or correction of the σ(t) dependence. Correction of the spectrogram is a laborious process and, subsequently, can complicate its further processing. The simplest solution is to transform σ(t) into σ(N).
When recording the load, the record starts from the first second. Thus, the sequence number of the record of the load values is also the second at which this load was registered. To transform σ(t) into σ(N) from the waveform files, information is taken about the exact time of occurrence of the AE hit thit. The values of thit are rounded to integer values. In this case, thit becomes simultaneously the index of the registered load σ. Thus, from the whole array of readings σ(t) those that correspond to thit are selected. An example of the dependence Ṅ(t) obtained as a result of loading a sample from the first group and a spectrogram with superimposed σ(N) is shown in Figure 3.
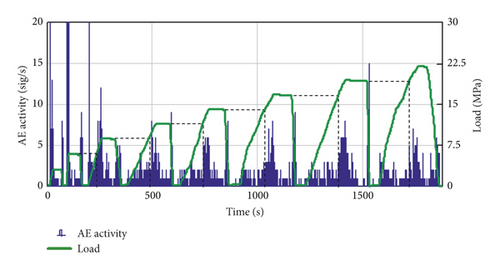
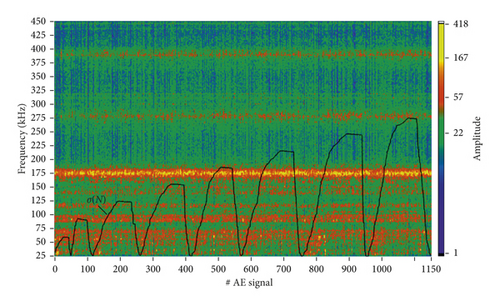
From Figure 3(a) it can be seen that, on all loading cycles, starting from III, the jumps of AE activity are clearly revealed when the load reaches the maximum of the preceding cycle. It corresponds to KE manifestation. At the same time, no regularities in the spectral composition of the AE hits are observed on the obtained spectrogram (Figure 3(b)) without additional processing. In the spectrogram, only the region of high amplitudes along the horizontal line at 175 kHz is distinguished. This line is due to the resonant type of the frequency response of the transducer used, for which the resonant frequency is exactly fres = 175 kHz.
It should be noted that when using the moving average, information on the absolute values of the amplitudes of the registered AE pulses is lost. Such a loss, however, does not have a significant effect on the results of the spectrograms interpretation, since in the final analysis only the relative amplitude variation at different stages of loading has a value.
When smoothing with a moving average, the problem arises in selecting the parameters of the smoothing window. In practice, specific numerical values for obtaining the best result are selected by the operator. However, if you use too large windows, there is edge effects-data loss at the edges of the smoothed area. In this case, a window with parameters a = 15 and b = 5 was chosen for smoothing with the number of registered AE pulses N = 1150 and the number of discretes along the frequency axis-2048. The result of the transformation of the spectrogram for a sample of the first group is shown in Figure 4.
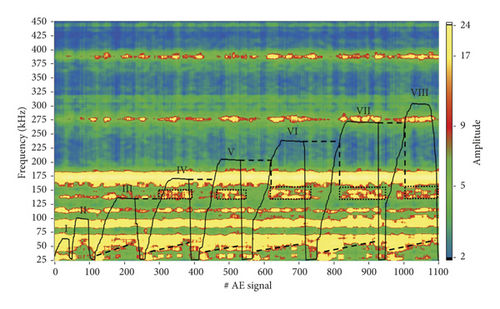
As a result of processing the spectrogram, it is possible to single out a number of regularities on it. Firstly, in the range up to 50 kHz, the role of low frequencies decreases with the increasing load. In this case, the low-frequency amplitudes return to their original levels when the load is removed. Such a change may be due to the closure of some of the cracks formed. In this case, with a change in the size of the defects, the spectral composition of the acoustic pulses corresponding to them also changes [3].
Along with low-frequency components, significant changes are also observed in the range of medium frequencies (130/150 kHz). In this range, the amplitude change occurs abruptly at the moment when the value of σ reaches the maximum level of the previous cycle and most clearly this change begins with the IV loading cycle, i.e., from the load level 0.1 of strength limit. Thus, the Kaiser effect in the material is manifested not only in the form of acoustic emission activity burst but also in the form of a sharp change in the spectral characteristics of the AE signals.
The results of loading a sample of the “B” series are shown in Figure 5.
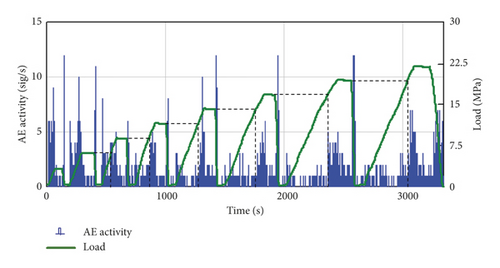
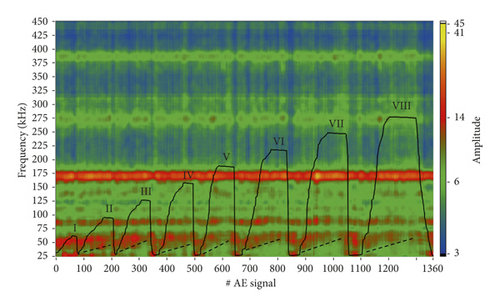
Figure 5(a) demonstrates the presence of an acoustic emission memory effect in a composite reinforced with layers of carbon fiber fabric. However, in contrast to the samples of group “A”, in spectral analysis of AE (Figure 5(b)), no significant change in the frequency band of 130/150 kHz is observed. This regularity can be explained by the absence of cracks of small size (Figure 1) capable of causing high-frequency AE hits in the “B” series. In this case, there is only a repeatable cycle-to-cycle amplitude reduction at frequencies up to 50 kHz with increasing load.
The results of loading the samples of group 2 according to the Brazilian scheme are illustrated in Figure 6. Unlike the first group, the load on the sample is represented as the mechanical force P (kN) produced by the loading device. Smoothing parameters were chosen similarly in group 1.
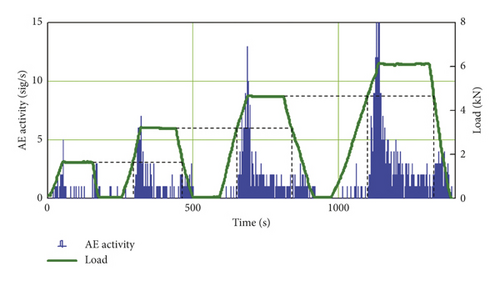
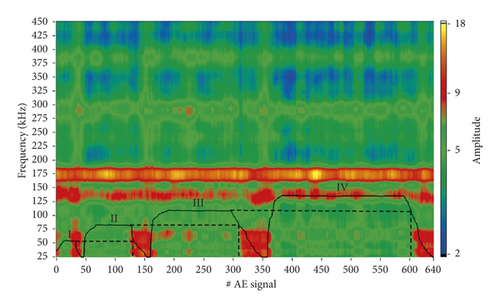
When analyzing the behavior of AE activity (Figure 6(a)), the manifestations of the Kaiser effect are clearly distinguished when the axial load exceeds the maximum of the preceding cycle P∗.The spectrogram (Figure 6(b)) shows a distinct and sharp change in amplitudes in the frequency range 25/70 kHz. The rise of amplitudes in this range occurs every time when the load decreases and passes through the P∗ level. The low-frequency amplitudes remain high up to the intersection of the P∗ level during the subsequent loading stage. At this point, they restore the original values. This behavior can be explained by the fact that, at the stage of unloading, acoustic emission has a predominantly frictional nature (i.e., it is related to friction between the cracks bridges). Formation of new and growth of existing cracks practically does not occur. In the process of removing the load, there are tangential stresses at the “matrix-reinforcing fiber” boundary [20], arising from the significant difference in the elastic moduli of epoxy resin (E = 40 MPa) and carbon fiber (E = 50 GPa), which leads to sliding breach at the “fiber-matrix” boundary. Tensile stresses capable of breaking the carbon fibers were not achieved during the loading process. Samples of the “B” series showed similar regularities.
When using AE spectral analysis, it is necessary to understand that, in practice, calculation of the exact characteristics of the signal source is practically impossible because of the need to calculate both the response function of the used transducers and the entire system as a whole. And if the approaches to calculating the response functions of the transducers are known [21, 22], finding the function of the whole system (including transducers, sample, and loading device) is extremely difficult. Despite the foregoing, the authors of the article are sure that the relative change in the spectral characteristics of AE signals in the process of loading can give important indirect information about the nature and degree of disturbance of composite materials.
4. Conclusions
- (1)
Analysis of acoustic emission spectra is most effective when all registered waveforms are included in the processing. In order to exclude the random component, it is necessary to use the smoothing of the spectrograms both along the time and frequency axis.
- (2)
The spectral composition of the AE hits during cyclic loading varies both in the low-frequency range (up to 50 kHz) and in the frequency range 130/150 kHz for composite samples reinforced with dispersed fibers. Moreover, a sharp change in amplitudes in the range of 130/150 kHz corresponds to the moment when the load reaches the maximum previously experienced value. Thus, the acoustical-emission memory effect (the Kaiser effect) manifests itself not only in the time domain but also in the spectral domain.
- (3)
The spectral composition of the AE hits under cyclic loading of composite samples reinforced with sheets of carbon fiber fabric varies only in the range of low (up to 50 kHz) frequencies. This can be attributed to the lack of cracks that are small in length and capable of elastic closure-opening during loading and unloading.
- (4)
When the composites are loaded according to the so-called Brazilian scheme, which presupposes the appearance of tensile stresses, a significant change in the spectral composition of the AE occurs in the low-frequency region. Of particular interest is the effect of an abrupt increase in the amplitudes in the frequency range up to 50 kHz during unloading when the previously experienced maximum load is reached. The growth of AE activity in this case is practically indistinguishable. Thus, the sample exhibits an “inverse” Kaiser effect—an effect in which the memory carrier “remembers” the previously experienced level of tensile stresses and reproduces this information during subsequent unloading. Such effect can be used to evaluate tensile stresses in complex and inhomogeneous media such as rocks and building structures.
Conflicts of Interest
The authors declare that they have no conflicts of interest.
Acknowledgments
This work was supported by the Russian Scientific Foundation (project no. 17-77-10009).
Open Research
Data Availability
The data used to support the findings of this study are available from the corresponding author upon request.


