First-Principles Study of Properties of Alpha Uranium Crystal and Seven Alpha Uranium Surfaces
Abstract
First-principles calculation based on the GGA methods has been applied to the prediction of the properties of bulk α-uranium and seven α-uranium surfaces. The number of layers in the slab has great effects on the simulated surface properties. The predicted surface properties are trustworthy when the slab number is nine or more. The surface energies of the seven low index uranium surfaces are in the range from 1.756 to 2.151 J/m2. The hybrid between the 5f orbital and 6d orbital also has somewhat impacts on the surface energies of uranium.
1. Introduction
Uranium is a very typical early actinide metal. It has a very wide range of applications in the field of aerospace and military industry [1, 2]. Uranium exists in alpha phase under normal pressure [3]. Recently, the behavior of U at elevated pressure and temperature was studied experimentally [4, 5], and it was shown that alpha phase is stable up to at least 1 Mbar at ambient temperature with a bcc phase developing [5] at higher temperatures. Modern reviews of the physical properties of uranium were given by Fisher [6] and Lander [7] et al.
Uranium easily reacts with hydrogen [8], oxygen [9], and water [10] due to its lively chemical nature. These reactions take place on the surface and are mainly determined by the nature of the 5f electrons of the surface atoms. The effect of 5f electrons of early actinide metals (Th–Np) has attracted considerable attention for years [11–14]. There are a lot of cases about the surface properties of uranium and uranium compound in experiments [15, 16]. Most of the experimental surface energies stem from surface tension measurements in the liquid phase extrapolated to zero temperature. These experimental data of surface energies include uncertainties of unknown magnitudes and correspond to an isotropic crystal. Hence, they do not yield information about the surface energy of a particular surface facet. There are no exhaustive experimental determinations of the anisotropy in the surface energy of the alpha uranium in solid. Therefore, theoretical calculations play important roles in predicting the surface properties of alpha uranium. With the development in electronic structure simulations theory, in particular in density function theory (DFT), the available computing capacities deliver unprecedented power to compute various properties at an atomistic level. The DFT methods have been used with great success to predict an accurate surface energy. During the last decade there have been many calculations of the surface energy of metals from either the first-principles or the semiempirical methods [4, 17–19]. For example, Taylor investigated the properties of the (001)-oriented α-uranium single-crystal surface in particular by the projector-augmented wave potential method (PAW) [18]. Recently, Söderlind investigated the actinide metals to describe primarily phase stability, bonding, and electronic structure by density-functional theory (DFT) calculations. He found that the early actinides are governed predominantly by fully active 5f bonding [11]. The DFT-PAW method was actually able to reproduce the bonding and electronic structure of alpha uranium [12]. Zhang [13] and Michael [14] et al. also investigated the actinide metals by computer simulations. Their results indicated that the 5f electrons of uranium are similar to the d orbital electrons in the transition elements mainly as parade electron. Compared with the bulk atoms, the deficit of atoms near the uranium surface will break the balance between the delocalization and localization of 5f electrons leading to the electrons changing from delocalization to localization. As the electrons change from delocalization to localization, the arrangement of the surface atoms is interrupted and the total energy of surface system increases. In order to reduce the surface system energy, the geometry adjustment will lead to surface relaxation and reconstruction.
Although there are lots of surface property calculations of uranium and uranium compound, the comprehensive and accurate surface properties for alpha uranium are lacked. In this paper we investigated the calculation accuracy of alpha uranium bulk by using different GGA methods (PAW, PBE, RPBE, and PW91) at first. Hereafter, in this paper, we focused on the investigation of different surfaces of alpha uranium bulk using the most precise GGA methods. These GGA methods have been previously shown to treat the ground state properties of the light actinides [12]. The surface energies, work function, bulk modulus, elastic constants, and electronic state density of seven basic alpha uranium surfaces were calculated and the results are presented in Section 3.
2. Computational Details
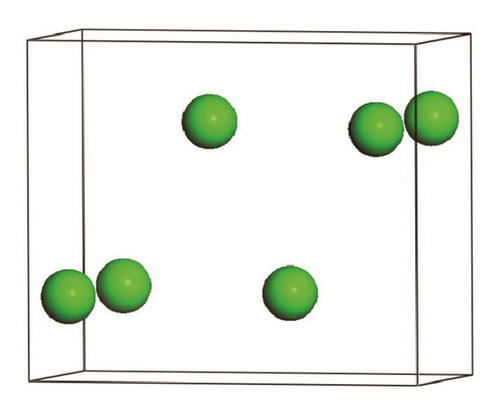
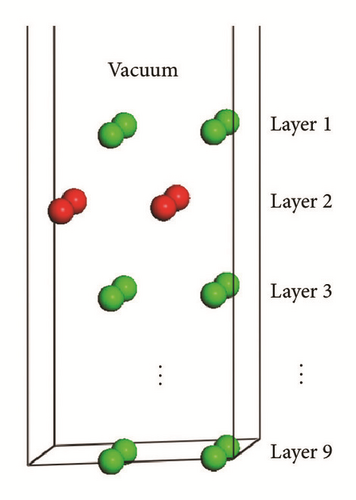
The calculations of surface properties of alpha uranium (Figure 1) have been performed with both the Vienna ab initio simulation package (VASP) [20] and the CASTEP [21] package. All the calculations of VASP are performed within the framework of DFT using electron-ion interaction with the projector-augmented wave (PAW) method. Whereas, all the calculations of CASTEP are done with the GGA method using PBE, RPBE, and PW91 functionals. The electronic wave functions were obtained by a density-mixing scheme, and the structures were relaxed using the BFGS method. The cutoff energy of the plane waves was set to be 500.0 eV. Brillouin-zone sampling was performed using the Monkhorst-Pack scheme. The values of the kinetic energy cutoff and the k-point grid were determined to ensure the convergence of total energies.
3. Results and Discussion
3.1. Bulk Properties
Uranium is an orthorhombic crystal structure. Before we studied the surface properties of uranium, we first benchmarked our calculation of the ground state properties of the alpha uranium crystal by comparing with previous first-principles calculations and experimental values (Table 1) [4, 11, 18, 22–24]. The calculated lattice parameters and total energies of alpha uranium bulk were listed in Table 1. All the lattice parameters of the GGA methods (GGA-PBE, GGA-RPBE, and GGA-PW91) are close to the experimental values (a = 2.836 Å, b = 5.867 Å, and c = 4.955 Å). It also shows that the results of the GGA-PBE method (a = 2.854 Å, b = 5.869 Å, and c = 5.035 Å, CASTEP) agree well with the experimental values, PP calculation (a = 2.809 Å, b = 5.447 Å, and c = 4.964 Å) and FP calculation (a = 2.845 Å, b = 5.818 Å, and c = 4.996 Å) and are more accurate than the VASP calculations of DFT (a = 2.781 Å, b = 5.731 Å, and c = 4.941 Å), DFT + U (a = 2.817 Å, b = 5.805 Å, and c = 5.005 Å), and DFT + U + SOC (a = 2.871 Å, b = 5.982 Å, and c = 5.014 Å). The similar investigations also can be seen in Söderlind’s research [12]. After the original cell of the uranium being fully relaxed, the calculated total energy of the original cell is −5615.273 eV (GGA-PBE) which is the lowest total energy of all the three GGA methods. Therefore, the GGA-PBE method is a feasible method. It is also further indicated that the properties of ground state alpha uranium obtained with the GGA-PBE method of CASTEP (ultrasoft pseudopotentials) are somewhat more accurate than the results obtained with the VASP (all electron pseudopotentials).
| Method | a | b | c | Bulk modulus | E |
|---|---|---|---|---|---|
| GGA-PBE a | 2.854 | 5.869 | 4.955 | 114.524 | −5615.273 |
| GGA-RPBE a | 2.826 | 5.962 | 4.898 | 132.124 | −5616.184 |
| GGA-PW91 a | 2.833 | 5.653 | 5.041 | 127.813 | −5618.287 |
| GGA-PAW (DFT) b | 2.781 | 5.731 | 4.941 | 124.156 | −5615.932 |
| GGA- PAW (DFT + U) b | 2.817 | 5.805 | 5.005 | 130.243 | −5616.027 |
| GGA- PAW (DFT + U + SOC) b | 2.871 | 5.982 | 5.014 | 124.736 | −5616.723 |
| Expt [22] | 2.836 | 5.866 | 4.936 | 115 | — |
| FP [23] | 2.845 | 5.818 | 4.996 | 130 | — |
| PP [24] | 2.809 | 5.447 | 4.964 | — | — |
- ameans results from CASTEP calculations. bmeans results from VASP calculations.
After optimizing and comparing the lattice constants via the GGA methods, the elastic and bulk moduli were also calculated using the GGA methods (PAW (VASP), PBE, RPBE, and PW91 (CASTEP)). The calculation results are compared with the experimental data and other works [11, 22–24] (Tables 1 and 2). The determination of elastic constants is important because these constants contain detailed information about the chemical bond and provide a very sensitive test of the DFT methods. As presented in Table 1, the values of bulk modulus of our calculation are very close to experimental value (115 GPa). Especially for the GGA-PBE method (CASTEP), the bulk modulus is 114.524 GPa and deviates only 1% from the experimental value. The same trend also can be seen in the elastic constants results of alpha uranium (Table 2). The elastic constants values by GGA-PBE method are close to the experimental value and agree well with those reported in literature. It is certificated that the GGA-PBE method (CASTEP) is an accurate method in predicting the ground state properties of alpha uranium bulk. In the following work, we decided to use only the GGA-PBE method (CASTEP) to calculate the surface properties of alpha uranium.
| Method | C11 | C22 | C33 | C44 | C55 | C66 | C12 | C13 | C23 |
|---|---|---|---|---|---|---|---|---|---|
| GGA-PBE a | 2.05 | 1.96 | 2.94 | 1.26 | 1.03 | 0.86 | 0.51 | 0.15 | 1.02 |
| GGA-RPBE a | 1.91 | 1.86 | 3.33 | 1.33 | 1.11 | 1.04 | 0.55 | 0.40 | 0.98 |
| GGA-PW91 a | 2.39 | 2.05 | 3.18 | 1.34 | 1.23 | 0.35 | 0.53 | 0.36 | 1.41 |
| GGA-PAW (DFT) b | 2.60 | 2.12 | 2.85 | 1.00 | 1.41 | 1.23 | 0.74 | 0.17 | 1.35 |
| GGA- PAW (DFT + U) b | 2.63 | 1.81 | 2.71 | 0.98 | 1.40 | 1.23 | 0.67 | 0.16 | 1.15 |
| GGA-PAW (DFT + U + SOC) b | 2.61 | 1.97 | 2.80 | 1.02 | 1.41 | 1.27 | 0.66 | 0.16 | 1.23 |
| GGA-PAW [11] | 2.87 | 2.41 | 3.16 | 1.40 | 1.05 | 0.96 | 0.43 | 0.17 | 1.10 |
| Expt [23] | 2.15 | 1.99 | 2.67 | 1.24 | 0.73 | 0.74 | 0.46 | 0.22 | 1.08 |
- aResults from CASTEP calculations. bFrom VASP.
3.2. Surface Properties of U(001)
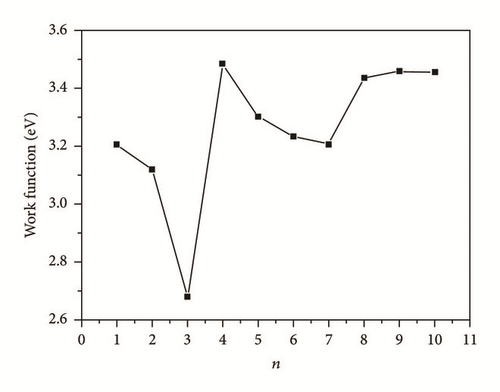
We selected the GGA-PBE computational method (CASTEP) to predict the surface properties of alpha U(001) surface. We also selected surface slab models by comparing the predicted surface properties of alpha U(001) surface with the experimental data and finally ensured that the number of slab layers is large enough to make an accurate description of surface properties. Table 3 lists the geometrical relaxation of the first and second interlayer spacing of the U(001) slab with respect to the bulk value d0, the total energy Etot(n), slab incremental energy ΔEn, surface energy Γ, and work function Ф. In order to facilitate the discussions, we plotted the aforementioned quantities versus n (Figures 3–5).
| N | Etot(n) (eV) | ΔEn (eV) | Γ (J/m2) | Ф (eV) | Δd12/d0 (%) | Δd23/d0 (%) |
|---|---|---|---|---|---|---|
| 1 | −1401.633 | 2.073 | 3.208 | |||
| 2 | −2805.738 | −1404.105 | 1.788 | 3.122 | −10.8 | |
| 3 | −4209.553 | −1403.815 | 1.769 | 2.682 | −5.0 | −4.9 |
| 4 | −5613.355 | −1403.802 | 1.767 | 3.486 | −4.2 | −2.7 |
| 5 | −7017.170 | −1403.815 | 1.754 | 3.303 | −3.6 | 0.0 |
| 6 | −8420.969 | −1403.799 | 1.756 | 3.236 | −3.5 | 0.0 |
| 7 | −9824.756 | −1403.787 | 1.756 | 3.209 | −3.5 | 0.0 |
| 8 | −11228.573 | −1403.817 | 1.756 | 3.437 | −3.5 | 0.0 |
| 9 | −12632.374 | −1403.801 | 1.756 | 3.461 | −3.5 | 0.0 |
| 10 | −14036.180 | −1403.806 | 1.751 | 3.457 | −3.5 | 0.0 |
- aΔd12/d0 and Δd23/d0 represent the relaxation of the first and second interlayer spacing of the U(001) slab with respect to the bulk value d0. Etot(n) is the total energy, ΔEn is the slab incremental energy, Γ is the surface energy, and Ф is the work function.
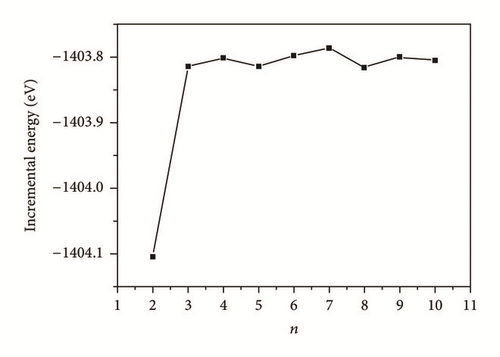
As can be seen in Figure 3, ΔEn values oscillate largely until n = 3. This phenomenon can be attributed to the Quantum Size Effect (QSE), which is the dependence of thin film properties on its characteristic geometric dimensions. For the U(001) surface, QSE is small as the fluctuations in ΔEn are small when n = 3 and beyond. It is indicated that the first three layers contribute dominantly to the surface properties of uranium. As shown in Table 3, in the same surface configurations, d12 has much larger shrinkage than d23 due to the interaction of uranium atoms, which strengthens the interaction between the surface and subsurface, and finally narrows the distances between all the uranium layers. The decreases of surface distance (Δd12/d0, Δd23/d0) become much smaller as the surface layers increase. It is also indicated that the surface energies are greatly affected by the three outermost surface uranium atoms.
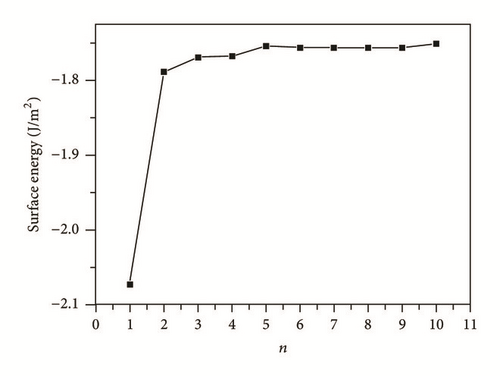
The surface energy is one of the most important quantities for characterizing the stability of a surface. As shown in Table 3 and Figure 4, the surface energies of U(001) surface have a great dependence on the number of slab layers. At n = 6, the variations in successive surface energies are quite small. Therefore, a slab of at least 6-layer thickness is appropriate for an accurate determination of the U(001) surface energy. The surface energies of our calculation are in the range of 1.751 to 1.756 J m−2 for the slab of at least 6-layer thickness, which are closer to the experimental data than the previous theoretical works [18].
The work function, Ф, is the smallest energy required to remove an electron deep inside the bulk crystal through the surface and far away from the surface on the microscopic scale at temperature of 0 K. The work functions for U(001) are listed in Table 3 and corresponding plot is presented in Figure 5. Clearly, a large QSE can be seen until n = 8, followed by a rapid convergence of work function. A close examination of the actual values in Table 3 revealed that, for n = 8, the value of work function is converged to the value about 3.450 eV, which is very close to the experimental value [25] of polycrystalline uranium (3.47 eV) and more accurate than the other research (3.58–3.82 eV). Thus, in the subsequent calculations of the other six basic uranium surfaces (U(010), U(100), U(110), U(011), U(101), and U(111)), we use the slab models of 9 layers to simulate all the properties of the seven low index surfaces.
3.3. Surface Properties of Seven Basic Uranium Surfaces
The surface energies were obtained by (2) and listed in Table 4 as well as shown in Figure 6. The experimental surface energy of uranium is 1.8281 J m−2 [18]. However, the experimental value corresponds to an isotropic crystal or an average value of different surfaces. Judged by this fact, our result is in good agreement with experiment. As shown in Figure 6, the descended order of surface energy for these seven surfaces is U(110) > U(111) > U(010) = U(100) > U(011) = U(101) > U(001). The surface energy of U(001) is 1.756 J m−2, the lowest of all the seven surfaces. The U(001) surface was predicted to be the most stable one. On the contrary, the U(110) surface is the most unstable.
| Surface | Γ | Ф |
|---|---|---|
| U(001) | 1.756 | 3.354 |
| U(010) | 2.089 | 2.951 |
| U(100) | 2.089 | 3.185 |
| U(110) | 2.151 | 3.111 |
| U(101) | 1.996 | 3.124 |
| U(011) | 1.996 | 3.163 |
| U(111) | 2.138 | 2.944 |
- Γ in J m−2 and Ф in eV.
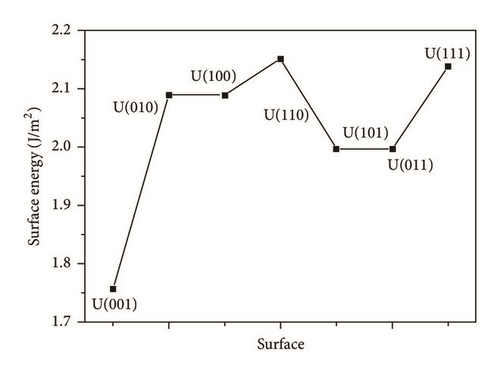
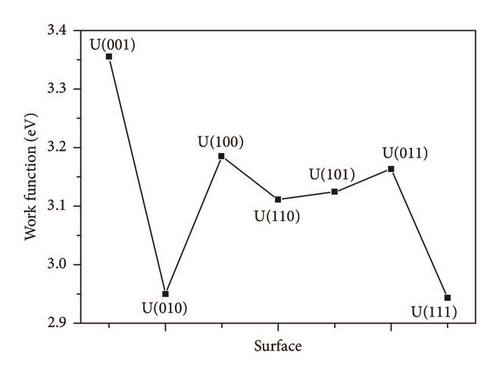
As shown in Table 4 and Figures 6 and 7, the values of the surface energies and work functions of these seven low index alpha uranium surfaces are roughly inversely proportional. A low work function value implies that electrons can easily escape from the bulk region of uranium surfaces, and react with impurities at the surfaces. The work function value of U(001) is 3.354 eV, the highest of all the seven surfaces. The U(001) surface was also predicted to be the most stable one. On the contrary, the U(111) surface is the surface which is the most likely to react with the impurities.
As can be seen in Figure 8, the total density of state (DOS) for uranium consists of 5f and 6d orbitals. Especially around the Fermi level, the 5f orbital’s partial density of state is dominant; the s and the p orbitals contribute only with a small part of the total density of state. As shown in the density of state (DOS) for different surfaces (Figure 8), all the peaks of the density of states around the Fermi level shift down obviously due to the electronic orbit split and overlap together, compared to the DOS of α-uranium crystal. The widths of DOS around the Fermi level for all the seven surfaces are narrower in comparison with that of α-uranium bulk. It is indicated that the 6d orbital’s partial density of state strengthens the hybrid between the 5f-6d orbitals for all the seven basic surfaces. The 5f orbital electrons are hybrid with the 6d electrons. The 5f orbital’s electrons change from delocalization to locality, and the energy bands of 6d and 5f become narrower. Owing to the spin-orbit coupling the s, p, d, and f orbitals, the energy bands around the Fermi level split. Therefore, it can be demonstrated that the spin-orbit coupling has a large impact on the surface energies of uranium. With more peaks split and deformed, the surface energies become larger.
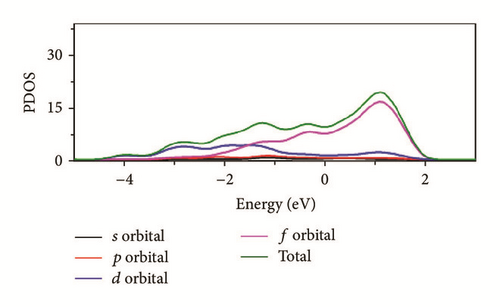
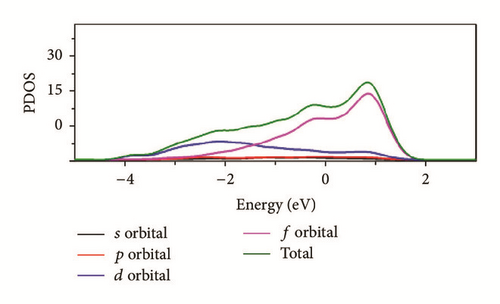
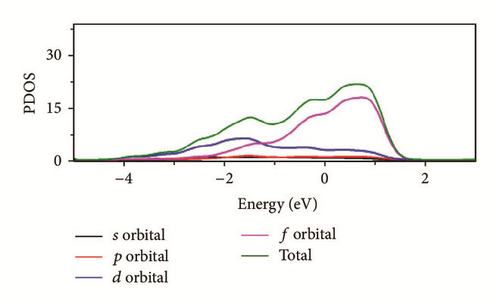
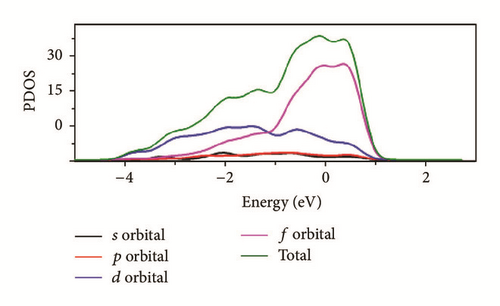
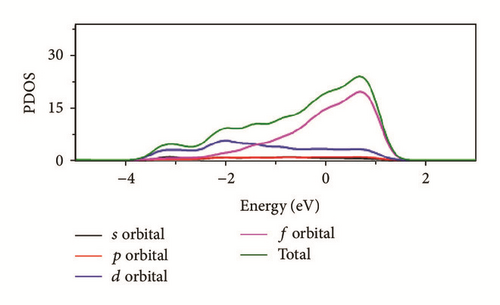
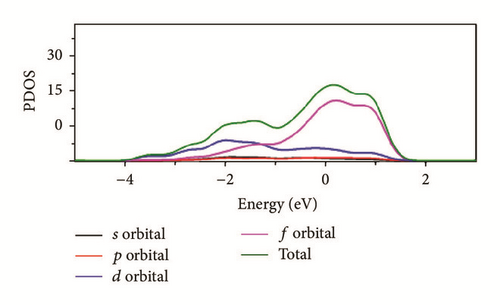
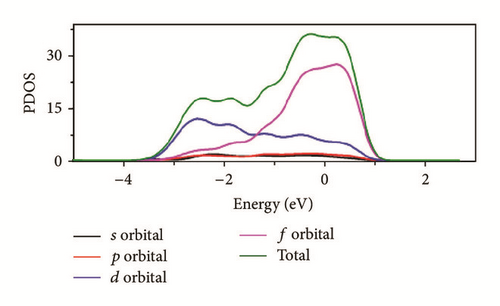
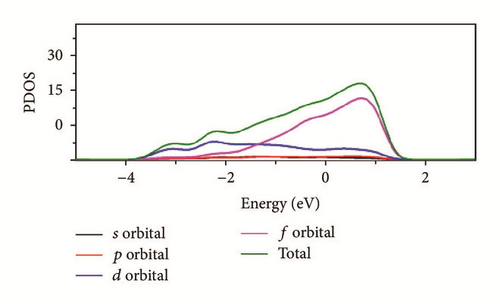
Compared to the bulk, the U(001) has the smallest hybrid between the 5f-6d orbitals, the least peak splitting, and the smallest deformation in the density of state. Therefore, the U(001) is the most stable surface with the lowest surface energy. On the contrary, the other six basic low index surfaces deform larger, which causes them more unstable and larger surface energies.
4. Conclusions
The GGA methods are able to predict the ground state properties (lattice constants, elastic moduli, and bulk modulus) of alpha uranium bulk. The calculation results are in reasonable agreement with the experimental results and the available theoretical works [4, 11, 12, 18, 22–24]. The GGA-PBE (CASTEP) is the most accurate method among the GGA methods used in our research to predict the properties of alpha uranium.
The surface properties were calculated by GGA-PBE method for U(001) with n (n = 1–10) layers. By comparing the surface energies and work functions with the experimental data, we ensured that a slab with nine layers is thick enough to make an accurate description of surface properties. Judging by the relaxation of the first and second interlayer spacing of the U(001) slab, the first three layers contribute dominantly to the surface energy.
The surface energy and work function are related to the surface density of state. The analysis of density of states shows that the 5f orbital electrons are hybrid with the 6d orbital electrons. Consequently, the 5f orbital electrons change from delocalization to localization and energy bands become narrower and move down. Owing to the spin-orbit coupling, the splitting of the p, d, and f bands also has a large influence on the surface energies of uranium. With more peak splitting and deforming in the density of state, the surface energies become larger.
Competing Interests
The authors declare that they have no competing interests.
Acknowledgments
This work was financially supported by the funding of the Science and Technology on Combustion and Explosion Laboratory (Grant no. 9140C3501021101).


