Characterization of Recharge Mechanisms and Sources of Groundwater Salinization in Ras Jbel Coastal Aquifer (Northeast Tunisia) Using Hydrogeochemical Tools, Environmental Isotopes, GIS, and Statistics
Abstract
Groundwater is among the most available water resources in Tunisia; it is a vital natural resource in arid and semiarid regions. Located in north-eastern Tunisia, the Metline-Ras Jbel-Raf Raf aquifer is a mio-plio-quaternary shallow coastal aquifer, where groundwater is the most important source of water supply. The major ion hydrochemistry and environmental isotope composition (δ18O, δ2H) were investigated to identify the recharge sources and processes that affect the groundwater salinization. The combination of hydrogeochemical, isotopic, statistical, and GIS approaches demonstrates that the salinity and the groundwater composition are largely controlled by the water-rock interaction particularly the dissolution of evaporate minerals and the ion exchange process, the return flow of the irrigation water, agricultural fertilizers, and finally saltwater intrusion which started before 1980 and which is partially mitigated by the artificial recharge since 1993. As for the stable isotope signatures, results showed that groundwater samples lay on and around the local meteoric water line LMWL; hence, this arrangement signifies that the recharge of the Ras Jbel aquifer is ensured by recent recharge from Mediterranean air masses.
1. Introduction
The hydrogeology of coastal aquifers has been studied intensively during the past decades, stimulated by both scientific interest and societal relevance [1]. Coastal areas throughout the Mediterranean face salinization problems of groundwater which is the major source of water supply especially for drinking and agricultural sector. The imbalance between abstraction and natural recharge rates causes an overexploitation of groundwater resources resulting in declining groundwater table, water quality degradation, and crop damage.
A number of aquifers in coastal zones are being increasingly exploited and affected ([2–6]). For instance, groundwater contamination and decline of water levels have been reported in Tunisia [7–13] and in many countries around the world. It has been reported in India [14], Jordan [15], Australia [16], USA [17], China ([18, 19]), Netherland [1], and among many others.
In semiarid coastal regions of north-eastern Tunisia, such as Ras Jbel plain, the groundwater is usually the main resource used for irrigation and drinking purposes. Nevertheless, salinization is becoming a common problem affecting groundwater resources. Groundwater exploitation of the Ras Jbel aquifer began in 1949 and has increased each year since 1980. Under pressures of population, climate change, and pollution, the aquifer faces substantial challenges in the management of scarce freshwater resources. During the last four decades, the shallow aquifer groundwater has been overexploited through excessive, uncontrolled pumping mainly for domestic and agricultural purposes [20]. Salinization due to seawater intrusion and decreasing groundwater levels has recently been identified [21]. Unplanned and substantial withdrawals of groundwater from the shallow aquifer of Ras Jbel have resulted in severe water level decline of up to 7 m in some areas and high total dissolved solids (TDS) contents reaching 8000 mg/l. Reports of increasing salinity of groundwater supplies in the area suggest a need to define the sources of salt water. It is also useful to study the recharge mechanisms as well as the mixing fresh water/saline water.
Stable isotope and geochemical techniques have been used in groundwater studies of coastal aquifers worldwide [22–25] for determining the origins of groundwater salinization in aquifers and processes that affect water chemistry, such as rock weathering, evaporation, atmospheric precipitation, and cation exchange. Consequently, studying stable isotope and geochemical techniques can significantly improve our understanding of groundwater hydrodynamical processes and chemical evolution [26]. In the present study, environmental isotopes (δ18O, δ2H) in conjunction with hydrochemistry (major ions) were employed (1) to define the potential sources and different mechanisms of groundwater salinization in the study area (2) to discuss the chemical evolution of groundwater and (3) to explain groundwater recharge and discharge in the coastal plain of Metline- Ras Jbel- Raf Raf.
2. Study Area
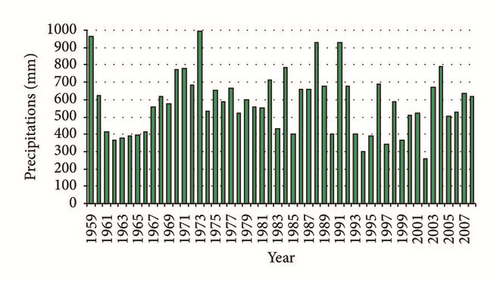
The Metline-Ras Jbel-Raf Raf plain, which covers a total area of about 50 km2, represents one of the most important agricultural regions in north-eastern Tunisia (Figure 1). It is characterized by a semiarid, “Mediterranean” climate with mild, wet winters and warm, dry summers [27, 28]. The average annual precipitation ranges from approximately 258 to 993 mm (Figure 2). Geologically, it is limited to the south by Jbel Djaouf, En Nadhour, and Ed Demina, to the southwest by Jbel Sidi Saleh, Hakima, and El Faouar, to northwest by Jbel Bab Banzart, Sidi Bou Choucha, and Touchela, to the north and northeast by the Mediterranean sea. The plain of Metline-Ras Jbel-Raf Raf is a wide basin of collapse, formed by a subsidence followed by an alluvial and recent sedimentation. It is affected by folding and faults in NW-SE and SSW-NNE directions. Sedimentary series extend from Miocene to Quaternary. The lithological description of these sediments [28–30] reveals that the Miocene is represented by the Kechabta and Wadi Bel Khedim formations. The Kechabta formation has a thickness of about 1000 m and consists of alternation of marls and fine sandstone benches. The Wadi Bel Khedim formation is of 250 m thickness. At the east of Raf Raf, it is composed of large outcrops of gray marls with gypsum benches. The Quaternary series unconformably overlie the Miocene series and is divided into seven units (from bottom to the top qm1, Aa, qm2, Qpa, Qp-t, D and a).
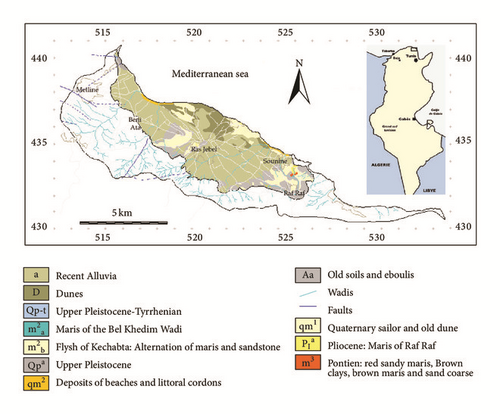
Hydrologically, the Quaternary series and the current formations, characterized by their extension and their good permeability, host the shallow aquifer of Ras Jbel. This aquifer is recharged by local infiltration on the plain, by water flowing from the surrounding hills, and from the different rivers crossing the plain: Wadi Beni Ata and Wadi Ali in Beni Ata region, Wadi El Kantra, El Blaat, and El Ma in Ras Jbel region, Wadi Sandid draining the zone of Raf Raf and Wadi El Kantra in the region of Dar El Khaddar. Pumping tests showed that transmissivity can reach 15.10−4 m2/s. The most transmissive areas are the low alluvial plain of Bahirat Beni Ata, the low alluvial area of Wadi El Krib and El Aouinet, and the upstream area of Ain Cherchar, Ain Ezzaouia, Ain Kassa, and Ain El Hammam, as well as the sandstone dune of Ain El Mestir and Ain Mahloul.
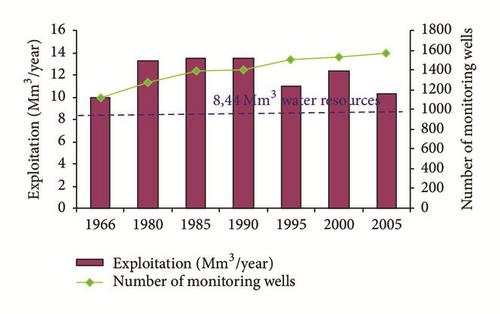
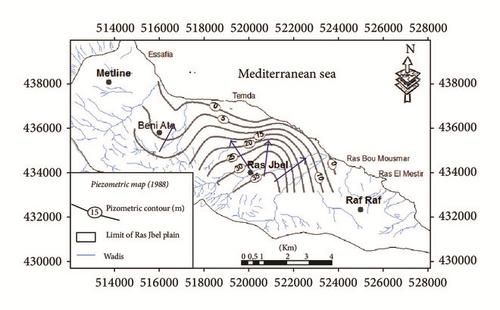
The shallow aquifer of Ras Jbel is affected by natural and anthropogenic factors like evaporation, irrigation, pumping, and so forth. The aquifer is tapped by several private and state owned wells. In the period between 1985 and 1990, the exploitation rate was estimated at 13,5 Mm3/year, which exceeded the renewable resources evaluated at 8,44 Mm3/year [31]. The total number of dug wells has been estimated to be 1387 in 1985, 1396 in 1990, and 1563 in 2005. In 2005, the exploitation rate was estimated at 10,27 Mm3/year (Figure 3). The massive exploitation of aquifer resources in response to the heavy pumping caused a drop in the water level (Figure 4) and the deterioration of water quality. In 1949, the salinity of the groundwater varied between 648 and 1692 mg/l [32]. The investigations carried out by the DGRE between 1985 and 1993 through several monitoring wells revealed the existence of a very saline groundwater. The degradation of the water quality has been detected mainly in coastal areas where salt concentrations exceeded 15 g/l in 1985 and 8 g/l in 1993 and in the depression of Bahirat Beni Ata where the ante-quaternary substratum is below the sea level [21].
3. Methods
3.1. Water Sampling and Chemical Analysis
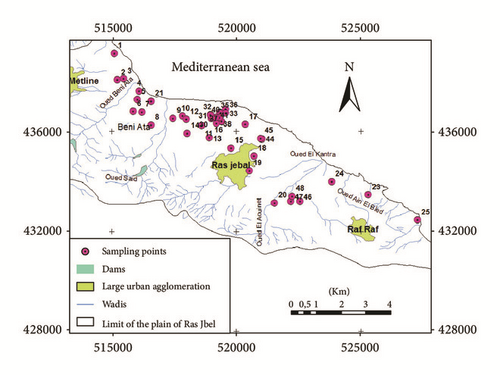
Ninety-four samples (including pumping wells and piezometers) were collected for geochemical analysis (major elements) and isotopes (δ2H, δ18O) during the wet and the dry season of March and July 2007 (Figure 5). Sampling locations were recorded using a potable GPS device. Prior to sampling, all wells were pumped for several minutes to eliminate the influence from stagnant water. Samples were collected in cleaned polyethylene bottles, tightly capped and stored at 4°C until analysis. Electrical conductivity (EC), salinity, and pH were measured in the field using a portable conductivity, salinity, and pH meter.
Chemical analyses were done using a Varian 730-ES ICP Optical Emission Spectrometer for cations and using ion chromatography (DX-120, Dionex, USA) for anions. was measured by titration (Hach, USA). Samples for stable isotope analysis were collected according to the procedures described by Clark and Fritz [33]. Isotopic analyses were conducted in the isotopic laboratory of the department of Hydrology and Geo-environmental Sciences of the Faculty of Earth and Live Sciences of the Free University of Amsterdam. Isotopic ratios are expressed in per mil (δ) and oxygen and hydrogen isotope analyses were reported to d notation relative to Vienna Standard Mean Oceanic Water (V-SMOW), where d = [(Rs/RVSMOW) − 1] × 1000, Rs represents either the 18O/16O or the 2H/1H ratio of the sample, and RSMOW is 18O/16O or the 2H/1H ratio of the SMOW. Typical precisions are ±0.1 and ±1% for oxygen-18 and deuterium, respectively.
3.2. Statistical Analysis
The physicochemical parameters and chemical composition of the groundwater samples are presented in Table 1. All the acquired data were integrated into hydrogeochemical database in order to study the groundwater quality and to identify the groundwater salinization processes that contributed to the acquisition of the actual chemical composition.
| Well | EC | pH | TDS | Ca2+ | Mg2+ | Na+ | K+ | Cl− |
|
|
EC | pH | TDS | Ca2+ | Mg2+ | Na+ | K+ | Cl− |
|
|
|---|---|---|---|---|---|---|---|---|---|---|---|---|---|---|---|---|---|---|---|---|
| Wet season | Dry season | |||||||||||||||||||
| 1 | 3670 | 7,41 | 2369 | 225 | 89 | 443 | 10 | 999 | 298 | 305 | 5430 | 7,2 | 3630 | 299 | 140 | 757 | 12 | 1792 | 343 | 287 |
| 2 | 3990 | 7,05 | 2519 | 447 | 57 | 413 | 4 | 1022 | 307 | 270 | 3760 | 7,21 | 2446 | 447 | 58 | 376 | 1 | 989 | 326 | 250 |
| 3 | 3840 | 6,8 | 2649 | 442 | 54 | 425 | 11 | 997 | 384 | 338 | 3480 | 7,05 | 2451 | 421 | 48 | 392 | 9 | 918 | 356 | 308 |
| 4 | 4120 | 7,1 | 3166 | 368 | 72 | 647 | 5 | 1021 | 742 | 311 | 3900 | 7,2 | 2612 | 327 | 63 | 506 | 2 | 789 | 626 | 299 |
| 5 | 6300 | 6,9 | 4110 | 520 | 89 | 738 | 7 | 1390 | 1005 | 361 | 5530 | 7,06 | 4323 | 501 | 94 | 731 | 4 | 1599 | 1040 | 354 |
| 6 | 5080 | 6,95 | 3345 | 403 | 81 | 666 | 8 | 1160 | 661 | 366 | 3850 | 7,15 | 2832 | 363 | 66 | 499 | 5 | 953 | 598 | 348 |
| 7 | 5790 | 6,9 | 3630 | 560 | 115 | 550 | 4 | 1457 | 635 | 309 | 4740 | 7 | 3231 | 523 | 103 | 471 | 3 | 1181 | 633 | 317 |
| 8 | 3730 | 6,9 | 2306 | 286 | 115 | 284 | 20 | 895 | 377 | 329 | 3560 | 7,11 | 2407 | 353 | 135 | 294 | 12 | 876 | 421 | 317 |
| 9 | 5660 | 7,03 | 3800 | 368 | 129 | 881 | 11 | 1487 | 563 | 361 | 4660 | 7,16 | 3126 | 339 | 96 | 609 | 7 | 1248 | 498 | 329 |
| 10 | 3530 | 7,3 | 2384 | 249 | 59 | 388 | 25 | 788 | 589 | 287 | 2840 | 7,63 | 1989 | 258 | 46 | 347 | 20 | 610 | 489 | 220 |
| 11 | 4480 | 7,12 | 3260 | 379 | 72 | 646 | 18 | 989 | 820 | 337 | 3650 | 7,19 | 2674 | 334 | 59 | 500 | 13 | 774 | 683 | 311 |
| 12 | 3250 | 7 | 2142 | 230 | 55 | 346 | 37 | 705 | 477 | 293 | 3160 | 7,35 | 2360 | 285 | 55 | 434 | 37 | 720 | 543 | 287 |
| 13 | 2770 | 7 | 1658 | 216 | 45 | 264 | 31 | 474 | 352 | 277 | 2540 | 7,35 | 1710 | 243 | 41 | 262 | 29 | 487 | 380 | 268 |
| 14 | 2480 | 7,65 | 1972 | 278 | 46 | 337 | 24 | 659 | 382 | 246 | 2860 | 7,49 | 2040 | 263 | 50 | 343 | 23 | 662 | 462 | 238 |
| 15 | 6250 | 7,96 | 4089 | 466 | 86 | 857 | 96 | 1463 | 811 | 310 | 4230 | 7,35 | 3049 | 353 | 71 | 605 | 26 | 866 | 684 | 445 |
| 16 | 4190 | 7,6 | 2480 | 258 | 78 | 444 | 22 | 830 | 619 | 231 | 3520 | 7,38 | 2392 | 276 | 70 | 421 | 19 | 766 | 598 | 244 |
| 17 | 3990 | 7,5 | 2715 | 274 | 49 | 550 | 107 | 775 | 460 | 500 | 3290 | 7,7 | 2497 | 280 | 50 | 426 | 80 | 652 | 413 | 598 |
| 18 | 2920 | 7,2 | 2046 | 221 | 56 | 330 | 79 | 472 | 444 | 445 | 2240 | 7,29 | 1841 | 199 | 45 | 289 | 75 | 444 | 363 | 427 |
| 19 | 2730 | 7,75 | 1817 | 236 | 54 | 285 | 25 | 451 | 382 | 381 | 2250 | 7,3 | 1680 | 215 | 46 | 256 | 31 | 427 | 395 | 311 |
| 20 | 4020 | 7,23 | 2747 | 208 | 131 | 525 | 6 | 1011 | 481 | 386 | 3360 | 7,33 | 2389 | 206 | 124 | 410 | 3 | 872 | 384 | 390 |
| 21 | 1240 | 7,78 | 819 | 48 | 36 | 165 | 7 | 289 | 102 | 173 | 2120 | 7,55 | 1317 | 104 | 57 | 270 | 5 | 639 | 108 | 134 |
| 22 | 3280 | 7,05 | 2358 | 258 | 55 | 377 | 35 | 844 | 515 | 275 | 2910 | 7,65 | 1835 | 230 | 42 | 338 | 32 | 589 | 366 | 238 |
| 23 | 1573 | 7,68 | 924 | 84 | 19 | 200 | 6 | 276 | 89 | 250 | 1131 | 7,82 | 783 | 73 | 12 | 182 | 3 | 217 | 88 | 207 |
| 24 | 5170 | 7,15 | 2891 | 505 | 75 | 510 | 8 | 1185 | 407 | 201 | 4060 | 7,05 | 2697 | 490 | 67 | 433 | 5 | 1066 | 436 | 201 |
| 25 | 4610 | 7,3 | 2910 | 189 | 113 | 576 | 7 | 916 | 652 | 458 | 3880 | 7,33 | 2889 | 211 | 123 | 590 | 4 | 878 | 650 | 433 |
| 26 | 5050 | 7,3 | 2330 | 7,33 | 1666 | 216 | 55 | 270 | 12 | 464 | 264 | 387 | ||||||||
| 27 | 3400 | 7,55 | 1938 | 255 | 65 | 287 | 27 | 594 | 415 | 296 | 2720 | 7,33 | 1928 | 257 | 62 | 312 | 35 | 568 | 371 | 323 |
| 28 | 3160 | 7,6 | 1662 | 178 | 48 | 289 | 87 | 478 | 356 | 226 | 2520 | 7,39 | 1910 | 279 | 57 | 280 | 16 | 593 | 393 | 293 |
| 29 | 2950 | 7,89 | 2176 | 187 | 66 | 419 | 6 | 713 | 587 | 198 | ||||||||||
| 30 | 3580 | 7,2 | 2353 | 199 | 80 | 437 | 11 | 819 | 613 | 195 | 3240 | 7,5 | 2217 | 205 | 72 | 427 | 11 | 732 | 582 | 189 |
| 31 | 3090 | 7,5 | 2187 | 225 | 71 | 394 | 10 | 710 | 560 | 217 | 3240 | 7,54 | 2330 | 228 | 68 | 424 | 7 | 766 | 637 | 201 |
| 32 | 3490 | 7,6 | 2317 | 231 | 69 | 479 | 10 | 749 | 560 | 221 | 3830 | 7,35 | 2804 | 269 | 80 | 572 | 7 | 866 | 723 | 287 |
| 33 | 4290 | 7,1 | 2886 | 358 | 70 | 404 | 20 | 954 | 729 | 351 | 5080 | 7,75 | 3608 | 454 | 90 | 654 | 23 | 1107 | 884 | 397 |
| 34 | 3640 | 7,25 | 2648 | 292 | 66 | 520 | 15 | 851 | 591 | 315 | 3410 | 7,35 | 2429 | 305 | 67 | 401 | 12 | 764 | 575 | 305 |
| 35 | 3860 | 7,25 | 2836 | 326 | 81 | 550 | 27 | 874 | 634 | 344 | 3420 | 7,51 | 2487 | 304 | 71 | 455 | 14 | 756 | 571 | 317 |
| 36 | 4820 | 7,95 | 3253 | 398 | 81 | 472 | 36 | 1084 | 789 | 393 | 4110 | 7,43 | 3015 | 348 | 74 | 539 | 38 | 922 | 729 | 366 |
| 37 | 3740 | 7,45 | 2390 | 230 | 78 | 412 | 17 | 829 | 607 | 218 | 3320 | 7,32 | 2441 | 265 | 70 | 474 | 16 | 757 | 609 | 250 |
| 38 | 2720 | 7,7 | 1881 | 197 | 55 | 332 | 9 | 591 | 465 | 232 | 3650 | 7,5 | 2628 | 292 | 71 | 491 | 6 | 821 | 654 | 293 |
| 39 | 2080 | 7,7 | 1378 | 169 | 32 | 251 | 11 | 470 | 336 | 110 | 1817 | 7,49 | 1269 | 158 | 30 | 213 | 8 | 391 | 319 | 153 |
| 40 | 3540 | 7,4 | 2454 | 231 | 75 | 419 | 8 | 823 | 620 | 278 | 3770 | 7,19 | 2727 | 273 | 81 | 489 | 7 | 865 | 696 | 317 |
| 41 | 5030 | 7,1 | 3010 | 402 | 81 | 456 | 14 | 1166 | 689 | 201 | 3130 | 7,67 | 2233 | 232 | 68 | 431 | 7 | 734 | 578 | 183 |
| 42 | 2820 | 7,93 | 2061 | 179 | 65 | 371 | 6 | 683 | 580 | 177 | ||||||||||
| 44 | 2980 | 7,12 | 1817 | 236 | 43 | 324 | 78 | 531 | 337 | 270 | 2090 | 7,52 | 1694 | 198 | 42 | 234 | 64 | 502 | 355 | 299 |
| 45 | 2670 | 7,1 | 1694 | 215 | 43 | 277 | 69 | 493 | 316 | 281 | 2130 | 7,4 | 1553 | 203 | 40 | 258 | 67 | 437 | 294 | 256 |
| 46 | 2840 | 7,4 | 1741 | 200 | 55 | 267 | 9 | 555 | 375 | 281 | 3050 | 7,3 | 2277 | 285 | 69 | 390 | 3 | 770 | 516 | 244 |
| 47 | 3310 | 7,05 | 1749 | 300 | 59 | 217 | 3 | 680 | 233 | 256 | 3170 | 7,3 | 2257 | 389 | 57 | 249 | 2 | 807 | 522 | 232 |
| 48 | 4990 | 7,06 | 2856 | 555 | 82 | 400 | 5 | 1210 | 355 | 250 | 4120 | 7,1 | 2601 | 560 | 73 | 327 | 2 | 1084 | 372 | 183 |
- EC (μs/cm); TDS, Ca2+, Mg2+, Na+, K+, Cl−, , (mg/l).
Piper plots [34], considered as the common method for a multiple analyses on the same graph, are used to represent the different water samples and to distinguish graphically between different water types defined by the Stuyfzand classification (1993). Sample points with similar hydrochemistry tend to cluster together in the diagram [35].
Principal component analysis method (PCA) and correlations are a popular method to assess groundwater quality. One of the principle advantages of multivariate techniques such as principal component analysis (PCA) is that they are able to rapidly reveal relationships between a large number of variables. In this study, PCA and correlations are used to identify the possible sources of major ions in groundwater, hydrogeological reactions that may occur in the study area, and dominant factors that control groundwater quality.
Gibbs diagrams which are a simple plot of the TDS versus the weight ratio of Na+/(Na+ + Ca2+) or are widely used to establish the relationships between the water composition and the lithological characteristics of the aquifer [36]. Three distinct fields, including precipitation dominance, evaporation dominance, and rock weathering dominance, constitute the segments in the Gibbs diagram.
4. Results and Discussion
4.1. Hydrogeochemical Characterization
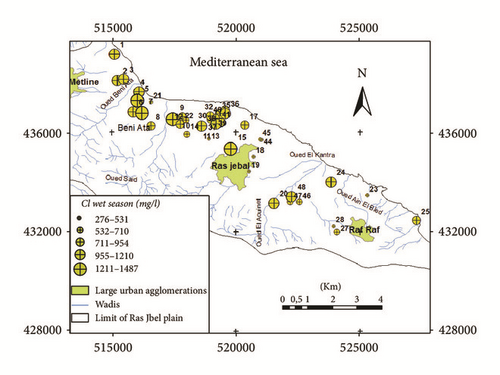
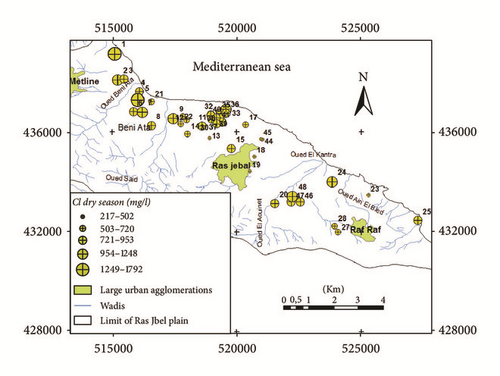
Groundwater quality depends on various chemical constituents and their concentrations, which are mostly derived from the geological stratum of the particular region [6]. The pH was one of the primary indicators of the water chemistry evolution. The aquifer groundwater was neutral to slightly alkaline water, with a mean pH value of 7,23 and 7,15 in the wet and dry season, respectively. Electrical conductivity (EC) of the water samples was medium to high, suggestive of very highly mineralized waters. EC values ranged between 1240 and 6300 μS/cm in the wet season and between 1131 and 5430 μS/cm in the dry season. A problem to the water supply development in the area is the increasing electrical conductivity (EC) values of near-coastal shallow groundwater. The high EC of groundwater from wells located along the coast and in Bahirat Beni Ata can be explained by the seawater intrusion effect caused by the groundwater level drawdown due to overexploitation (Figures 6(a) and 6(b)).
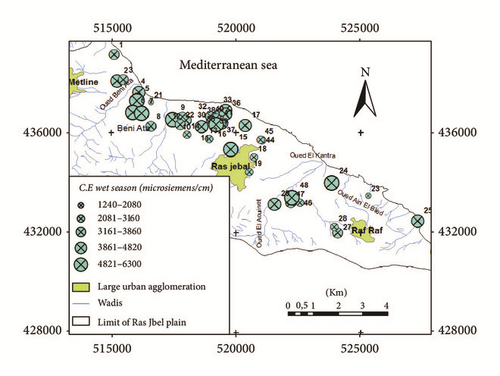
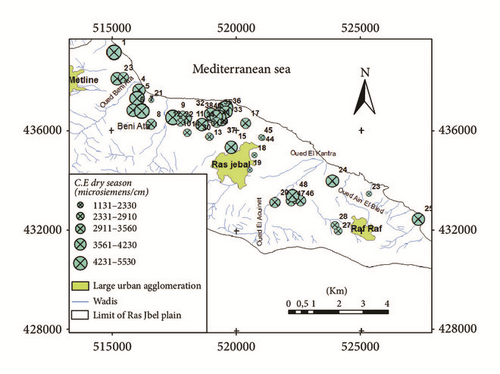
Based on the conductivity values, the groundwater system could be classified into four groups: fresh water (<500 μS/cm), marginal water (500–1,500 μS/cm), brackish water (1,500–5,000 μS/cm), and saline water (>5,000 μS/cm). Based on our conductivity values it is evident that groundwater in Ras Jbel aquifer is in marginal and brackish waters. Few samples are of saline water type.
The study area is characterized by a wide range of salinities. Salinity values ranged between 500 and 3600 mg/l in the wet season and between 500 and 3500 mg/l in the dry season. The higher values of EC and salinity are indicators of higher ionic concentrations, probably due to the high anthropogenic activities in the region and geological weathering conditions but also due to the intrusion of sea water into the groundwater system.
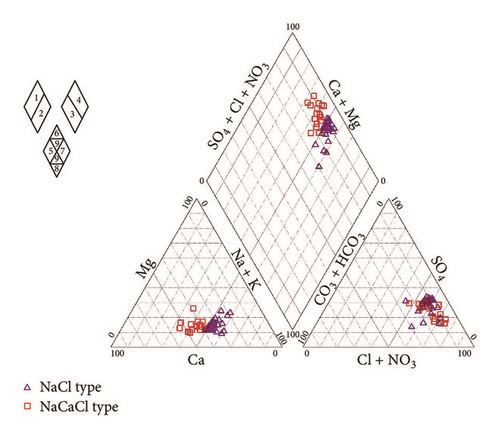
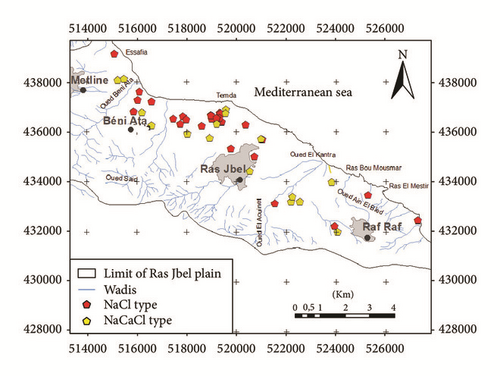
The relative content of a cation or an anion is defined as the percentage of the relative amount of that ion to the total cations or anions, respectively [39]. In the study area, the strong acid anions (Cl− and ) exceed weak acid anions ( and ). On the other hand, sodium and calcium concentrations exceed magnesium and potassium contents. The triangular diagram (Figure 7) shows that the groundwater chemistry was mainly characterized by two groups. The first group was Cl−–Na+ type, in which Na+ accounted for more than 52–65% of the total cations; the second group was Cl−–Na+/Ca2+ type, in which Na+ and Ca2+ accounted for 37–48% and 36–53% of the total cations, respectively. Chemical facies in the phreatic aquifer of Ras Jbel seem to be directly related to the configuration of the ante-quaternary substratum and the proximity of several sampled wells from the sea.
The Na–Cl-type indicated the presence of high chloride concentrations in the aquifer which may originate from the dissolution of halite, influx of sewage or waste water, and mainly intrusion of sea water [40]. In the downstream part of the plain near the sea and in Bahirat Beni Ata, where a marine intrusion was detected since 1980, the groundwater is mainly of Cl−–Na+ type (Figure 8). The distribution maps of Cl− in both wet and dry seasons (Figures 9(a) and 9(b)) are well correlated with those of electrical conductivity and facies.
4.2. Processes Controlling Groundwater Salinization
Understanding the water salinization mechanism is the basis for regional salt management. Groundwater salinization is largely a function of the mineral composition of the aquifer through which it flows and hydrogeochemical processes such as mineral dissolution, precipitation, evaporation and transpiration, ion exchange, and the residence time along the flow path. It is also linked to various anthropogenic activities such as agriculture, overexploitation of groundwater resources, and sewage disposal.
4.2.1. Water-Rock Interaction and Origin of Groundwater Mineralization
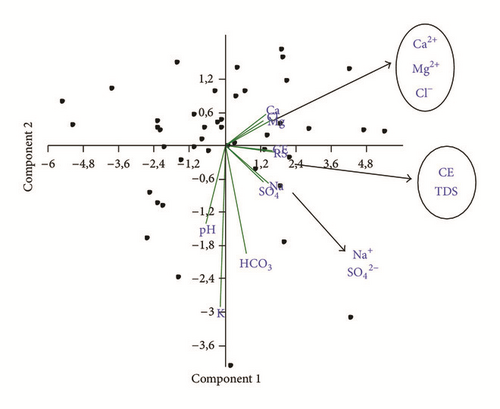
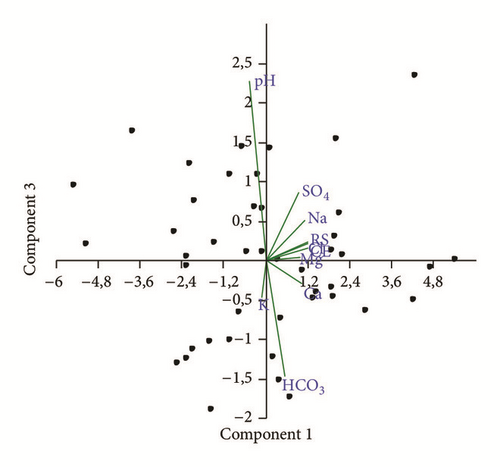
Reactions between groundwater and aquifer minerals have a significant role on water quality. The p × p correlation matrix, revealing the existence of bivariate linear correlations between variables, allows a better understanding of the dominant water-rock interactions or source of the ions over the study area. Additionally, the use of multivariate statistics in hydr(geo)logical studies is a very common practice and numerous applications can be found in the literature ([10, 19, 41]) though most hydrologists consider that values larger than 0.5 indicate significant correlation. In the present study, PCA was carried out for 10 parameters (Ca, Mg, Na, K, HCO3, SO4, Cl, pH, TDS, and EC) and more than 90 observations (Tables 2 and 3). The first two factors F1 and F2 were always retained, explaining about 73% of the total variance (Table 2). Factors of a higher order generally explained the variance of a single parameter or established poorer and less significant correlations with two parameters [42].
| F1 | F2 | F3 | |
|---|---|---|---|
| CE | 0,97 | −0,03 | 0,05 |
| TDS | 0,98 | −0,04 | 0,08 |
| pH | −0,41 | −0,42 | 0,75 |
| Ca2+ | 0,82 | 0,17 | −0,10 |
| Mg2+ | 0,78 | 0,13 | 0,02 |
| Na+ | 0,89 | −0,20 | 0,17 |
| K+ | −0,11 | −0,86 | −0,16 |
| Cl− | 0,96 | 0,14 | 0,07 |
|
|
0,77 | −0,20 | 0,28 |
|
|
0,43 | −0,57 | −0,49 |
| Eigenvalue | 5,86 | 1,40 | 0,95 |
| % Explication | 58,64 | 14 | 9,53 |
| % Cumulative | 58,64 | 72,64 | 82,17 |
- Bold values: loadings ≥ 0.5.
| CE | TDS | pH | Ca2+ | Mg2+ | Na+ | K+ | Cl− |
|
|
|
|---|---|---|---|---|---|---|---|---|---|---|
| CE | 1 | |||||||||
| TDS | 0,98 | 1 | ||||||||
| pH | −0,34 | −0,32 | 1 | |||||||
| Ca2+ | 0,84 | 0,83 | −0,44 | 1 | ||||||
| Mg2+ | 0,73 | 0,73 | −0,30 | 0,43 | 1 | |||||
| Na+ | 0,84 | 0,87 | −0,18 | 0,60 | 0,65 | 1 | ||||
| K+ | −0,04 | −0,05 | 0,23 | −0,11 | −0,28 | 0,01 | 1 | |||
| Cl− | 0,95 | 0,96 | −0,37 | 0,84 | 0,76 | 0,84 | −0,19 | 1 | ||
|
|
0,73 | 0,76 | −0,12 | 0,50 | 0,52 | 0,75 | −0,02 | 0,65 | 1 | |
|
|
0,36 | 0,37 | −0,20 | 0,20 | 0,37 | 0,42 | 0,30 | 0,27 | 0,32 | 1 |
The correlations established between the TDS and concentrations of major elements (Table 3) show that the TDS is well correlated with the concentrations of chloride (r2 = 0,96), sodium (r2 = 0,87), calcium (r2 = 0,83), magnesium (r2 = 0,73), and sulphates (r2 = 0,76). The high correlation of TDS with chloride, sodium, magnesium, sulphate, and calcium indicated that these elements are mostly contributed by mineralization. These ions have been dissolved into groundwater continuously and resulted in the rise of TDS. The contribution of carbonates and potassium is negligible (r2 = 0,37 and r2 = −0,05, resp.). The low correlation between TDS and pH suggests that the dissolution of the salts is not related to acidic conditions of groundwater but it is related to their degrees of solubility. and pH apparently have little association with the other variables.
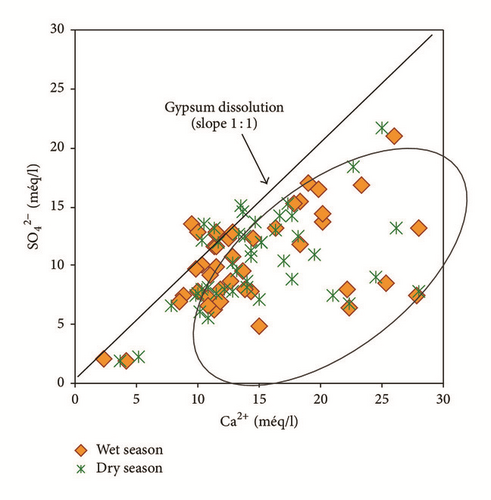
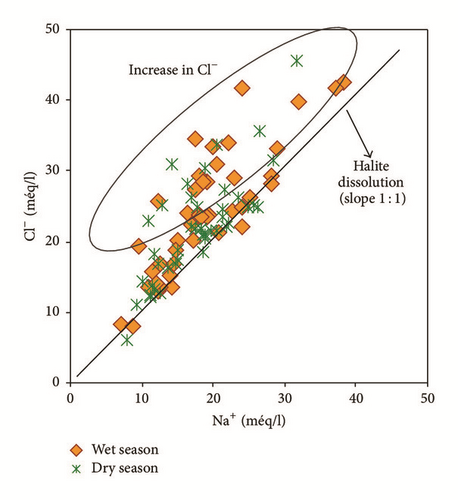
Bicarbonates are not correlated to calcium r(HCO3Ca) = 0,20 indicating another source other than the calcite dissolution. However, considerable correlation coefficients between sodium and chlorides r(NaCl) = 0,84 and between calcium and sulphates r(CaSO4) = 0,50 suggest halite and gypsum dissolution, respectively.
The first factor F1 accounts for 58% of the total variance, and it is contributed by the following variables: EC, TDS, Mg, Ca, Na, Cl, and SO4. This factor is associated with the salinity component (NaCl salt source with Ca and SO4 enrichment) and the cation exchange. The second factor F2 accounts for 14% of the total variance, and it is negatively determined by K and HCO3 (Figure 10). It suggests carbonates weathering and pollution by fertilizer application.
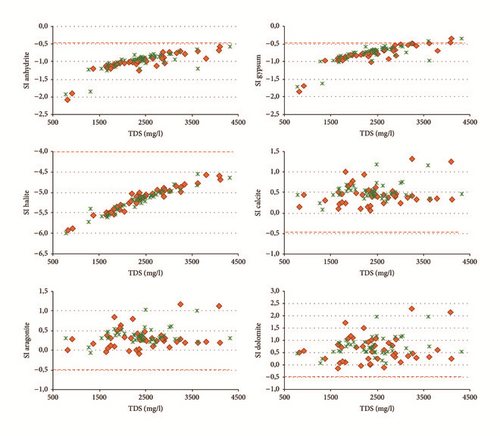
In order to understand the origin of groundwater mineralization in Ras Jbel plain, the saturation index (SI) was calculated. The mineral facies are chosen based on the analysis result of groundwater quality, the main components of groundwater, and the occurrences conditions ([6, 43, 44]). In the study area, the main cations are Na+, Ca2+, and Mg2+ and the main anions are , , and Cl−; thus gypsum, anhydrite, calcite, dolomite, aragonite, and halite are chosen to be the mineral facies.
-
Calcite:
(2) -
Dolomite:
(3)
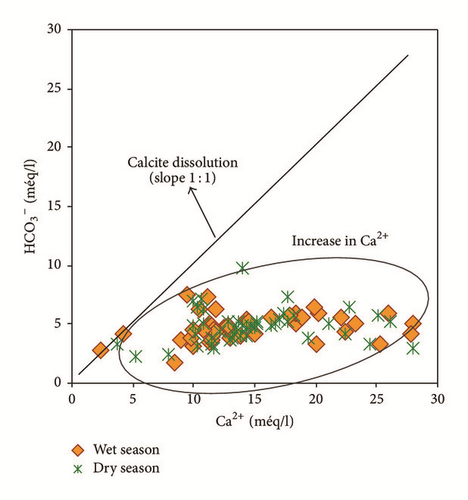
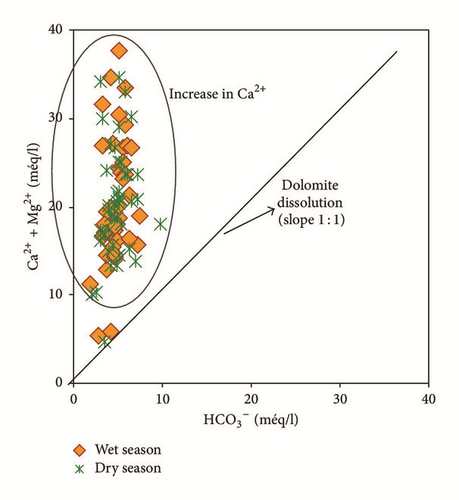
Water samples were plotted in the Gibbs diagrams, which takes into account the major role of natural mechanisms (rock weathering, evaporation, and precipitation). Figure 13 clearly shows that the mechanism controlling water chemistry seems to be a combination of the weathering of carbonates minerals as well as the evaporation-precipitation processes. However, low rates of the groundwater samples were obtained in areas that were dominated by rock-water interactions.
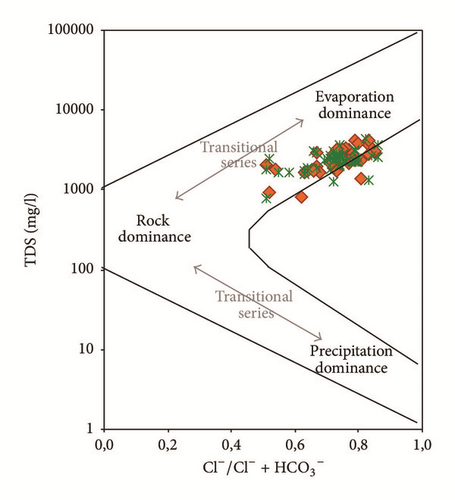
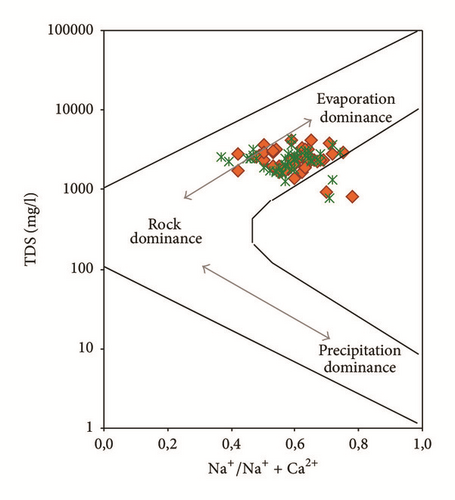
Samples with Na+/(Na+ + Ca2+) or Cl−/(Cl− + ) ratios greater than 0,5 and TDS levels between 783 and 4323 mg/l showed that the groundwater chemistry was controlled mainly by the saline water mixing or evaporation. Evaporation results in increased TDS in relation to high ratios of dominant cations and anions and CaCO3 precipitates by losing Ca2+ and .
4.2.2. Ionic Exchange Processes and Freshwater-Saline Water Mixing
Ion exchange is one of the important natural processes responsible for the concentration of ions in groundwater and has significant impact on the evolution of groundwater chemistry [18]. The dominance of salty groundwater dominated by sodium and chloride ions in Ras Jbel shallow aquifer provides evidence of mixing with an external salinity source, which could be the seawater from the coastal part of the aquifer. Cation exchange, responsible for the salinity signature, is described by two mixing mechanisms (freshening and saline water intrusion). Equations (6) and (7) show the gain or loss related to Na+ and (Ca2+ + Mg2+) within the exchanger X.
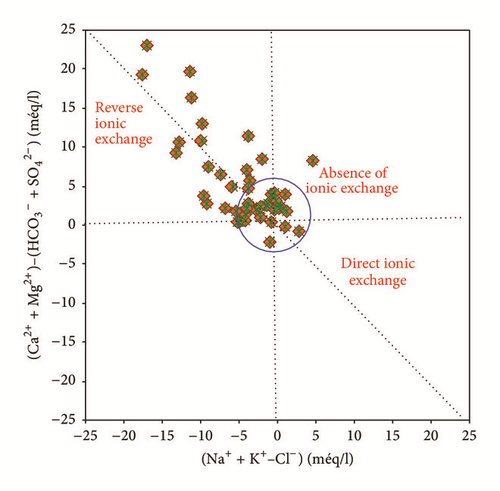
Water samples concentrated in the origin of the plot versus (Na+–Cl−) indicated the absence of the ion exchange process which can be attributed to the evaporation process followed by carbonate precipitation [49]. This result confirmed the results obtained using saturation states of minerals and Gibbs diagrams.
The rate of mixture varies from 0,32% (well n°23) in the north of the Raf Raf region and where the configuration of the ante-quaternary substratum prevents the marine intrusion to 13% (well n°1) near the shoreline (close to the coast). The highest value of the mixing fraction corresponds to the highest measured values of Cl− and EC (1792 mg/l and 5430 μS/cm, resp.).
4.3. Isotopes and Groundwater Origin
The stable isotope ratios of oxygen and hydrogen in the groundwater are useful tools to differentiate between salinity origins [52, 53] and to help us understand various sources of recharge processes to groundwater because they are sensitive to physical processes such as atmospheric circulation, groundwater mixing, and evaporation ([33, 54]).
In arid and semiarid regions evaporation could be an important process influencing groundwater chemistry [19]. To understand the relationship between isotopic composition of groundwater of the shallow aquifer of Ras Jbel and those of precipitation measured at the station of Tunis Carthage situated at 50 km from the plain of Metline-Ras Jbel- Raf Raf, a bivariate diagram δ2H versus δ18O is plotted in Figure 15(a).
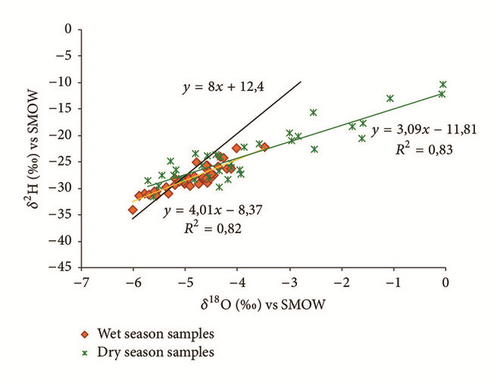
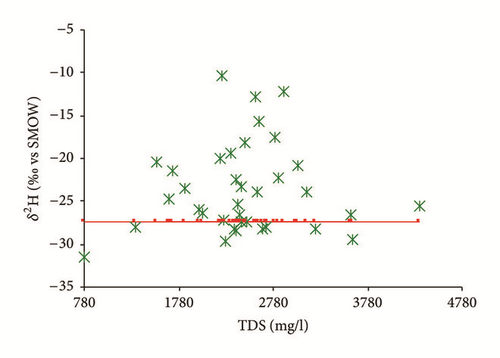
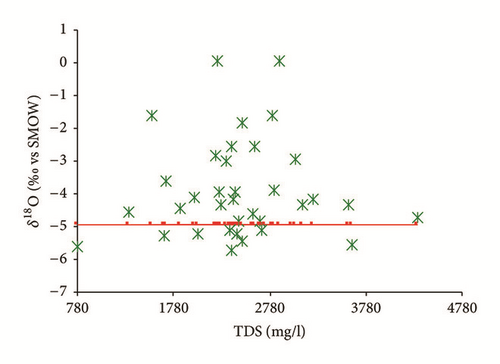
A local meteoric water line (LMWL) for Tunis Carthage was used to interpret the data in this study. The local meteoric water line (LMWL) is controlled by local hydrometeorological factors, including the origin of the vapor mass, reevaporation during rainfall, and the seasonality of precipitation [33]. The isotope composition of the precipitation was plotted along the LMWL using the following equation: δ2H (‰) = 8∗δ18O (‰) + 12,4 (which had a correlation coefficient R2 = 0,99) [55, 56].
Figure 15(a) shows that the isotopic composition of most of the groundwater samples collected in the wet season (except for sampling site number 35) lies within a narrow range, confirming that these groundwater samples had the same recharge source. Furthermore, all groundwater samples are scattered around the LMWL indicating that the recharge of the Ras Jbel shallow aquifer originates from infiltration of recent precipitation from Mediterranean vapor masses. Based on their isotopic composition, two groups of groundwater samples were identified (Table 4). The first group is relatively depleted in isotopic values and includes samples with δ18O and δ2H values ranging from −6,03 to −5,37‰ versus V-SMOW and from −33,94 to −29,66‰ versus V-SMOW, respectively. This may be explained by the fact that nonevaporated water is rapidly infiltrated to the saturated zone.
| Parameters | δ18O (‰ versus SMOW) | δ2H (‰ versus SMOW) | δ18O (‰ versus SMOW) | δ2H (‰ versus SMOW) |
|---|---|---|---|---|
| Wet season | Dry season | |||
| Minimum | −6,03 | −33,94 | −5,74 | −31,46 |
| Maximum | −3,5 | −22,15 | −0,06 | −10,31 |
| Average | −4,91 | −28,06 | −3,78 | −23,33 |
As per the second group, values vary from −5,35 to −3,50‰ versus V-SMOW and from −29,37 to −22,15‰ versus V-SMOW, for δ18O and δ2H, respectively. The relatively enriched isotopic values of the group 2 samples demonstrate that this groundwater is affected by evaporated open water or soil water.
The groundwater samples collected in the dry season were enriched compared to those collected in the wet season. The results show isotopic content ranging from −5,74 to −0,06‰ versus V-SMOW for δ18O and from −31,46 to −10,31‰ versus V-SMOW for δ2H. This may be explained by heavy isotope enrichment in the groundwater caused by strong evaporation given that there was effectively no precipitation in the study area between the two sampling periods; meanwhile, the groundwater may have been mainly recharged by lateral inflow from outside the study area, resulting in seasonal fluctuations in the isotopic values. The enriched groundwater samples (n°15, 20, 25, 30, 32, 35, 38, 41, 45, and 48) might be an indicator for evaporation of the recharge water before its infiltration to the aquifer.
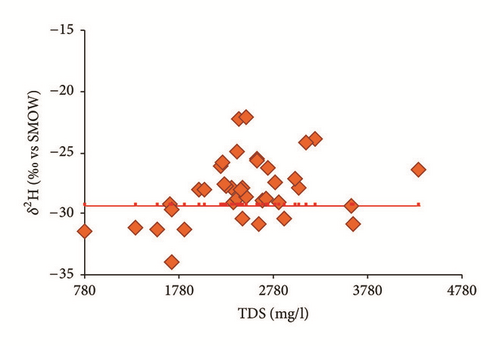
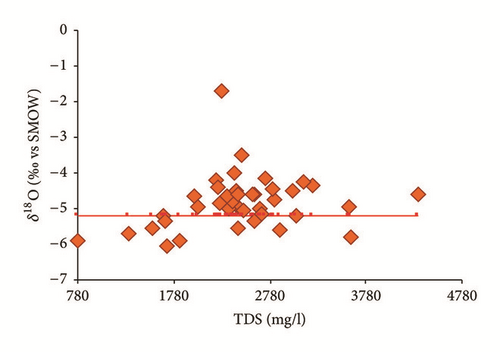
The isotopic data for the groundwater collected in the wet season were linearly fit using the regression equation δ2H (‰) = 4,01∗δ18O (‰) − 8,37 (R2 = 0,82). This regression line can be interpreted as the groundwater evaporation line (GEL). The gel has a δ2H/δ18O slope <8, which reflects evaporation during or after rainfall and/or mixing with an external water source (e.g., return of irrigation water) with high δ18O and δ2H values. Furthermore, the GEL of the wet season intersected the LMWL at values of δ18O = −5,22‰ versus V-SMOW and δ2H = −29,37‰ versus V-SMOW. These values are estimated as baseline for δ2H and δ18O in recharging rainfall (Figures 15(b) and 15(c)). If samples are plotted above the lines, significant groundwater evaporation process can be confirmed.
Additionally, the isotopic data from the dry season were linearly fit using the regression equation δ2H (‰) = 3,09∗δ18O (‰) − 11,81 (with a correlation coefficient R2 = 0,83). The GEL has a smaller slope than the LMWL, because evaporation tends to enrich heavy isotopes in water ([19, 57]). The increase in groundwater salinity due to evaporation can thus result in simultaneous increase in heavy isotopes ([19, 35]). The GEL of the dry season intersects the LMWL at values of δ18O = −4,93‰ versus V-SMOW and δ2H = −27,32‰ versus V-SMOW, which are chosen as baselines (Figures 15(d) and 15(e)). It is observed that 80% of the groundwater samples were plotted above the baselines and this demonstrates that evaporation has a significant contribution to groundwater salinity in the study area.
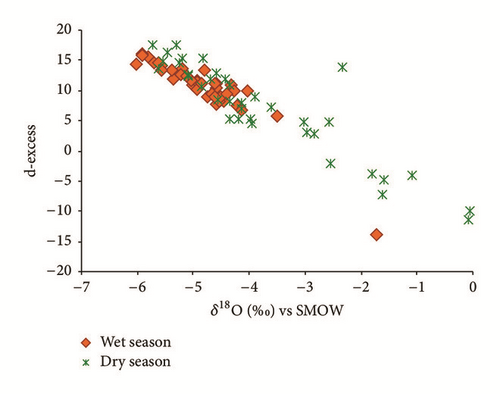
Furthermore, the deuterium excess calculated as d-excess = δ2H − 8δ18O [54] has been widely used in hydrological studies. The d-excess is used to identify secondary processes that influence the atmospheric vapor content in the evaporation–condensation cycle in nature ([54, 58]). The d-excess plotted against δ18O shows a negative correlation for the whole set of samples (Figure 16). The decrease in d-excess is an indication that evaporation has occurred during the recharge process which again confirms the previous results.
4.4. Irrigation Return Flow
Irrigation return flow is defined as the excess of irrigation water that is not evapotranspirated or evacuated by direct surface drainage and which returns to an aquifer or surface water [59, 60]. Irrigation return flows may induce salt and nitrate pollution of receiving water bodies [61]. Indeed, is the most common water contaminant, and pollution is increasing because the number of anthropogenic sources is increasing [26].
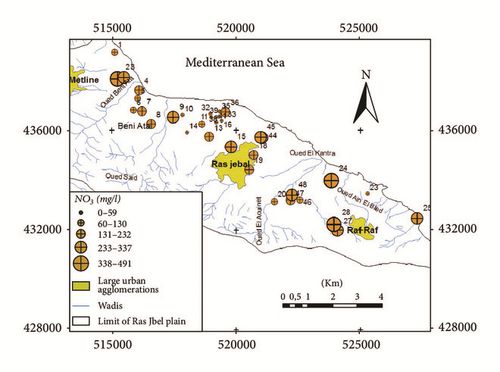
71% of groundwater samples are contaminated by nitrates where the concentration exceeds the permissible value of 50 mg/l set by WHO [62]. The spatial distribution of nitrates (Figure 17) shows that high nitrate contents are observed especially in the upstream of Ras Jbel aquifer. Groundwater contamination by nitrate is due to the intensive use of nitrogen fertilizers (Ca(NO3)2, KNO3, and MgSO4). In recent years, the agricultural land area in Ras Jbel plain has increased and copious amounts of nitrogenous fertilizer have been used, which have increased the groundwater concentrations.
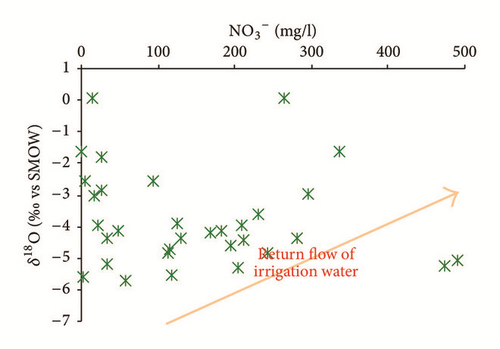
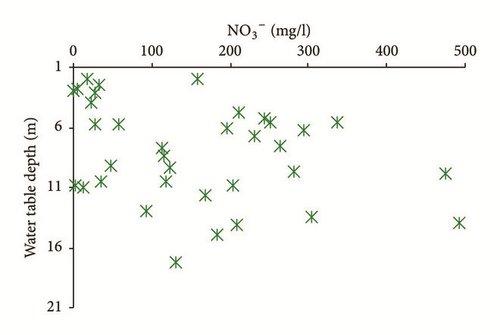
Furthermore, return flow from irrigation water also seems to contribute notably to the recharge process. Most of groundwater samples shows a correlation between NO3 and δ18O, reflecting the significant role of evaporated and contaminated irrigation water to the groundwater salinization (Figure 18(a)). Huge quantities of irrigation return flow elevated groundwater level, hence increasing evaporation and inducing salinization [63]. As highlighted in Figure 18(b), the contamination by return of irrigation water is observed in the shallower horizons (depth ≤ 13 m).
5. Conclusions
This paper aimed to discuss the origin, processes, and mechanisms of groundwater salinization, as well as the chemical evolution of groundwater in the Ras Jbel coastal aquifer using isotopic tools and hydrochemical tracers.
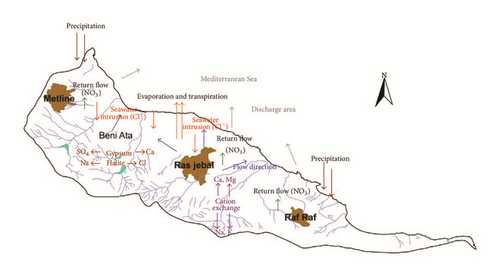
Most of the groundwater is considered to be of brackish to saline water and contains high ion concentrations. The groundwater in the study area is influenced by both natural and anthropogenic factors. The major geochemical processes controlling hydrochemical evolution are the inverse cationic exchange due to the phenomena of seawater intrusion, dissolution of evaporates minerals (halite, gypsum, and/or anhydrite), irrigation return flow, water-rock interactions, and evapo(transpi)ration. (Figure 19). The mixing rate among freshwater and saline water ranges between 1 and 13%.
In addition, groundwater in the shallow aquifer of Ras Jbel is also contaminated by agricultural fertilizers containing high amounts of nitrates. Nitrates are transported to the aquifer by natural recharge process and by return flow from irrigation water.
Hydrogen and oxygen-18 stable isotopes signatures of groundwater have identified recent groundwater recharge by infiltration of local precipitations. The enrichment in stable isotope of groundwater confirms that return flow of irrigation waters is an important factor influencing groundwater quality.
The results of this study can be used to improve our understanding of hydrogeochemical processes and enable the protection and sustainable use of water resources. It, therefore, calls for more comprehensive research for better water resources management.
Conflicts of Interest
The authors declare no conflicts of interest.
Acknowledgments
The authors would like to gratefully acknowledge all members of the Regional Commission for Agricultural Development of Bizerte for their guidance and support in field campaigns. Special thanks are due to Dr. Maarten Waterloo, Senior hydrologist, Acacia Water (Formerly Professor in Hydrology, Free University Amsterdam), Netherlands.


