Use of Vegetable Waste Extracts for Controlling Microstructure of CuO Nanoparticles: Green Synthesis, Characterization, and Photocatalytic Applications
Abstract
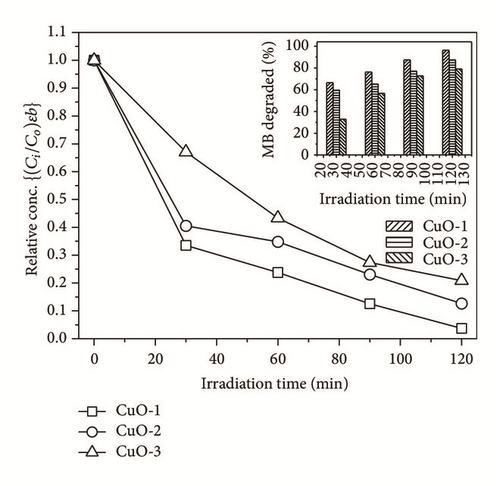
Chemical syntheses involve either hazardous reactants or byproducts which adversely affect the environment. It is, therefore, desirable to develop synthesis processes which either do not involve hazardous reactants or consume all the reactants giving no byproducts. We have synthesized CuO nanoparticles (NPs) adhering to some of the principles of green chemistry. The CuO NPs have been synthesized exploiting extracts of vegetable wastes, that is, Cauliflower waste and Potatoes and Peas peels. The extracts were aimed to work as capping agents to get control over the microstructure and morphology of the resulting CuO NPs. The green synthesized CuO NPs were characterized to explore the microstructure, morphology, optical bandgaps, and photocatalytic performances. XRD revealed that the CuO NPs of all the samples crystallized in a single crystal system, that is, monoclinic. However, the morphologies and the optical bandgaps energies varied as a function of the extract of vegetable waste. Similarly, the CuO NPs obtained through different extracts have shown different photocatalytic activities. The CuO NPs produced with extract of Cauliflower have shown high degradation of MB (96.28%) compared to obtained with Potatoes peels (87.37%) and Peas peels (79.11%).
1. Introduction
Cupric oxide (CuO) is one of the very attractive semiconducting materials having indirect narrow bandgap of 1.2 eV [1]. Owing to its many superior characteristics, for example, good thermal stability, electrical conductivity, and optical properties, CuO has found widespread applications in different fields like photocatalysis [2–4], superconductivity [5], solar energy harvesting [6], energy storage (lithium ion batteries) [7], and antimicrobial devices [8]. Moreover, the efficiency of CuO materials has been improved by nanostructuring their particle size. For this purpose different methods have been adopted and/or developed, which helped in getting CuO materials in diverse morphologies ([9] and references therein). Some of these classical methods are sol-gel, coprecipitation, electrochemical, solvothermal/hydrothermal, sonochemical, solid state synthesis, and microwave irradiation [9–14]. However, harmful chemicals are either used during manipulations or produced as byproducts in nearly all these methods. Consequently, synthesis of CuO by one of these methods poses serious threats to the environment.
To avoid the dangers posed by the use of harmful chemicals and/or produced as byproducts, green synthesis of NPs is gaining tremendous attention [15]. Besides, it is simple, nonexpensive, and environment friendly. CuO NPs have been prepared using different plants which influence the morphology of the resulting nanomaterial [16, 17]. In fact the plant extracts act as reducing and capping agents to direct the structure of the resulting NPs [15].
Following the principles of green chemistry, here we report upon the construction of CuO NPs by using extracts of different vegetables (Cauliflowers, Potatoes and Peas peels) wastes, and exploration of their microstructure, morphology, and optical properties. The resulting CuO NPs are employed for photocatalytic degradation of organic dye-Methylene Blue (MB).
2. Experimental
2.1. Materials and Methods
Copper(II) chloride dihydrate (CuCl2·2H2O) and Methylene Blue (MB) were used as received from Riedel-de Haën and Sigma-Aldrich, respectively. The vegetable wastes, that is, Cauliflower wastes, and Potato and Pea peels were collected from the local markets. Doubly distilled water was prepared in our own laboratory.
X-rays diffractograms (XRD) of the powder were recorded by diffractometer of PANalytical (X’pert-PRO). The diffractometer was equipped with Kα (1.542 Å) using Cu as source. The diffracted beams were detected by using X’celerator detector which was circling with step size of 0.0840 2θ and counting time of 180 sec. The vibrational spectra were collected by Thermo Electron Corporation FTIR spectrophotometer (Nicolet) using SMART ORBIT for working in ATR mode. Scanning electron microscope (SEM) of JEOL (JSM-5910) was used to capture the micrographs of the samples. Diffused reflectance spectra (DRS) were obtained by PerkinElmer Inc. UV-vis spectrophotometer (Model; Lambda 950). The photocatalytic degradation of MB dye was followed by UV-vis spectrophotometer of PerkinElmer Inc. (Model; Lambda 950).
2.2. Preparation of Vegetable Wastes Extracts Solutions
Extract solutions of the vegetable wastes, that is, Cauliflower (Brassica oleracea) and Potato (Solanum tuberosum) and Peas (Pisum sativum) peels, were prepared by a simple process. Firstly, the wastes were washed thoroughly with distilled water and then dried well. Secondly, 50 g of the well dried waste was efficiently grinded and then dispersed in 1000 mL distilled water. After thoroughly shaking for a specific time, the solution was filtered using filter paper (Whatman number 40) and the filtrate was collected.
2.3. Synthesis of CuO NPs
In a typical synthesis process, 0.01 M solutions of CuCl2·2H2O were prepared separately in distilled water. To these solutions were added the vegetable extracts solutions of Cauliflower, Potatoes, and Peas to get CuO NPs labeled as CuO-1, CuO-2, and CuO-3, respectively. The addition of extract solutions to the solutions of CuCl2·2H2O showed the formation of precipitates after keeping for 24 hours under constant shaking at 60°C in laboratory oven. The solution/suspensions were then allowed to cool to room temperature after taking outside of the oven. It was observed that the precipitates were completely settled down. The water as supernatant was decanted to get the powder which was washed repeatedly for five times with distilled water and then dried in oven at 80°C. The resulting dried powders were sintered at 500°C for 3 hours in open furnace to get CuO NPs.
2.4. Photocatalytic Degradation of MB
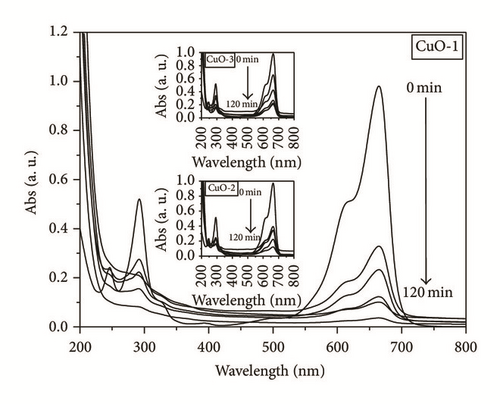
To perform the photocatalytic degradation of MB using the synthesized (different) CuO NPs as photocatalysts, a MB stock solution was prepared by dissolving 0.32 g of dye in 100 mL of distilled water. The dilutions to 1.0 × 10⁻⁵ M of MB stock solutions were obtained for the photocatalysis experiments. A simple but viable setup was used for performing the photocatalysis experiments. The setup consisted of a 100 mL Pyrex bottle placed in water bath to maintain the temperature at 25 ± 2°C and parallely positioned to the Pyrex bottle a high pressure Hg lamp having emission at 365 nm. To the diluted MB solution was added 0.02 g of the desired photocatalyst and the mixture was first sonicated for 5 min and then stirred in dark for 30 min to get the equilibrium between adsorption and desorption. Afterwards, the solution was irradiated and the decomposition of MB was followed by recording UV-vis spectrum of aliquot taken after 30 minutes. The decomposition experiments lasted for 120 min.
3. Results and Discussion
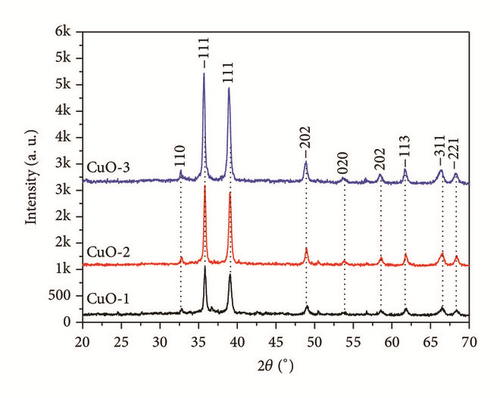
XRD patterns of CuO NPs samples CuO-1, CuO-2, and CuO-3 prepared from the solution containing extracts of wastes of Cauliflower, Potatoes, and Peas, respectively, are shown in Figure 1. There is no difference in the diffractograms of the three samples indicating that the CuO NPs are obtained in a single phase irrespective of the vegetable extract used. The peaks are indexed to monoclinic phase CuO by matching with powder diffraction file (PDF) 01-089-5899 in the ICDD using X’pert HighScore [18]. The resulting NPs are composed of CuO only, as the XRD patterns show no peaks other than those of monoclinic CuO. The crystallite size was determined using Scherrer formula, D = 0.94λ/βcosθ (where D, λ, β, and θ are the average crystallite size in nm, wavelength of the X-rays radiation used, full width at half-maximum (FWHM) of the peak(s), and angle of diffraction of X-rays, respectively). As shown in Table 1, the smallest crystallite size is obtained with Cauliflower extract (22.20 nm), followed by the Peas peels (24.70 nm), and the largest with potato peels (31.60 nm).
| Sample | FTIR frequency (cm−1) | XRD | Band gap (eV) | ||||
|---|---|---|---|---|---|---|---|
| ν(Cu–O) | ν(Cu–O) | ν(Cu–O) | ν(O–H) | Crystallite size (nm) | Lattice strain (%) | {F(R)} 1/2 | |
| CuO-1 | 432.18 | 536.21 | 574.79 | 3250 | 22.20 ± 1.53 | 0.377 ± 1.38 | 1.424 |
| CuO-2 | 445.56 | 549.71 | 588.17 | 3450 | 31.60 ± 2.18 | 0.264 ± 2.26 | 1.515 |
| CuO-3 | 447.37 | 551.64 | 590.22 | 3375 | 24.70 ± 1.92 | 0.340 ± 2.02 | 1.521 |

FTIR spectra of samples CuO-1, CuO-2, and CuO-3 showed a broad but very weak peak in the range of 3200 cm−1–3400 cm−1 which is corresponded to the O–H vibration of water molecules. This peak is due to the adsorbed water molecules upon the CuO surface. In the lower wavenumber region (<600 cm−1), three peaks are shown in spectrum of each sample (Table 1). These are the characteristics peaks of Cu–O bond vibrations in monoclinic phase [19]. The IR spectra confirms that the only phase formed in all the three sample is monoclinic CuO, and the formation of Cu2O is ruled out as no peak is observed in the IR spectra around 610 cm−1 which is its characteristic peak [20].
Figure 2 shows the SEM micrographs of CuO NPs samples CuO-1, CuO-2, and CuO-3. SEM image (Figure 2(a)) of CuO-1 shows irregular shaped particles which are nonuniform in size and shape. The construction indicates that the larger agglomerates are actually formed due to the autoorganization of smaller structures which may be formed of self-assembling NPs. The autoorganization of structures and self-assembling of NPs are viable as the extract of Cauliflower waste works as structure directing agent [15]. The self-assembled structures vary in size from 0.2 μm to 0.25 μm. The SEM images (Figure 2(b)) of sample CuO-2 synthesized using extract of Potatoes peels tell a different story. Dozens of micrometer (μm) long and few μm wide structures resembling long laths are shown in the SEM image of CuO-2 (Figure 2(b)). Due to the thin fibers pointing out at the end of the flat structures and the existence of individual fibers, it is assumed that the long boards like structures are formed of thin fibers having diameter of below hundred nanometers. The laths which are believed to be formed of the self-assembling of nanofibers have diameter in the range of 2.48 μm–4.36 μm and length in the range of 18.19 μm–31.95 μm. The SEM image (Figure 2c) of sample CuO-3 prepared using Peas peels extract show individual particles which self-organize to give megastructures. Contrary to the structures in CuO-1, the individual particles are cubic which seem to be formed of plates having diameter in nanometers (inset in Figure 2(c)). The average size of the self-assembled cubic structures is measured to 0.26 μm.

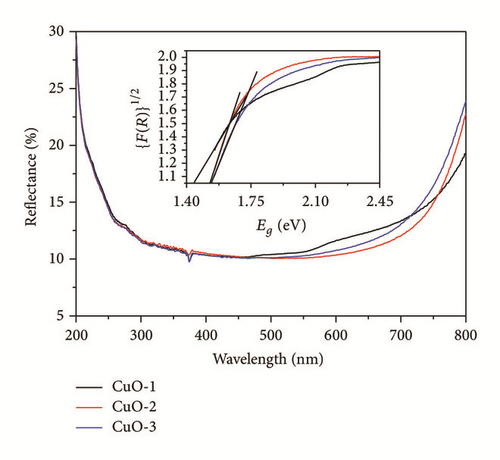
DRS spectra of samples CuO-1, CuO-2, and CuO-3 are measured to determine the bandgap energy (Eg) of each sample. The reflectance spectra are presented in Figure 3. The Eg is determined by extrapolating the modified Kubelka-Munk curves ({F(R)} 1/2 versus Eg) and the relevant data are presented in Table 1. The Eg values of all the three samples are larger by 0.244 eV to 0.321 eV than the Eg (1.2 eV) of bulk [1]. This could be corresponded to the scaling of particle size in nanodomain in this case. Furthermore, the Eg values of samples CuO-1, CuO-2, and CuO-3 correspond to the SEM data.


4. Conclusion
Using extracts obtained from the wastes of different vegetables, that is, Cauliflower, Potatoes, and Peas, as capping agents, CuO nanomaterials were prepared in different morphologies. However, the crystal phase was the same, that is, monoclinic CuO in all the three samples. Owing to the quantum confinements due to the nanostructuration, the CuO materials in all the samples have been obtained with larger Eg corresponding to the bulk (1.2 eV). The maximum degradation of 96.28% was achieved with sample CuO-1 owing to its comparatively low Eg and probably high surface area. The comparatively low degradation of MB by sample CuO-2 (87.37%) and CuO-3 (79.11%) corresponds to compact larger structures.
Competing Interests
The authors declare that they have no competing interests.


