On the Motion of Harmonically Excited Spring Pendulum in Elliptic Path Near Resonances
Abstract
The response of a nonlinear multidegrees of freedom (M-DOF) for a nature dynamical system represented by a spring pendulum which moves in an elliptic path is investigated. Lagrange’s equations are used in order to derive the governing equations of motion. One of the important perturbation techniques MS (multiple scales) is utilized to achieve the approximate analytical solutions of these equations and to identify the resonances of the system. Besides, the amplitude and the phase variables are renowned to study the steady-state solutions and to recognize their stability conditions. The time history for the attained solutions and the projections of the phase plane are presented to interpret the behavior of the dynamical system. The mentioned model is considered one of the important scientific applications like in instrumentation, addressing the oscillations occurring in sawing buildings and the most of various applications of pendulum dampers.
1. Introduction
Dynamical system is considered a collection of particles in motion with finite numbers of DOF and can be determined through some processes during a period of time. Chaos theory studies the behavior of dynamical systems that are oversensitive to initial conditions and is considered one of the most important subjects in applied mathematics, physics, and engineering fields. It has several applications ranging from weather forecasts, technology, and physical and life sciences. The kinematical nonlinear systems are of great interest for many outstanding researchers during the last three decades. In [1, 2], the dynamical behavior of such systems is investigated as good models in applied mechanics. Tousi and Bajaj in [3] studied period doubling bifurcations and modulated motion in 2-DOF of a nonlinear system. Moreover, Maewal in [4] examined chaos of the forced response of an excited elastic beam through the numerical solutions of the governing system of his suggested model. In [5], the author used the MS method to construct the expansion of the parametric excitation of two internally resonant oscillators up to the first order. The author determined the solutions of the steady-state case and checked the corresponding stability. In [6], the authors transformed the governing system of the excited buckled beam to approximate one and examined the stability of the equilibrium solutions to obtain Hopf bifurcations and a sequence of period doubling one, leading to chaotic motion. The response of an excited weakly vibrating system with 2-DOF close to resonance is investigated in [7]. The response of the considered system is checked using the averaging method and the numerical integration. In [8], Lee and Park investigated the excitation of spring pendulum using the MS technique and showed that the obtained approximate autonomous system has bifurcations. The effect of the higher-order expansions of this problem with internal resonance was examined in [9]. In [10], the authors investigated the fourth-order approximate solution for the governing system and the stability of such system of a similar problem when the stiffness of the spring becomes nonlinear. In [11], the authors investigated the same problem besides any equilibrium state using MS method and they also examined the general manner of the system through utilizing the basin boundaries of attractors. They observed that these boundaries may be fractal and the damping coefficients have a great effect during the chaotic motion. The problem of the nonlinear behavior of a 2-DOF oscillating system coupled with nonlinear damper and nonlinear spring is studied in [12]. The authors showed that, according to certain values for damping and stiffness coefficients, the oscillating amplitude for the examined model is reduced to give better design for the nonlinear absorber. In [13], Amer and Bek studied the response of the excited elastic pendulum in which the motion of the suspended point is considered in a circular path. The governing nonautonomous system is transformed to autonomous ones up to third order using the MS method. They found that the resulted system has bifurcations leading to chaos. Another pendulum model is examined in [14] when the suspended point moves in a prescribed path. The governing equations of motion have been obtained and solved analytically using the multiple scales method. The authors concentrated on predicting the resonance conditions and they studied these cases. This problem was generalized in [15] to study the vibrations of a rigid body as a pendulum model. Many interested examples for the motion of nonlinear systems can be found in [16–20] and the references herein. However, in [17] the authors investigated the motion of a spring pendulum which is moving in circular path. In [18, 19] they generalized their previous work by considering the effect of a damper to the motion.
In the current work, we extend the previous work in [14] for the nonlinear behavior of kinematically excited spring pendulum in which its suspension point moves in an elliptic path. Our main aim is to reveal the resonances conditions and to outline on a case of simultaneously resonances. Among the perturbation methods, the MS method is used to obtain the modulation equations determining all possible steady-state solutions. The graphical representations for suggested physical parameters of the obtained steady-state solutions are presented. Some examples are given as limit cases from the motion of considered model in order to simulate the dynamical behavior of this model.
2. Description of the Problem
Let us consider a dynamical system which consists of a mass m, suspended from one end of a massless linear spring having stiffness κ and statically stretched length . The other end is attached to the point O1 that moves in an elliptical path in which 2a and 2b represent the lengths of the minor and the major axes of the ellipse, respectively; see Figure 1. Take into account that the corresponding point of Q (located on the auxiliary circle b) is the point O1 (located on the ellipse) and this point moves with angular velocity Ω. Let us denote the horizontal axis by OY and the downward one by OX, in which both of them have the same origin O of the ellipse. Let M(t) be a moment acts about the point O1 in a anticlockwise direction, F(t) indicates the acting force on the mass m in the elongation’s direction of the spring, and Fr refers to the damping force acts on m along the pendulum length.
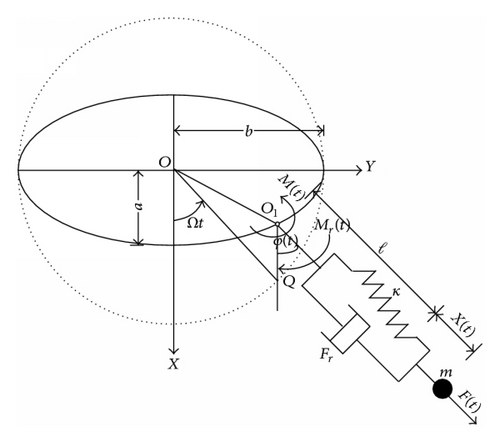
In addition to the influence of the kinematic excitation on the examined system, the moments M(t) = M0cos(Ω2t) and (of the linear viscous damping) have an extra effect around O. Furthermore, the force F(t) = F0cos(Ω1t) and the linear viscous damping are acting on the mass m and directed along the pendulum arm in which B1 and B2 denote the viscous coefficients.
3. The Analytical Solution
4. Modulation Equations Near Resonances
- (i)
Principal (primary) external resonances occurring at Ω ≈ ω1 and Ω2 ≈ ω2.
- (ii)
The spring’s resonance arising from the kinematic excitation at Ω ≈ ω1.
- (iii)
The pendulum resonance produced from kinematic excitation at Ω ≈ ω2.
- (iv)
Internal resonance occurring at ω1 = 2ω2.
- (v)
Combined resonances at Ω = ±(ω1 − ω2) and Ω = ±(ω1 + ω2).
Substituting (19) into (14)-(15) leads to appearance of secular terms. Their elimination produces the following solvability conditions.
Moreover, the previous system of (25) characterizes the amplitudes a1 and a2 and the modified phases θ1 and θ2 for the examined simultaneously resonances cases.
The graphical representations of the numerical solutions for the original system of (5) are presented, after taking into consideration the system of (25), to describe the motion of our dynamical system at any time.
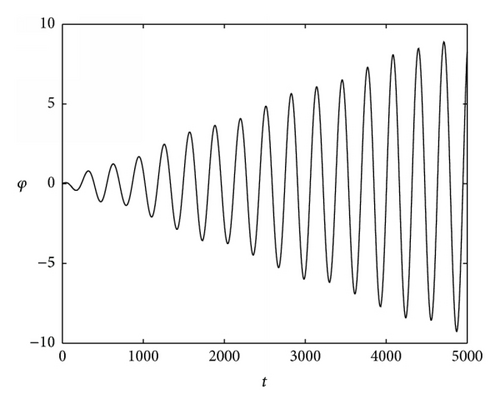
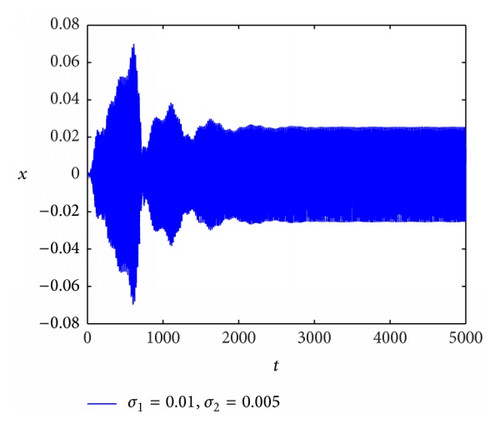
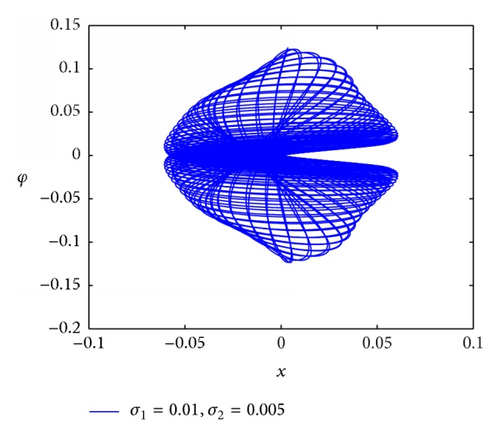
Figures 2 and 3 describe the time history of the motion for some selected parameters c1 = c2 = 0.003 [kg·m2·s−1], ω1 = ω2 = 0.02 [rad·s−1], σ1 = 0.01 [rad·s−1], σ2 = 0.005 [rad·s−1], a = 0.3 [m], and b = 0.5 [m]. It is not difficult to observe that Figure 2 displays the portrait of the solution x against time t and has the periodic or quasiperiodic behavior when time goes on, while Figure 3 describes the variation of the solution φ via t and represents the typical resonance behavior.

5. Steady-State Solution
The scope of this section is to obtain the steady-state solutions of both the amplitudes and modified phases corresponding to the zero values of the previous system (25). After omission of the phases θ1 and θ2 from the steady-state solution, the formulas of frequency response equations take the following form.
If two resonances occur at the same time, (26) and (27) ought to be a set of nonlinear equations in terms of a1 and a2. So one can illustrate the possible steady-state solutions close to resonance through a plane which consists of the coordinates a1 and a2.
The graphs displayed in Figures 4, 5, and 6 show the steady-state solutions of a1 via a2 when σ1 and σ2 take the values (0.03,0.02) [rad·s−1], (−0.03, −0.03) [rad·s−1], and (0.03, −0.002) [rad·s−1], respectively. The dashed lines represent the locus of the roots of (26), and the solid one identifies the solutions of (27). A closer look of these figures carefully shows that the concurrent points of both two curves identify the desired solutions of the system of (26) and (27). These points determine definitely the amplitudes of longitudinal and the fluctuating vibrations for the steady state. By the way, the steady states of oscillation may be stable or not. The geometrical representations of the system of (26) and (27) are obtained automatically using MATLAB program after taking into account the following parameters: ω1 = 0.22 [rad·s−1], ω2 = 0.13 [rad·s−1], c1 = 0.002 [kg·m2·s−1], and c2 = 0.003 [kg·m2·s−1].
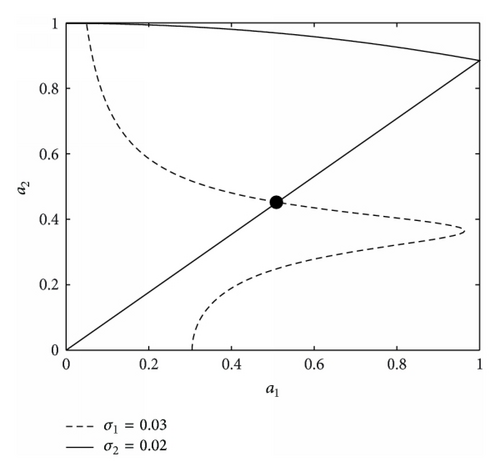
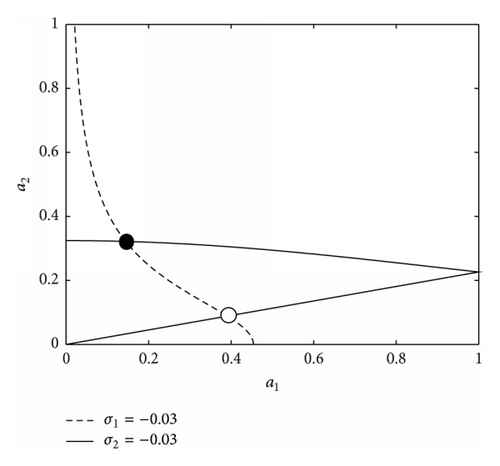
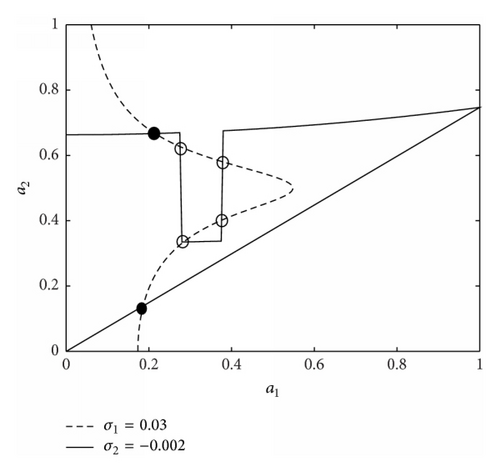
This elucidates that the desired possible solutions can be expressed as functions of the oscillating system’s parameters. Moreover, the lowest number of possible solutions is one and the maximum is may be up to seven.
6. Stability Analysis
One of the important factors for the mentioned problem of the steady-state oscillations is to investigate their stability. For this task, we analyze the manner of the system in a region that is very close to the fixed points.
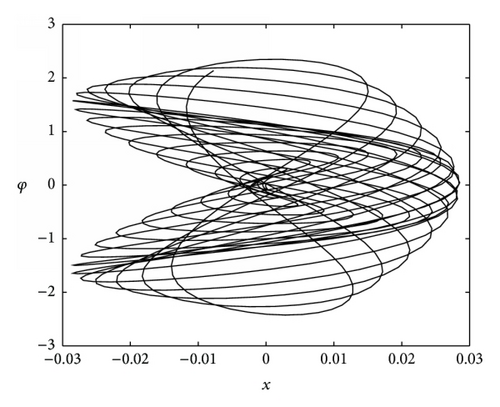
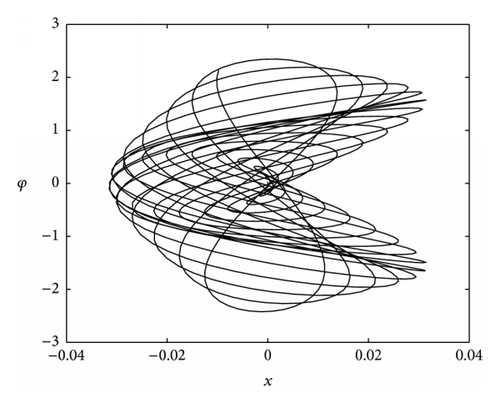
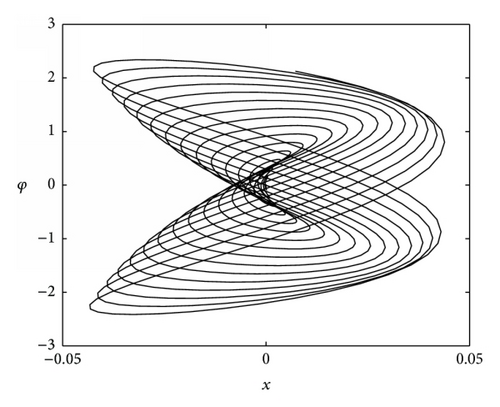
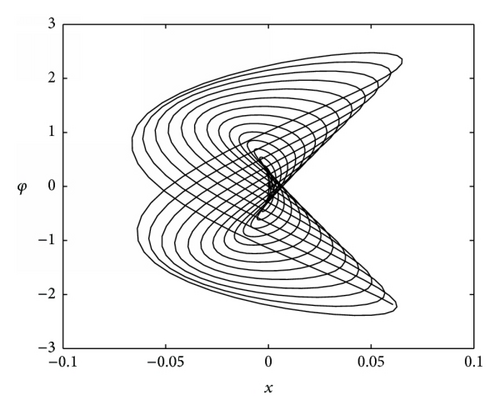
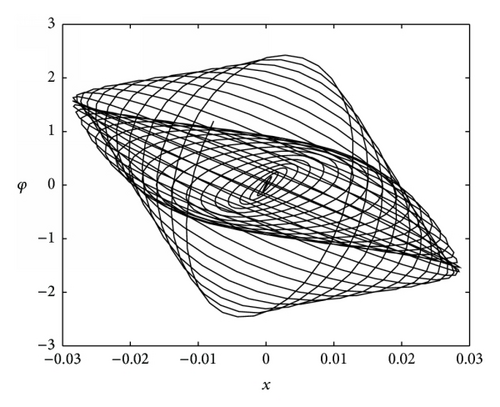
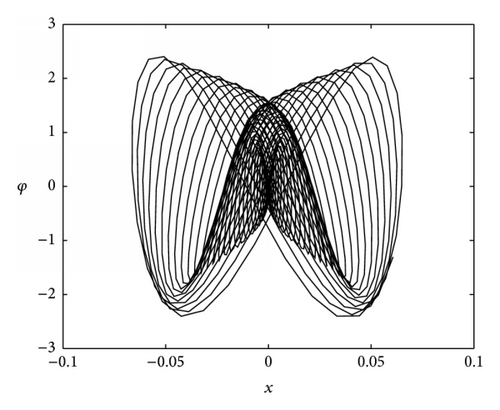
The used analysis to check the stability of the proposed solutions that are plotted in Figures 4, 5, and 6 can be interpreted as follows: the points characterized by black dots refer to the stable solutions, and those characterized by hollow circles refer to unstable ones. Figures 7–12 represent the variation of the solution x against the solution φ for selected values of the effective parameters ω2, σ1, and σ2 on the motion when ω1 = 0.2 [rad·s−1].
7. Examples
This section is devoted to provide some examples about the motion of the considered model, especially when the axes of the ellipse become equal; that is, a = b ≠ 0; this elucidates that the motion of the pivot point will be on a circle. Moreover, the supported point becomes fixed; that is, a = b = 0 (the major and minor axes take the zero value). In addition, the case can be studied when one length of ellipse’s axes vanishes (a = 0 or b = 0) or more precisely the pivot point moves horizontally or vertically. So let us examine these cases.
Case 1 (a = b ≠ 0). In this case, we observe that the suspended point O1 moves in a circular path of radius a = b = r. Figure 13 is drawn at σ2 = 0.005 [rad·s−1], ω1 = 1 [rad·s−1], ω2 = 0.5 [rad·s−1], r = 0.3 [m], and [m]. Parts (a, b) and (c, d) of this figure portrait the time history of the solutions at σ1 = 0.01 and σ1 = −0.01, respectively, while parts (e) and (f) display the projections of the phase planes at the same values of σ1. Therefore, the present results are in a good agreement with the known previous results as in [17] (in the absence of the damping force Fr) and [18, 19] (with the consideration of Fr).
In this case the modulations of amplitudes for both solutions x and φ after a short period of time tend to be more systematic, that is, harmonically, as indicated in parts (a), (b), (c), and (d). On the other hand, the shape of oscillations refers to the effectiveness of nonlinearity. The longitudinal vibration resorts to the sawtooth shape when time goes on till the end of time interval; this is due to the increasing of the nonlinearity parameters. The vibrations of the dynamical model tend to be steady state as shown from the time history plots.
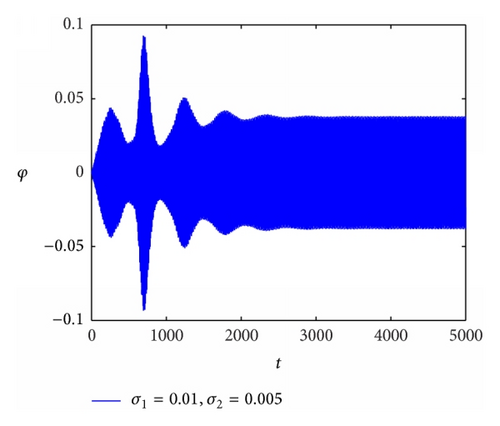
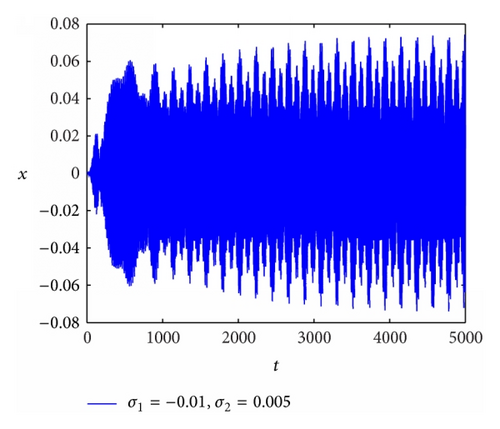
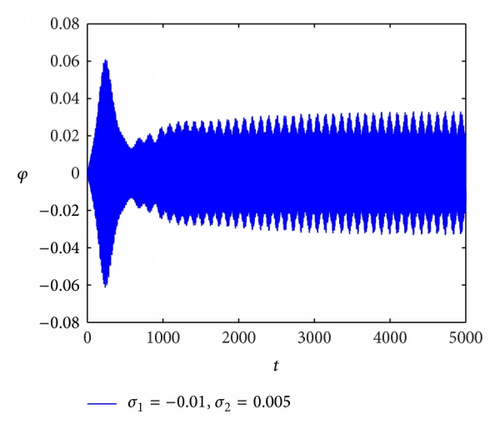
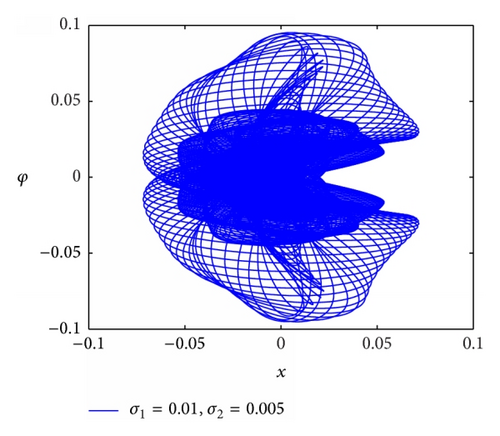
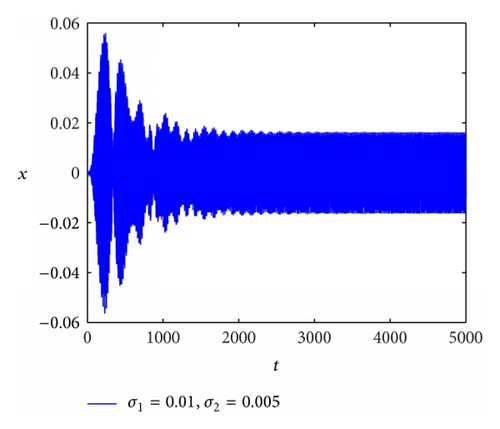
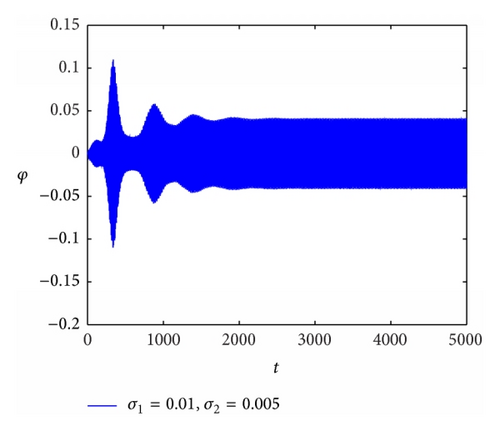
Case 2 (a = b = 0). In this case we shall concentrate on the solutions when the supported point will be fixed. Figure 14 summarizes the results obtained at σ2 = 0.005 [rad·s−1], ω1 = 1 [rad·s−1], ω2 = 0.5 [rad·s−1], a = b = 0, and [m]. The effectiveness of increasing time is on the solutions and is illustrated in parts ((a), (b)) and ((c), (d)) of Figure 14 at σ1 = 0.01 [rad·s−1] and σ1 = −0.01 [rad·s−1], respectively. The variation of the solution x via solution φ is presented in parts (e) and (f) of the same figure. The results of this case are in high consistency with the obtained ones in [20] (in the presence of the linear viscous damping).
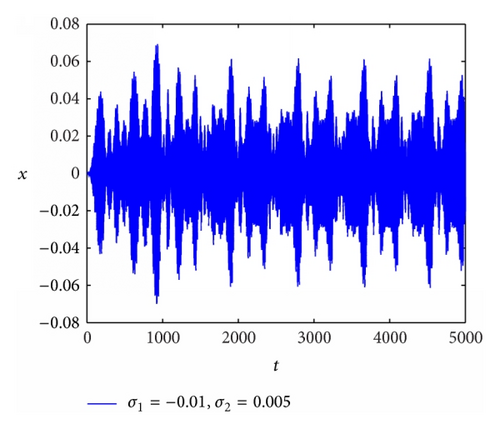
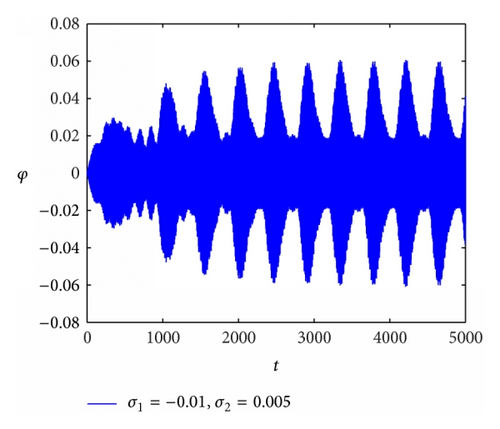
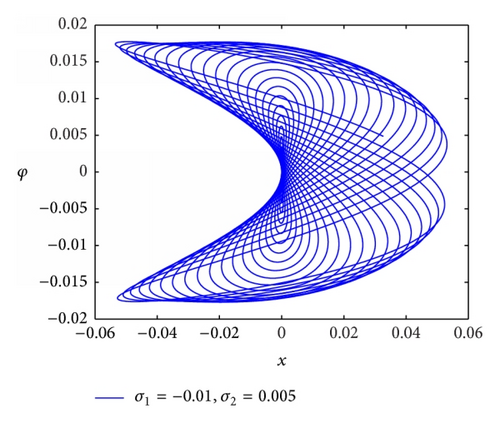
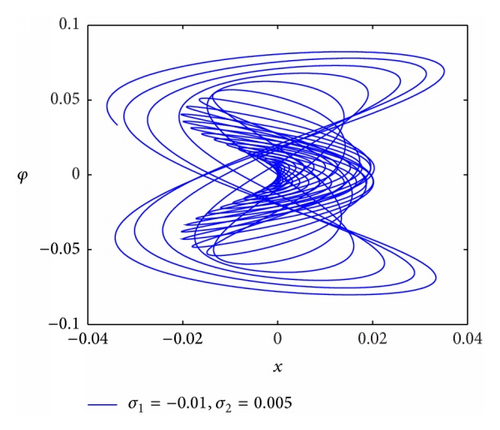
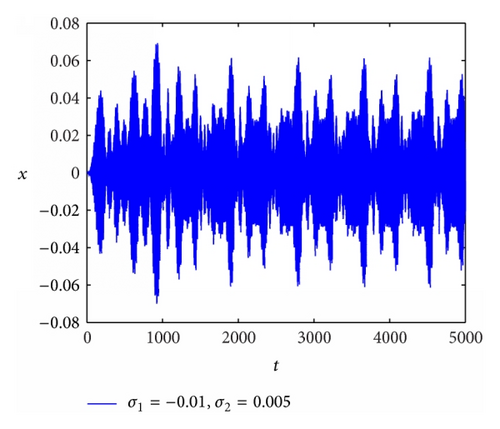
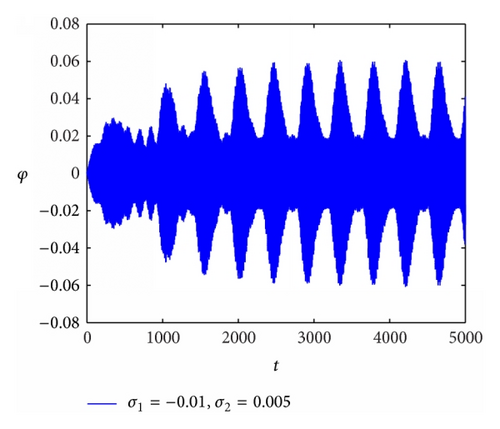
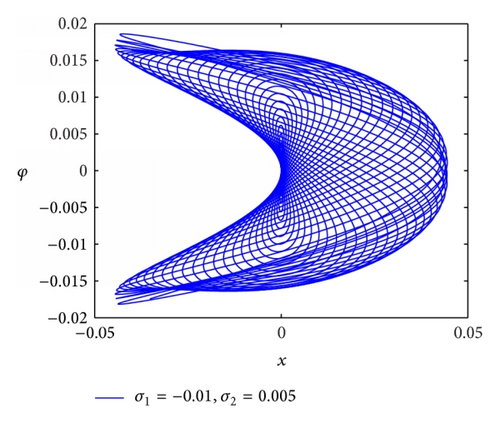
Case 3 (a = 0). The task of this case is to interpret the motion of the dynamical system when the pivot point moves horizontally. So the dynamical motion will be in a horizontal axis of length 2b through a long period [−b, b]. The graphs displayed in parts (a) and (b) of Figure 15 show the variation of the solutions x and φ with the time t when σ1 = −0.01 [rad·s−1], σ2 = 0.005 [rad·s−1], ω1 = 1 [rad·s−1], ω2 = 0.5 [rad·s−1], and b = 0.5 [m]. On the other hand, part (c) of the same figure explicates the variation of x versus φ at the same values of σ1 and σ2.
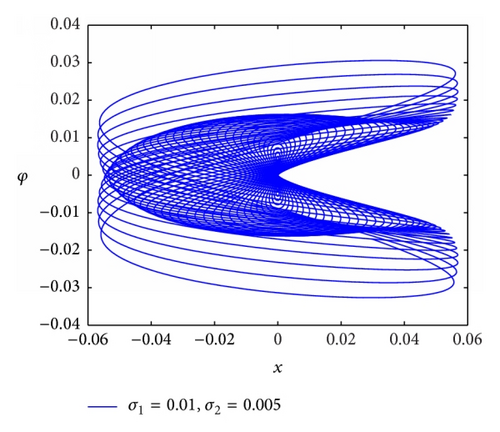
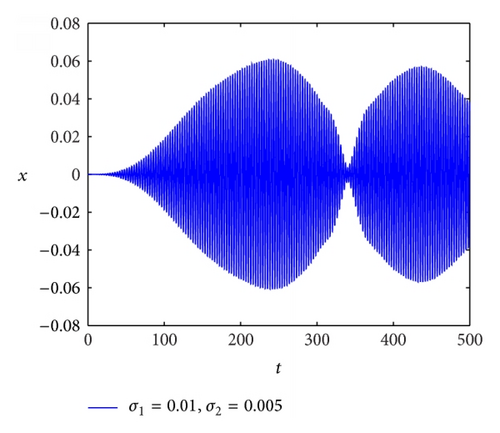
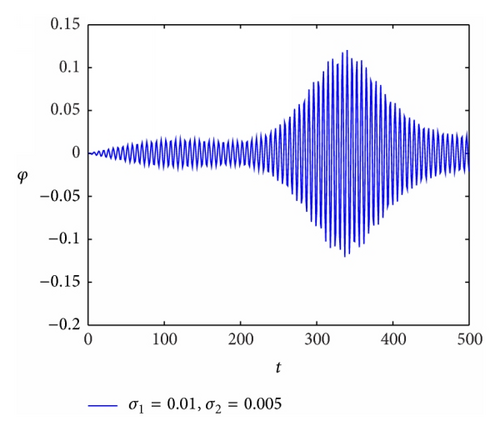
Case 4 (b = 0). One of the important concepts is to study the dynamical motion when the supported point O1 moves vertically on an axis of length 2a during a long period [−a, a]. Several figures have been plotted to illustrate the dynamical movement of the nonlinear pendulum during time and to show the variation of the considered solutions with each other like parts (a) and (b) of Figure 16 for the time history evaluation and part (c) for the variation of the attained solutions. These plots are calculated during the period of time from 0 to 500 s at σ1 = 0.01 [rad·s−1], σ2 = 0.005 [rad·s−1], ω1 = 1 [rad·s−1], ω2 = 0.5 [rad·s−1], and a = 0.3 [m].
It must be notice that the steady-state solutions at t = 0 are trivial ones as shown from parts (a) and (b) from this figure.
8. Conclusion
The analytical solutions of the derived original system (represents a nonlinear 2-DOF equations (5)) up to the third approximation are obtained using the MS method. The determination of all possible resonances that might occur is presented. One of these possible resonances, namely, the principal external resonances when Ω≃ω1 and Ω2≃ω2, is studied. Moreover, the modulation equations are obtained and solved numerically. The possible amplitudes have been deduced in (26) and (27) for the parametric and for the external resonances, respectively. These amplitudes are represented graphically through different plots. The substantial conditions for the stability analysis of the investigated system have been achieved according to Routh-Hurwitz method in order to obtain the possible fixed points. The projections of the phase plane of both solutions x and φ are represented graphically under certain parameters to show the effect of the different parameters on the motion. Some special cases from this work are presented in order to simulate the dynamic behavior of the considered model. Therefore, the present results are in high consistency with the known previous results as in [17–20]. One of the important applications of the considered model is the treatment of the seismic waves for the ground vibrations caused by seismic sources like earthquakes and volcano eruptions.
Competing Interests
The authors declare that they have no competing interests.


