Caspian Sea Tidal Modelling Using Coastal Tide Gauge Data
Abstract
The purpose of this paper is to model tidal conditions in the Caspian Sea using data from coastal tide gauges of Anzali, Noshahr, and Neka Ports. Harmonic analysis method was used to identify and examine 40 tidal components. The results illustrate that the annual (Sa) and semiannual solar (Ssa) components on all of the ports listed have the highest range in comparison with the other components which are, respectively, 16 cm, 18 cm, and 15 cm for annual components and 2.8 cm, 5.4 cm, and 3.7 cm for semiannual components.
1. Introduction
The gravitational attraction between Earth, moon, and sun has a well-known influence on Earth’s ocean levels [1].
Tidal analysis and prediction are the primary steps in the studies of each hydrodynamic and coastal management matter. It is dealing with the analysis of the sea level heights observations using physical and geophysical approaches advanced from experiences or physical reasoning and based on spectral analysis [2, 3].
In general, for the modelling of tides, there are three main ways: first is using hydrodynamic models (Laplace differential equations (LTE)), second is empirical modelling, and third is combination of hydrodynamic models and empirical models [4].
Knowing the causes of water level fluctuations of the seas has been one of the major challenges in all scientific fields and attracts the attention of many researches. Oceanic effects, aerologic effects, tides, climate change, and vertical movement of Earth’s shell can be noted as five factors that contribute to the impacts of climate change on the water level fluctuations [5].
The prediction is used in science and engineering to confirm the sympathetic of a given phenomenon by stating what its behavior has been till now and will be at a given time and then verifying that it is so [3], although without considering the physical effects of the large events (e.g., tsunami, storms, and seabed earthquake) the prediction of water levels can be achieved [6].
Not only the tides currently are exactly identified in the most global ocean, but also we have learned and computed new features of tidal dynamics [7].
Tidal effects due to their significant impacts on sea water level are of a great importance and researchers have always been looking forward to modelling them [8].
However, numerous undesirable natural events may have an effect on the predictions, but still there are determinable parameters which are essential to handle them exactly; for example, astronomical arguments and nodal corrections are singing the important parts in dealing with tidal analysis and prediction [9].
In this study, the effectiveness of tidal components by the use of coastal tide gauge’s observations is surveyed. Harmonic analysis method was used to determine tidal amplitude and phase of 40 components.
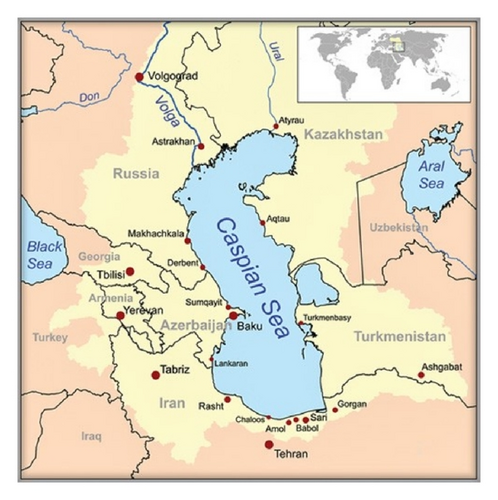
(1) Study Area and Relevant Data. Caspian Sea is surrounded by five countries, including Iran, Russia, Azerbaijan, Turkmenistan, and Kazakhstan (Figure 1). The Caspian Sea is the largest remaining section of the old Tethys Sea breakdown that was spread from the Arctic to Indian Ocean through the first to third geological period. In third geological period, appearance of Caucasus and Asian mountains leads to this big Sea dividing, so rise of European continent and construction of Iranian plateau were the main reasons of creation of Caspian Sea. Having the length of about 1030 km and the width of 435 to 196 km, the Caspian Sea locates between the 47°57′ an 36°33′ circuits and 46°43′ and 54°53′ hour circles [10].
2. Tides
Tides are the regular ebbing and flowing movement of the sea happening as the result of attractions of celestial near-earth bodies such as the sun and the moon. Tidal acceleration of celestial objects such as the moon at one point is the difference between the gravity acceleration of that celestial body and the mass centre of the Earth at that point. Viscoelastic earth changes due to tidal forces are roughly one-third of the surface international water. The vector field of these forces can be replaced with a scalar field named potential of tides [11].
It can be seen clearly from this relation that the first parameter of the relation relates to the half-daily effects and the second and third parameters, respectively, show the effects of daily and long period of tides. This relationship suggests that the tidal potential is a function of the absorbent body (moon and sun). It should be noted that, except for the gravitational forces mentioned above, other factors may be effective in producing and intensifying the tides [13].
In general, the sea water level fluctuations can be obtained as the result of the interaction of following dynamic processes: tides, changes in atmospheric pressure, the dynamic effects of ocean circulation, wind effects, the effects of temperature, water salinity changes, the effects of river discharge into the oceans, and melting of polar ices.
3. Tidal Harmonic Analysis
4. Tide Modelling
And n = 1,2, …, N tidal components.
In the above equation, Z0 is the average sea level, N is the number of tidal components, δn is angular frequency or speed (degree per hour), Vn(t0) is astronomical argument, fn(t) is nodal factor, un(t) is nodal phase, Hn is the component amplitude, and gn is the phase lag.
- (i)
λs(t) or simply “s” is the Mean Longitude of Moon.
- (ii)
λh(t) or simply “h” is the Mean Longitude of Sun.
- (iii)
λp(t) or simply “P” is the Longitude of Lunar Perigee.
- (iv)
λN(t) or simply “N” is the Longitude of Lunar Ascending Node.
- (v)
or simply “P′” or “P1” is the Longitude of Perihelion.
- (vi)
Φn is stationary phase (a multiple of 90°).
Stationary phase exists in most of Doodson numbers’ tables. Algebraic formula to determine the geographic Astronomical Longitude (the Celestial Sphere) λs(t), λh(t), λP(t), λN(t), or in some references in form of (s, h, P, N, P′) has been provided [20, 21]. In this study, Task-2000 method has been used.
IDAY is the number of days from January 1st of that year.
5. Forming the Observations Time Series of Coastal Tide Gauge
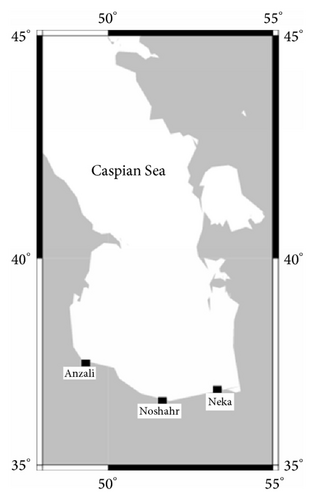
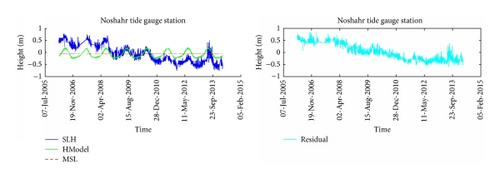
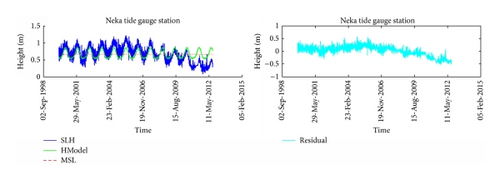
Features of tide gauge stations which are formed from their time series data were in Table 1 and geographical position of tide gauge stations could be seen in Figure 2.
| Station name | Latitude | Longitude | Time spam |
|---|---|---|---|
| Anzali | 37.4780° | 49.4623° | 21/3/2005–20/3/2014 |
| Noshahr | 36.6584° | 51.5047° | 21/3/2006–21/3/2014 |
| Neka | 36.8502° | 53.3656° | 1/1/2000–31/8/2012 |
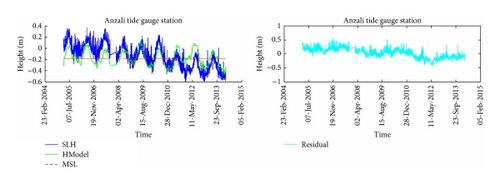
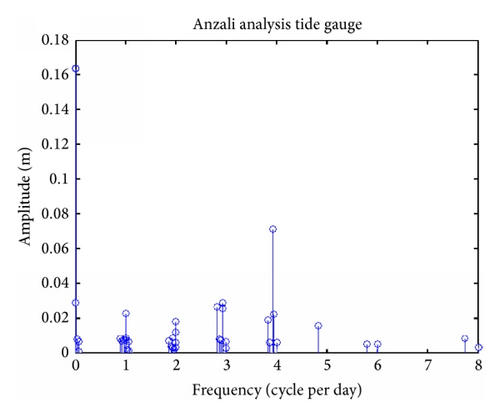
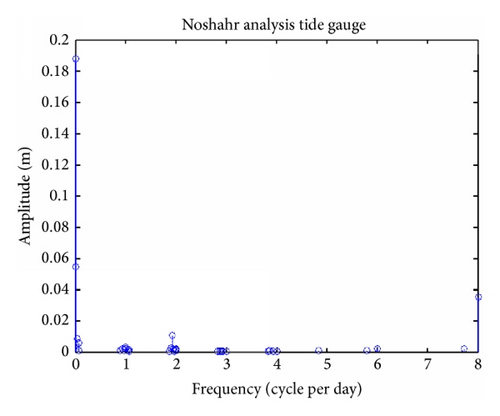
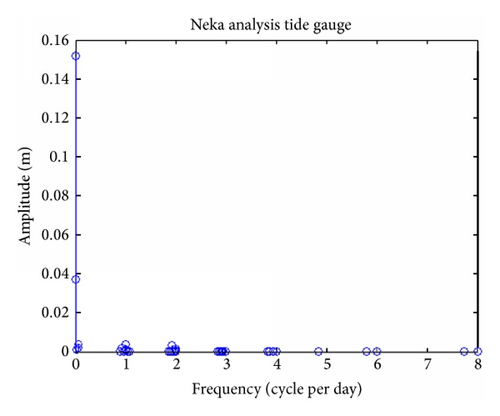
The analysis of time series Anzali tide gauge station and modelling time series by (10) could be seen in Figure 3. Residuals are small and acceptable. More amplitude to frequency of 40 tidal components of Anzali tidal gauge station could be seen (Figure 4). The values of time series analysis in Anzali station as well as the values of time series modelling analysis are shown in Table 2. It is shown that the modelling was done well. The same process was continued for stations Noshahr and Neka (Figures 5–8). Also, results of time series analysis and results of time series modelling in stations Noshahr and Neka are shown in Tables 3-4.
| Constituent | Amp_obs (m) | Phase_obs (deg) | Amp_mod (m) | Phase_mod (deg) |
|---|---|---|---|---|
| K2 | 0.003015 | 295.7626 | 0.00208 | 286.43 |
| L2 | 0.001672 | 271.2841 | 0.00171 | 271.46 |
| M2 | 0.008682 | 269.2956 | 0.0084 | 269.245 |
| N2 | 0.003698 | 158.6862 | 0.00374 | 159.22 |
| Ma2 | 0.003133 | 296.7903 | 0.00314 | 296.79 |
| R2 | 0.017878 | 73.22793 | 0.01812 | 78.22 |
| S2 | 0.012064 | 67.14119 | 0.01206 | 67.141 |
| T2 | 0.005672 | 144.9542 | 0.0065 | 142.954 |
| J1 | 0.001707 | 121.5101 | 0.0017 | 121.8201 |
| K1 | 0.022738 | 11.43623 | 0.0233 | 11.3 |
| M1 | 0.007332 | 67.24207 | 0.0073 | 68.45 |
| O1 | 0.006945 | 165.1889 | 0.00693 | 165.1923 |
| P1 | 0.00704 | 217.9986 | 0.007245 | 218.43 |
| Q1 | 0.008204 | 232.6201 | 0.008325 | 232.56 |
| S1 | 0.008428 | 83.31833 | 0.008267 | 84.673 |
| M3 | 0.0072 | 93.20983 | 0.00687 | 93.65 |
| S3 | 0.002717 | 119.0538 | 0.00281 | 119.487 |
| M4 | 0.005868 | 233.6994 | 0.00589 | 233.996 |
| S4 | 0.006028 | 85.39538 | 0.006518 | 85.7 |
| M5 | 0.015845 | 21.3593 | 0.01522 | 21.487 |
| M6 | 0.004693 | 239.5097 | 0.00467 | 240.43 |
| S6 | 0.004883 | 193.316 | 0.0049 | 193.76 |
| M8 | 0.008275 | 265.0774 | 0.00865 | 265.9 |
| S8 | 0.003187 | 159.8985 | 0.00376 | 158.34 |
| Mf | 0.006459 | 109.5878 | 0.006217 | 107.789 |
| Mm | 0.007524 | 134.4543 | 0.00776 | 136.89 |
| Msf | 0.000792 | 77.13807 | 0.000734 | 76.54 |
| Oo1 | 0.006236 | 355.2012 | 0.006236 | 355.34 |
| Ssa | 0.028563 | 55.42608 | 0.02862 | 53.56 |
| Ms4 | 0.070979 | 15.67987 | 0.0704 | 15.456 |
| Mn4 | 0.018667 | 186.2534 | 0.01889 | 186.789 |
| Mk3 | 0.02533 | 282.7036 | 0.0255 | 282.408 |
| Sa | 0.163234 | 212.3174 | 0.163198 | 212.456 |
| Mo3 | 0.007534 | 219.1039 | 0.007423 | 218.56 |
| No3 | 0.026181 | 8.642835 | 0.026789 | 9.43 |
| 2N2 | 0.006548 | 46.04756 | 0.006437 | 47.13 |
| So3 | 0.028834 | 137.9187 | 0.02889 | 136.67 |
| Sk3 | 0.006522 | 44.34284 | 0.00657 | 44.389 |
| S01 | 0.001092 | 68.53536 | 0.001034 | 68.576 |
| Mk4 | 0.022139 | 331.8166 | 0.0234 | 331.8834 |
| Constituent | Amp_obs (m) | Phase_obs (deg) | Amp_mod (m) | Phase_mod (deg) |
|---|---|---|---|---|
| K2 | 0.001265 | 205.3896 | 0.001276 | 204.9 |
| L2 | 0.000134 | 104.9257 | 0.000144 | 103.89 |
| M2 | 0.010247 | 275.8484 | 0.01028 | 276.896 |
| N2 | 0.002429 | 110.3829 | 0.002534 | 110.789 |
| Ma2 | 0.002005 | 73.94501 | 0.002007 | 74.289 |
| R2 | 0.00083 | 248.9937 | 0.00076 | 249.3397 |
| S2 | 0.001758 | 10.64485 | 0.001777 | 10.5689 |
| T2 | 0.00104 | 252.2587 | 0.001067 | 252.678 |
| J1 | 0.000575 | 38.258 | 0.000589 | 38.378 |
| K1 | 0.003133 | 206.5065 | 0.003145 | 206.45 |
| M1 | 0.000804 | 197.7024 | 0.000809 | 197.745 |
| O1 | 0.001833 | 74.5144 | 0.001845 | 74.78 |
| P1 | 0.001664 | 171.5155 | 0.001643 | 172.504 |
| Q1 | 0.000887 | 255.0884 | 0.00076 | 255.56 |
| S1 | 0.002105 | 352.2459 | 0.00167 | 352.214 |
| M3 | 0.000044 | 284.4275 | 0.000245 | 284.545 |
| S3 | 0.000222 | 10.67813 | 0.00678 | 10.63413 |
| M4 | 0.000773 | 269.5824 | 0.00989 | 269.6724 |
| S4 | 0.000389 | 334 | 0.000567 | 333.89 |
| M5 | 0.000592 | 308.7407 | 0.000345 | 308.437 |
| M6 | 0.000816 | 107.9719 | 0.00424 | 107.901 |
| S6 | 0.001758 | 297.3552 | 0.00987 | 296.9552 |
| M8 | 0.001783 | 300.9042 | 0.00345 | 300.405 |
| S8 | 0.035218 | 128 | 0.03789 | 128.2362 |
| Mf | 0.005655 | 63.45231 | 0.00679 | 64.82 |
| Mm | 0.008585 | 157.1591 | 0.00567 | 156.2271 |
| Msf | 0.000698 | 171.7511 | 0.000778 | 171.842 |
| Oo1 | 0.001602 | 126.1866 | 0.00189 | 125.731 |
| Ssa | 0.054341 | 86.44686 | 0.05345 | 86.461 |
| Ms4 | 0.000389 | 142.9945 | 0.00927 | 143.18 |
| Mn4 | 0.000375 | 12.73982 | 0.00678 | 13.7 |
| Mk3 | 0.000346 | 67.02355 | 0.00345 | 66.425 |
| Sa | 0.188683 | 208.5804 | 0.18907 | 208.2541 |
| Mo3 | 0.000228 | 52.28991 | 0.00789 | 51.75 |
| No3 | 0.000178 | 216.8859 | 0.000845 | 217.323 |
| 2N2 | 0.000519 | 37.64077 | 0.000612 | 37.772 |
| So3 | 0.000414 | 105.4683 | 0.000432 | 105.94 |
| Sk3 | 0.000306 | 334.2423 | 0.000351 | 334.58 |
| S01 | 0.000225 | 195.3219 | 0.000376 | 194.218 |
| Mk4 | 0.000424 | 74.62624 | 0.000387 | 74.947 |
| Constituent | Amp_obs (m) | Phase_obs (deg) | Amp_mod (m) | Phase_mod (deg) |
|---|---|---|---|---|
| K2 | 0.000609 | 248.292 | 0.00071 | 248.35 |
| L2 | 0.000094 | 210.8618 | 0.000078 | 211.23 |
| M2 | 0.003386 | 211.6024 | 0.00421 | 212.316 |
| N2 | 0.000451 | 33.09812 | 0.000418 | 33.789 |
| Ma2 | 0.000203 | 2.616894 | 0.000206 | 3.269 |
| R2 | 0.00027 | 266.0452 | 0.000261 | 266.169 |
| S2 | 0.001491 | 353.4808 | 0.00152 | 353.724 |
| T2 | 0.000322 | 84.26617 | 0.000341 | 83.972 |
| J1 | 0.0002 | 222.6129 | 0.000237 | 222.7034 |
| K1 | 0.003984 | 232.586 | 0.004112 | 232.213 |
| M1 | 0.000075 | 18.18968 | 0.000087 | 18.226 |
| O1 | 0.001979 | 22.82131 | 0.002141 | 24.718 |
| P1 | 0.000709 | 221.6676 | 0.000801 | 237.18 |
| Q1 | 0.000071 | 199.8688 | 0.000076 | 200.1073 |
| S1 | 0.001333 | 265.0889 | 0.001343 | 265.623 |
| M3 | 0.000014 | 238.5899 | 0.000017 | 238.3041 |
| S3 | 0.000127 | 71.53864 | 0.000143 | 70.946 |
| M4 | 0.000041 | 106.7546 | 0.000052 | 106.9928 |
| S4 | 0.00007 | 53.35676 | 0.000083 | 53.468 |
| M5 | 0.000036 | 289.5994 | 0.000038 | 289.783 |
| M6 | 0.00004 | 274.9504 | 0.000047 | 275.7935 |
| S6 | 0.000042 | 59.32671 | 0.00004 | 58.87 |
| M8 | 0.000071 | 0.493216 | 0.000082 | 0.78465 |
| S8 | 0.000007 | 343.1489 | 0.000007 | 343.1376 |
| Mf | 0.003968 | 358.5273 | 0.003965 | 357.5186 |
| Mm | 0.001392 | 37.48796 | 0.001323 | 38.418 |
| Msf | 0.002203 | 332.5874 | 0.002212 | 333.64 |
| Oo1 | 0.000043 | 172.098 | 0.000043 | 172.487 |
| Ssa | 0.037471 | 90.08432 | 0.0375 | 91.508 |
| Ms4 | 0.000045 | 225.9218 | 0.00005 | 226.5 |
| Mn4 | 0.000063 | 309.734 | 0.00006 | 310.47 |
| Mk3 | 0.000063 | 168.7787 | 0.00007 | 169.681 |
| Sa | 0.151559 | 218.163 | 0.1518 | 217.2045 |
| Mo3 | 0.000028 | 42.31016 | 0.000027 | 43.401 |
| No3 | 0.000055 | 308.456 | 0.000054 | 307.731 |
| 2N2 | 0.000032 | 294.6541 | 0.000034 | 295.391 |
| So3 | 0.00005 | 94.33536 | 0.00006 | 95.591 |
| Sk3 | 0.000114 | 73.86118 | 0.000145 | 74.584 |
| S01 | 0.000171 | 47.30391 | 0.000182 | 47.835 |
| Mk4 | 0.000058 | 116.3563 | 0.000072 | 116.2482 |
6. Conclusion
Tidal analysis of tide gauge stations illustrates the absence of efficiency in tidal components except for annual and semiannual components. However, unlike other stations, in Anzali station, MS4 components were effective.
The results also indicate that the annual (Sa) and semiannual solar (Ssa) components on all of the ports listed have the highest range in comparison with the other components which are, respectively, 16 cm, 18 cm, and 15 cm for annual components and 2.8 cm, 5.4 cm, and 3.7 cm for semiannual components.
By comparing the results with other studies [23, 24], the results of tidal analysis of this study are confirmed. The effect of the tides in the Caspian Sea is very small and there are only annual and monthly variations.
In [23], spectral analysis on tide gauge observation of Caspian Sea was done where the annual and semiannual component effect were observed. So it is corresponding with tidal analysis of this study.
Ignoring the modulation of solar perihelion and nodal modulation use can be mentioned as the weak points which were effective in tidal harmonic analysis; 18.6 time series must exist for resolving all frequencies. As for the other defects of this study, we can point out that there is no easy way to indicate the significance of amplitude and phase together with lack of appropriate solution for coastal areas that affects the shape of tidal waves.
In this study, the method of modelling and predicting of sea level is explained. With modelling sea level, the trend of sea level in future will be predicted and it helps coastal management. Also, in areas where effect of tide is high, by having sea level prediction with modelling, tide can be used to assess other factors affecting sea level variations like tsunami, vertical movement of the crust, and so forth.
The main problem with Caspian Sea tide gauge stations data is improper collecting and compiling them. Moreover, the sampling intervals in Anzali and Noshahr tide gauges are daily and each three hours, respectively, that can affect the tidal modelling and will decrease the accuracy of the computation.
Competing Interests
The authors declare that they have no competing interests.


