Effect of the Strain Kind on the Texture and Microstructure of Low-Alloyed Steel
Abstract
Crystallographic texture and microstructure of low-alloyed steel after twist extrusion (TE) and subsequent cold rolling along and across the TE axis were studied. The double axial cylindrical texture with axes 〈110〉 and 〈100〉 parallel to the TE axis and the vortex-like microstructure are formed in the steel during the TE. The subsequent rolling of extruded steel along the TE axis promotes the forming of typical steel rolling texture as well as the microstructure with elongated grains in rolling direction. Typical steel rolling texture as well as the equiaxed microstructure is formed in extruded steel after rolling in the direction transverse to the TE axis. The mechanisms of formation of the texture are discussed.
1. Introduction
Methods of severe plastic deformation (SPD), such as torsion under high pressure (HPT), 3D forging, equal-channel angular pressing (ECAP), accumulative roll bonding (ARB), cyclic extrusion and compression (CEC), repetitive corrugation and straightening (RCS), and twist extrusion (TE), are increasingly used recently for production of bulk ultrafine grained (UFG) materials [1]. Most popular kinds of metal semifinished in mechanical engineering such as precision long profiles including profiles with a cylindrical axial channel can be prepared only by the method of TE [2]. Certain structural aspects of unique properties of bulk UFG materials and prospects of their applications are presented in [1]. A significant number of works have been devoted to aspects of the texture formed during ESCAP [3–6], ARB [7–9], and HPT [10]. Crystallographic texture of aluminum alloy and bcc steel after TE has been investigated in [11]. Texture formation during the TE occurs through activation of slip systems as well as by means of vortex motion of refinement grains, which is similar to the turbulent liquid flow.
Control of the texture and anisotropy caused by it of physical and mechanical properties of structural materials is one of main tasks of modern metallurgy. Developing technologies to create an optimal texture in sheets can serve as an important reserve for improving the properties of products in many ways. Such technology processes typically include a combination of different kinds of plastic deformation and heat treatment. For example, the bar or rod with a circular or square cross section is the final product obtained using ECAP. This form is suitable when using the forging operations, but not suitable for obtaining of sheets and plates. In order to overcome this lack of ECAP, in [12] the combination of ECAP with the conventional rolling of the Fe-Co-V alloy is investigated. Similar processing applied to aluminum alloy 8112 [13], as well as for commercial Al-Mg alloy [14]. In the last three above cited papers changes in the structure of alloys and mechanical properties are studied in detail, but the texture is disregarded.
The microstructure and crystallographic texture of alloy Al-2.5 wt.% Mg processed by combining accumulative roll bonding and conventional rolling have been studied in [15]. Evolution of crystallographic texture during ECAP processing followed by drawing was analyzed in [16]. Evolution of crystallographic texture during ECAP followed by hot rolling was performed in [17].
Texture is the main cause of mechanical properties anisotropy of polycrystalline bodies as was mentioned above [18]. Study of possibility influence on the texture of the workpiece subjected to the TE by the subsequent deformation that is differed from the TE is important. It can be rolling or hydrostatic extrusion, for example, for lengthy profiles. Elongation of profile along its axis is the main type of deformation in these processes. Simple shear in a plane perpendicular to the extrusion axis is the basic form of the deformation during the TE [2]. Effect of the TE and consequent rolling in directions along and across the TE axis of aluminum alloy AA6063 was investigated in [19].
The aim of this work is to study the texture of low-alloyed steel at two stages of deformation. Steel samples on a first deformation stage were subjected to the TE. On a second stage of deformation steel samples were subjected to consequent cold rolling both along and across the extrusion axis.
2. Materials and Methods
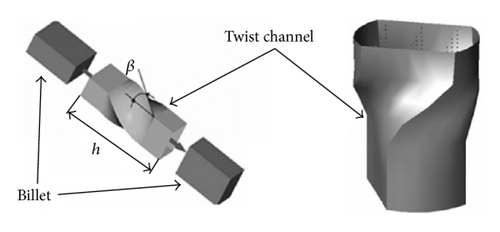
Cast cylindrical billets of low-carbon steel (C, 0.14%; Mn, 1.66%; S, 0.035%; P, 0.035%; Ni, 0.30%; Cr, 0.30%; Cu, 0.30%) were as starting material. The blanks were placed in a matrix [1, 2] with a helical channel (with parameters βmax = 60° and h = 50 mm). The cross section of the workpiece was perpendicular to the pressing axis and constant along the axis. The initial angle γ of helix inclination to the compression axis is zero. During the TE process this angle varies along matrix height h (Figure 1) [20].
- (i)
Heating temperature of the container and the matrix for the steel was 673 K.
- (ii)
Strain rate was 3 mm/s.
- (iii)
Strain rate was 0.2 ÷ 1 (c−1).
- (iv)
Pressure of the TE was 200 MPa.
- (v)
Workpiece size: cross section was 18 × 28 mm and length was 100 mm.
Metallographic structure was investigated in the rolling plane by means of metallographic microscope MIM-7 using the camera VEB-E-TREK DEM 200 to output the image structure on the computer monitor.
3. Results and Discussions
3.1. Twist Extrusion
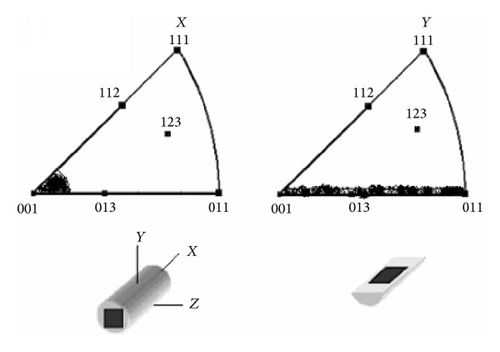
Experimental IPFs after TE of steel are shown in Figure 2.
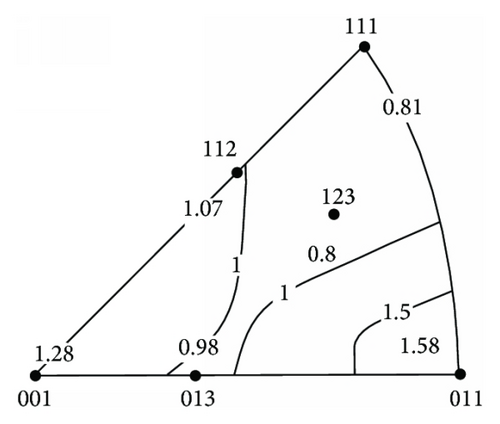
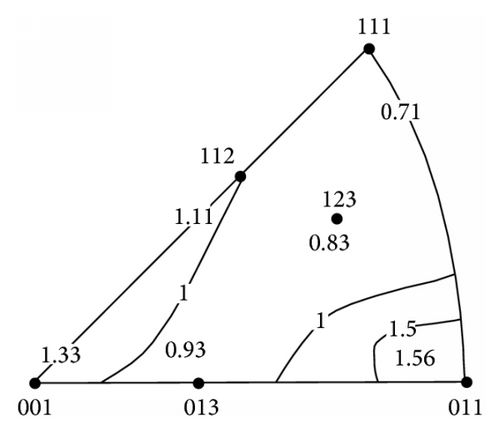
The maximal value of pole density 1.58 is observed in the pole 〈110〉 on the IPF of direction parallel to the TE axis (Figure 2(a)). Maximal pole density (1.56) corresponds also to the pole 〈110〉 on the IPF of direction perpendicular to the TE axis (Figure 2(b)). The second largest pole density corresponds to the 〈100〉 pole (resp., 1.28 and 1.33).
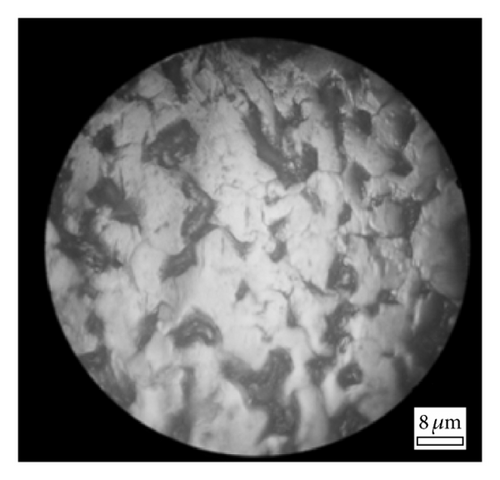
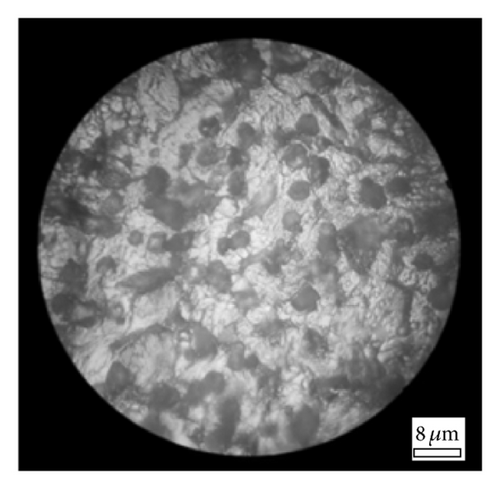
Figure 3 shows the microstructure of extruded steel. Traces of vortex-strain are traced. Images of the microstructure show that grain boundaries are tortuous and have tend to curl.
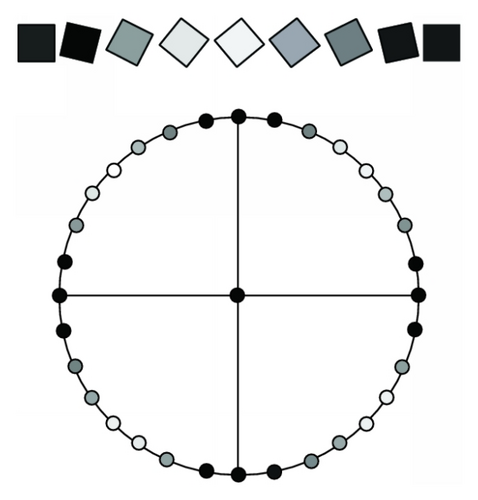
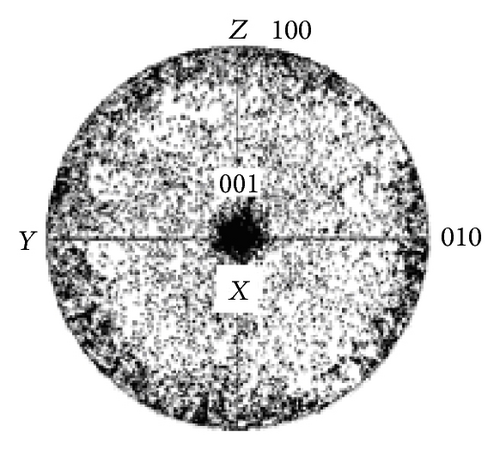
Orientations of crystals relative to the texture axis are completely disordered when typical axial texture is formed, as seen in the example of idealized axial texture 〈100〉 (Figure 4).
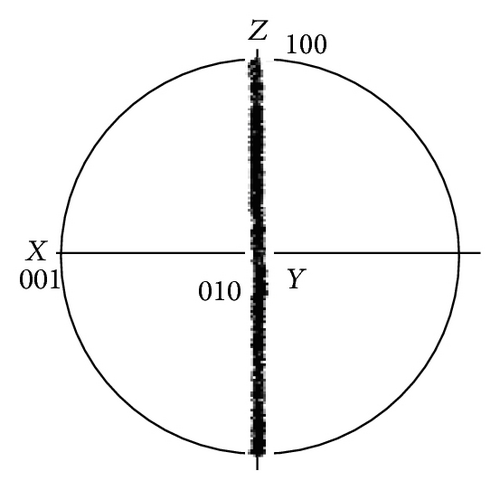
Radial direction of sample always coincides with one of specific crystallographic directions when the so-called “cylindrical” crystallographic texture is formed as schematically shown in Figure 5.
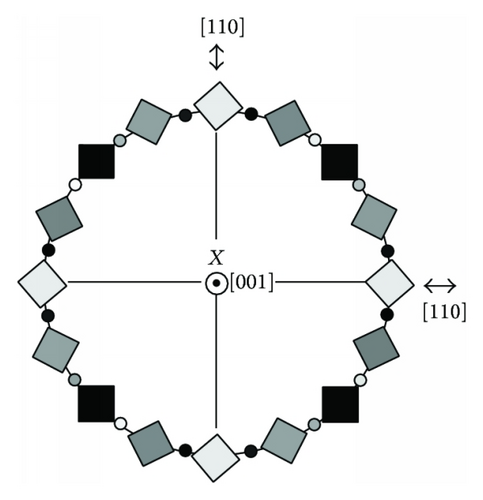
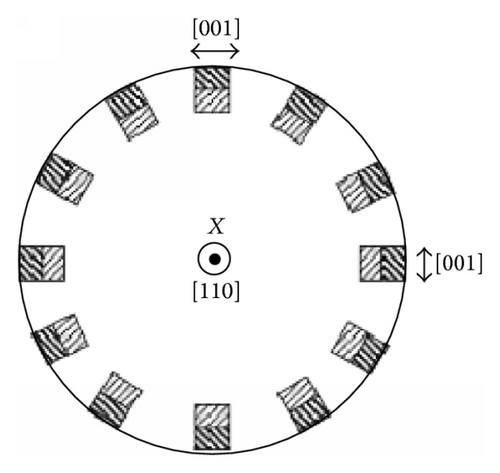
Comparison of experimental IPFs (Figure 2) with theoretical pole figures (Figures 4 and 5) allows us to conclude that the distribution of crystal orientations in Figure 1 is specific and can be described as a double “cylindrical” texture with axial directions of 〈110〉 and 〈100〉 parallel to the extrusion axis (X in Figures 4 and 5).
For example, the cylindrical texture was detected in niobium wire produced by hot pressing (swage wire) at true strain of 2.3. Directions 〈110〉 were parallel to the wire axis. Planes {001} were placed parallel to the wire surface [23]. It was also shown that the cylindrical texture formed usually during the production of wires from the metal with a body-centered cubic lattice [24].
Forming cylindrical axial texture of the above type was established previously in bcc alloy of Fe-Al system after extrusion through a cylindrical die at sufficiently high temperatures (850°C–1300°C) [25]. Formation of the aforementioned cylindrical axial texture can be explained, for example, in such a way [25]. In an axially symmetric stretch in all cases 〈110〉 fibrous texture develops. In grains with axis of stretching [011] there are directions [100] and [011] that are perpendicular to [011] axis (Figure 5). These orthogonal directions mechanically behave differently. Grains with fiber axis 〈110〉 will deform mostly by the pure shear, that is, at least by plane strain. However, since the total deformation of aggregates has axial symmetry, then in order to ease the strain of incompatibility the curling around tension axis can occur (Figure 6) [25].


Formation of axial texture {001} was detected in the samples of steel Fe-3% Si in the process of uniaxial compression at temperatures ranging from 1023 K to 1173 K and strain rates of 4.6 × 10⁻⁵ s−1 to 5.6 × 10⁻² s−1 [26]. It is very likely that the curling is realized at the texture formation during the TE considering experimental pole figures (Figure 1) and microstructure (Figure 2) which is all the more when there is a strong component of torsion at vortex motion of crushed grains, which is to certain extent similar to the turbulent flow of liquid [27]. Such vortex movement of crystallites is displayed in the photos of the microstructure (Figure 3).
3.2. Rolling after TE
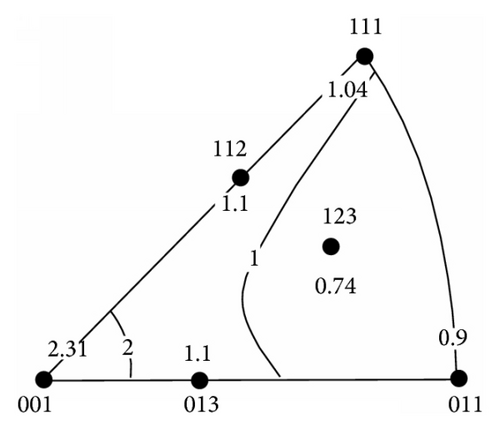
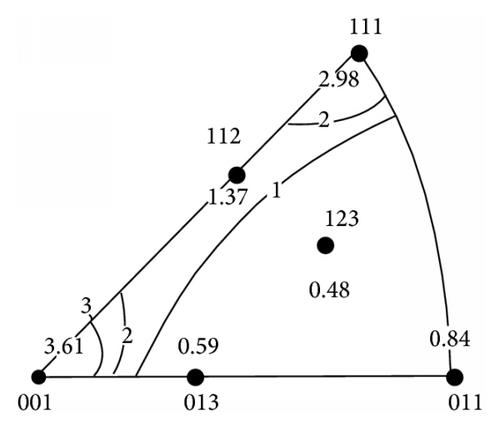
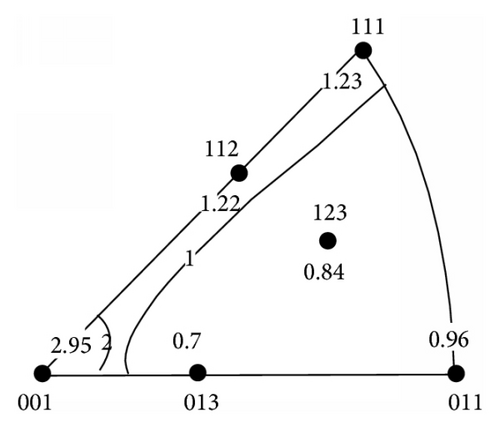
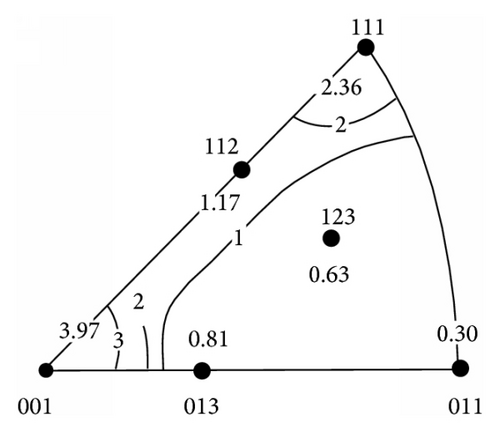
Microstructure of the rolled steel after the twist extrusion is shown in Figure 7.
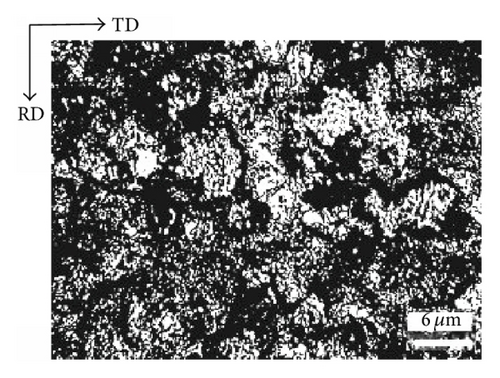
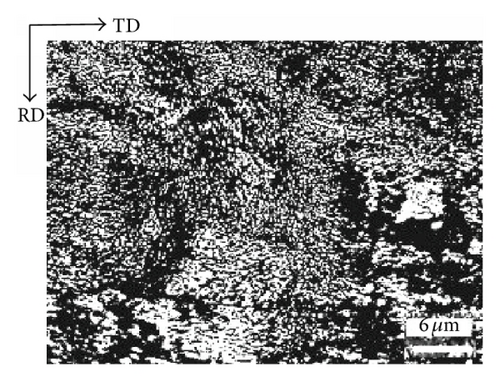
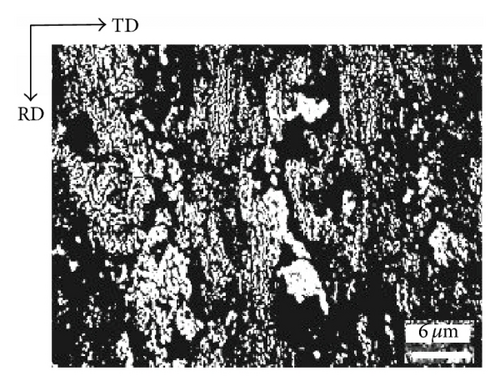
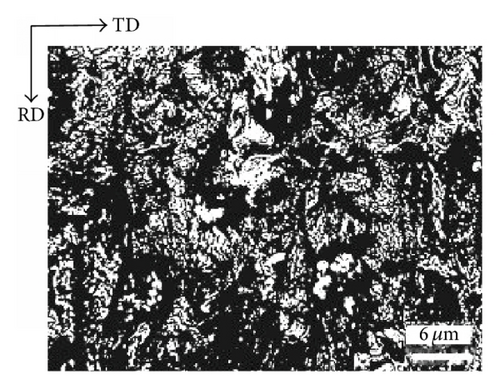
Grain boundaries after rolling with ε = 0.82 yet have traces of vortex-strain that are remained from twist extrusion. Rolling along extrusion axis with the reduction of 1.61 resulted in a considerable elongation of the grains in the RD. Elongation of grains is noticeably smaller when rolling across the TE axis with the reduction of 1.61.
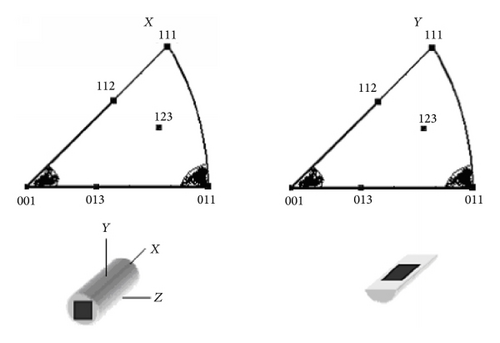
Figure 8 shows IPFs (ND) after rolling steel samples previously subjected to the TE.
- (1)
α-fiber: fiber axis 〈110〉 parallel to the rolling direction, including the main components of {001} 〈110〉, {112} 〈110〉, and {111} 〈110〉.
- (2)
γ-fiber: fiber axis 〈111〉 parallel to the normal direction, including the main components of {111} 〈110〉 and {111} 〈112〉.
- (3)
ε-fiber: fiber axis 〈110〉 parallel to the transverse direction, including the main components of {001} 〈110〉, {111} 〈112〉, {554} 〈225〉, and {011} 〈100〉.
Analysis of orientations showed that with increasing of reduction during rolling along TE axis texture with planes {111} parallel to the rolling plane is formed. These components’ texture has occupied about 12% by volume after TE. After rolling with ε = 0.82 along TE axis the abovementioned components occupy 14% of volume, and after rolling with ε = 1.61 along the TE axis they occupy 30% of volume (Table 1).
| hkl | Twist extrusion | Consequent rolling with ε = 0.82 along TE axis | Consequent rolling with ε = 1.61 along TE axis |
|---|---|---|---|
| ΔV/V, % | ΔV/V, % | ΔV/V, % | |
| 110 | 24.2 | 12.5 | 8.5 |
| 200 | 19.6 | 32.1 | 36.6 |
| 211 | 16.4 | 15.3 | 13.9 |
| 310 | 15.0 | 15.3 | 6.0 |
| 222 | 12.4 | 14.5 | 30.2 |
| 321 | 12.3 | 10.3 | 4.9 |
Orientations of crystals with the planes {001} parallel to the rolling plane more intensively are formed during the rolling across TE axis. These texture components after TE have occupied about 20% by volume. After rolling with ε = 0.82 across TE axis these orientations occupy 32%, and after rolling with ε = 1.61 across TE axis they occupy 37% by volume (Table 2).
| hkl | Twist extrusion | Consequent rolling with ε = 0.8 across TE axis | Consequent rolling with ε = 1.61 across TE axis |
|---|---|---|---|
| ΔV/V, % | ΔV/V, % | ΔV/V, % | |
| 110 | 24.1 | 12.2 | 3.2 |
| 200 | 20.6 | 37.3 | 43.0 |
| 211 | 17.2 | 15.4 | 12.7 |
| 310 | 14.4 | 8.9 | 8.8 |
| 222 | 11.0 | 15.6 | 25.5 |
| 321 | 12.8 | 10.6 | 6.8 |
Certain differences in mechanisms of plastic deformation cause the difference in the composition of texture components. Texture formation during the rolling along TE axis mostly occurs by sliding of dislocations on systems {110} 〈111〉. During the rolling transversely to the TE axis sliding of dislocations on systems {110} 〈100〉 prevails [16].
4. Conclusion
- (1)
Double axial cylindrical texture with directions of 〈110〉 and 〈100〉 parallel to the TE axis is formed during the twist extrusion of low-alloyed steel.
- (2)
Activation of deformation mechanism of the curling induced by the vortex motion of fragments crushed grains promotes the formation of cylindrical axial texture. Such vortex motion of fragments crushed grains in a certain extent is similar to the turbulent fluid flow.
- (3)
Texture with the components {001} 〈110〉, {112} 〈110〉, and {111} 〈110〉 is formed during the consequent rolling of the low-alloyed steel after twist extrusion.
- (4)
Texture components with planes {111} that are parallel to the rolling plane are mostly formed with the growth of deformation degree during the subsequent rolling of low-alloyed steel along extrusion axis.
- (5)
Orientations with planes {001} that are parallel to the rolling plane are more intensively formed during the subsequent rolling of steel across extrusion axis.
Competing Interests
The authors declare that there are no competing interests regarding the publication of this paper.


