Satellite Retrieval of Surface Evapotranspiration with Nonparametric Approach: Accuracy Assessment over a Semiarid Region
Abstract
Surface evapotranspiration (ET) is one of the key surface processes. Reliable estimation of regional ET solely from satellite data remains a challenge. This study applies recently proposed nonparametric (NP) approach to retrieve surface ET, in terms of latent heat flux (LE), over a semiarid region. The involved input parameters are surface net radiation, land surface temperature, near-surface air temperature, and soil heat flux, all of which are retrievals or products of the Moderate-Resolution Imaging Spectroradiometer (MODIS). Field observations are used as ground references, which were obtained from six eddy covariance (EC) sites with different land covers including desert, Gobi, village, orchard, vegetable field, and wetland. Our results show that the accuracy of LE retrievals varies with EC sites with a determination of coefficient from 0.02 to 0.76, a bias from −221.56 W/m2 to 143.77 W/m2, a relative error from 8.82% to 48.35%, and a root mean square error from 67.97 W/m2 to 239.55 W/m2. The error mainly resulted from the uncertainties from MODIS products or the retrieval of net radiation and soil heat flux in nonvegetated region. It highlights the importance of accurate retrieval of the input parameters from satellite data, which are the ongoing tasks of remote sensing community.
1. Introduction
Evapotranspiration (ET) includes evaporation from various land surfaces and transpiration from vegetation [1]. ET is interchangeable to the associated latent energy (LE) [2]. It is a key land surface process in regulating regional hydrological and climatic characteristics. As the only way back to the atmosphere, global land ET returns about 60% of annual land precipitation to the atmosphere [3]. Accurate estimation of ET is important for regional water resources management, especially in arid regions.
ET is intrinsically difficult to measure and predict especially at a large spatial scale. Various approaches are proposed to estimate ET in succession after the 18th century, including the Penman evaporation equation [4], the Penman-Monteith (P-M) combination equation [5], and the Priestley and Taylor approach [6]. Traditional measurement or estimation of LE is mostly applicable at a point-scale [7–9], including eddy covariance (EC) techniques [10]. However, representativeness of the point-scale measurement for a large area is generally problematic, and the dense coverage of point measurements is not feasible [11].
Alternatively, remote sensing technology can efficiently solve the representation limitation of the point measurement. However, it cannot observe LE directly, whereas it provides retrievals of geophysical parameters to estimate LE at a regional scale [12]. Several retrieval algorithms appeared in the last two decades [13, 14], including the triangle approach [15–17], the simplified surface energy balance index (S-SEBI) [18], the surface energy balance system (SEBS) [19], the three-temperature model [20–22], the MOD16 algorithm [23, 24], and other P-M remote sensing methods [25, 26]. They are widely applied to estimate regional or global ET from remotely sensed data [25–31]. The existing algorithms have a relative error from 10% to 40% [32, 33] in their validation sites. For example, Gillies et al. [34] used aircraft scanner data and the tringle approach to retrieve LE in an area covered with grasslands, steppe-shrub, and tall-grass prairie. The LE retrievals had a root mean square error (RMSE) value of 22~55 W/m2 and a relative error (RE) of 10%~30%, in reference to field measures by EC techniques and Bowen-radio approaches. Verstraeten et al. [28] used the advanced very high resolution radiometer (AVHRR) and the S-SEBI approach to retrieve LE in forestland. This achieved a RMSE (RE) of 35 W/m2 (24%), compared to EC measures. Su [19] used the Moderate-Resolution Imaging Spectroradiometer (MODIS) data and the SEBS approach to estimate LE in wheat, corn, and rainforest areas. The LE retrievals had a RE of 25%, compared to EC measures. Xiong and Qiu [22] used the three-temperature approach and Landsat Thematic Mapper (TM) data to retrieve instantaneous LE in grassland and hills. Relative to Bowen ratio systems, LE had a RE of 4.65%~100% or 0.02~0.20 mm h−1 during the satellite overpassing time. Mu et al. [23] evaluated the MOD16 products and reported an average bias (RE) of 0.31 mm day−1 (24.1%) for daily ET at FLUXNET-EC sites. Zhang et al. [25] applied normalized difference vegetation index- (NDVI-) based ET algorithm to assess global terrestrial LE using AVHRR GIMMS NDVI data. The daily results had a favorable accuracy with RMSE of about 10~40 W/m2 at 34 flux tower sites. Similarly, Leuning et al. [26] introduced a remotely sensed leaf area index- (LAI-) based P-M algorithm to calculate regional daily average evaporation using MODIS LAI products. At 15 flux sites globally, the systematic RMSE in daytime mean evaporation was in the range of 0.09~0.50 mm day−1, whereas the unsystematic component was in the range of 0.28~0.71 mm day−1.
A nonparametric approach (NP) has been recently proposed for estimating surface evapotranspiration [35]. It uses net radiation, surface air temperature, land surface temperature, and soil heat flux as the inputs, without the need of parameterizing surface resistance. All the necessary inputs are measurable, offering a novel but simple approach for practical use. The approach has been validated at 24 EC sites, yet it was not tested with remote sensing application. This paper applies the NP approach to estimate regional LE covering different surfaces, evaluates the accuracy of LE retrievals from MODIS data only, and identifies the error sources which are useful for improving retrieval accuracy.
2. Methodology
2.1. The Nonparametric Evapotranspiration Approach
2.2. Retrieval Algorithms for Net Radiation and Soil Heat Flux as Inputs to the NP Approach
2.3. Correction of EC Measures Used as Reference for Accuracy Assessment
Although EC is the most accurate technique to measure the turbulent fluxes of sensible and latent heat, the energy balance can not be closed with EC data at the Earth surface with a closure of the energy balance of approximately 80% [39, 40]. In addition, relative to the fluctuations of LE accuracy, Hs is measured in more reliable accuracy [41–43]. So it is necessary to correct LE directly measured by EC for validation.
2.4. Metrics for Accuracy Assessment
The linear regression approach is used to describe the accordance between RSLE and ERLE. The determination of coefficient (R2), slope, and intercept of the linear fit between RSLE and ERLE are subsequently obtained. The accordance is more satisfactory when the regression line is nearer to 1 : 1 line and R2 is higher.
In addition, bias, relative error (RE), and RMSE are used to quantify errors of RSLE. Bias quantifies the average absolute difference between retrieve values and reference values. RE is the absolute value of the bias divided by the magnitude of the reference values. RMSE is the standard deviation of the retrieve values around reference values. Basically, the RMSE represents a combination of standard deviation and bias.
3. Study Materials and Data Processing
3.1. Study Area and Ground Sites
As a typical inland river basin in the northwest of China, the Heihe River Basin is located between 97°24′~102°10′E and 37°41′~42°42′N and covers an area of approximately 130 000 km2. The selected 6 ground observation sites are parts of multiscale EC observation matrices belonging to Heihe Watershed Allied Telemetry Experimental Research (HiWATER) [48, 49], and they are acquired over the Zhangye region (100°25′E, 38°51′N, 1519 m) in the middle reaches of Heihe River Basin (Figure 1). A total of 6 EC sites measuring LE and Hs are used for data analysis and accuracy assessment (Table 1), accompanied by 6 automatic weather stations (AWS) which are used to measure the near-surface meteorological parameters. In view of spatial homogeneity and underlying representativeness, observations focus on six different areas with landscapes ranging from moist vegetated surfaces (vegetable, orchard, and wetland) to arid nonvegetated surfaces (village, desert, and Gobi). The locations of sites imply the similar climatic conditions. The underlying surfaces are homogeneous at all sites excepted for orchard and village sites. Based on the field visit, the fruit trees grow with bean seeding at orchard site. At village site, the underlying surface is composed of the bare soil, house, road, and trees.
| Type | Sites | Longitude (°) | Latitude (°) | Altitude (m) | EC height (m) |
|---|---|---|---|---|---|
| Vegetated | Wetland | 100.446 | 38.975 | 1460 | 5.2 |
| Vegetable | 100.358 | 38.893 | 1552 | 3.8 | |
| Orchard | 100.370 | 38.845 | 1559 | 7.0 | |
| Nonvegetated | Village | 100.358 | 38.878 | 1561 | 4.2 |
| Gobi | 100.304 | 38.915 | 1562 | 4.6 | |
| Desert | 100.493 | 38.789 | 1594 | 4.6 | |

All instruments were intercompared over the Gobi between 14 and 24 May, 2012 [43]. The intercompared and well agreed instruments, accompanied by the uniform data processing steps and standards, ensured data consistency, which guaranteed the reliability of validation [50]. All selected sites were covered by different land cover types. Thus, for convenience, the site names were replaced by the types of underlying surfaces here.
3.2. Data Description
3.2.1. Meteorological and Surface Flux Data
Acquired from the HiWATER, the EC and AWS data span from June 25 to September 15 in 2012, the overlapping time span of EC data at all sites (Table 2). All AWS and EC data were produced, archived, and made available to the scientific community by the Cold and Arid Regions Science Data Center at Lanzhou [43, 51]. They were used for validation and error source analysis of RSLE. All LE validation references were obtained by Hs (directly measured by EC), Rn, and Gs (measured by AWS) (see (5)).
| Datasets | Parameters | Temporal-spatial resolution | Data types | Data purpose |
|---|---|---|---|---|
| EC | LE/Hs | 30 minutes, hundreds of meters | Meteorology | Validation |
| AWS | P/ Rld/ Rlu/Ta/Rn/Gs | 10 minutes, several meters to hundreds of meters | Meteorology | Validation |
| ASTER | ε | 10–20 days, 90 m | Remote sensing | Validation |
| MYD07 | P/Td/Ta/θ | Daily, 5 km | Remote sensing | Retrieval |
| MCD43 | α | 8 days, 1 km | Remote sensing | Retrieval |
| MYD11 | Ts/ε | Daily, 1 km | Remote sensing | Retrieval |
| MYD13 | NDVI | 16 days, 1 km | Remote sensing | Retrieval |
3.2.2. Remote Sensing Data
Remote sensing data were obtained from the MODIS and Advanced Spaceborne Thermal Emission and Reflection Radiometer (ASTER) products. The pixels located at the sites were obtained to retrieve LE. All chosen images were acquired under clear sky during 13:00 to 15:00 (local time) from June 25 to September 15, 2012. The temporal and spatial resolutions of these products were listed in Table 2.
MODIS are onboard NASA’s Earth Observation System TERRA and AQUA satellites [52]. As mentioned above, various products (MOD, MYD, and MCD) are provided by MODIS. They have been produced, archived, and made available to the scientific community by the Level 1 and Atmosphere Archive and Distribution System (LAADS), the National Aeronautics and Space Administration (NASA). In our study, both MYD and MCD (MYD07, MYD11, MYD13, and MCD43) were selected to retrieve LE. MYD07 provided the profile of air temperature and moisture to obtain the near-surface atmospheric temperature and dew temperature [53]. MYD11 provided the land surface temperature and emissivity [54]. MYD13 provided the 16-day NDVI [55, 56]. MCD43 provided 8-day nadir BRDF-adjusted albedos [57, 58], including the albedo in band 1 to band 7.
3.3. Data Processing
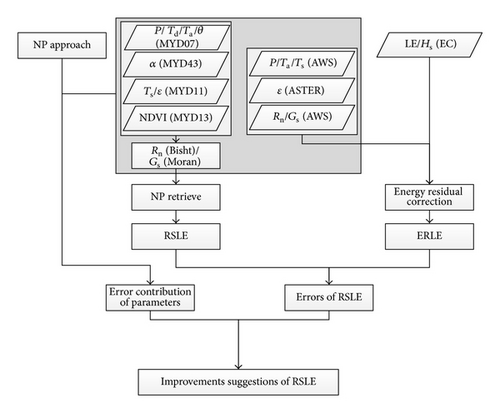
Aiming to ascertain the applicability of LE retrieve algorithm, the validation and error source analysis of RSLE were made at the different sites (Figure 2). Firstly, the LE obtained by EC was corrected by Rn, Gs (obtained by AWS), and Hs (obtained by EC) in the way of energy residual correction (see (5)). Secondly, Rn and Gs were retrieved by MODIS product in Bisht’s and Moran’s algorithm ((2) and (4)), respectively. Then, RSLE can be estimated in NP approach (see (1)). The errors of RSLE were derived from the discrepancies between RSLE and ERLE. Thirdly, to qualify the error contribution due to the input error of one parameter, that parameter (derived from MODIS) and the other actual parameters (measured by AWS/ASTER) were brought in NP approach to get LE estimation (see (1)). Similarly, all actual input parameters (measured by AWS/ASTER) were bought in NP approach to get LE estimation, too. The difference among these two estimations was regarded as the error contribution of the parameter at the retrieval moment [64]. Fourthly, according to the error analysis, we searched for the probable ways to improve the retrieve accuracy.
4. Results
4.1. Data Features at the Sites
Table 3 showed energy fluxes and environmental parameters measured by surface observations at the six sites. In the order of decreasing surface moistures, these sites were listed as wetland, vegetable, orchard, village, Gobi, and desert sites. The decreasing order matched pretty well with the vegetation abundances at these sites. Generally, there were higher LE in vegetated region with higher Rn/LSE and lower Gs/LST. In detail, Rn was higher at vegetated than nonvegetated sites. Mean amount of Rn was 625~735 W/m2 for vegetated sites, and it decreased to 490~540 W/m2 for nonvegetated sites. The difference was probably due to high surface albedo at nonvegetated sites. Gs increased from vegetated (down to 62.34 W/m2 for vegetable) to nonvegetated sites (up to 90.40 W/m2 for desert). After energy residual correction, ERLE was higher at vegetated sites (483~576 W/m2) than at nonvegetated sites (185~297 W/m2). Mean LSE was in the range of 0.978~0.981 and 0.932~0.975 for vegetated and nonvegetated sites. On the contrary, LST was considerably lower at vegetated sites with typical values of 300~305 K, compared to 315~320 K at nonvegetated sites. The near-surface pressure was higher at vegetated sites than at nonvegetated sites (up to 89.11 kpa for wetland, and down to 83.28 kpa for desert). The difference of AT was little, and there was about 299 K of AT at all sites. These environmental parameters were the background of LE retrieve.
| Parameters | Types | Wetland | Vegetable | Orchard | Village | Gobi | Desert |
|---|---|---|---|---|---|---|---|
| Rn (W/m2) | AWS | 625.12 | 646.55 | 735.09 | 543.48 | 489.84 | 519.40 |
| Gs (W/m2) | AWS | 96.39 | 64.34 | 62.35 | 86.95 | 90.06 | 90.40 |
| Ts (K) | AWS | 305.35 | 304.08 | 301.20 | 315.46 | 316.68 | 320.71 |
| Ta (K) | AWS | 299.78 | 299.18 | 298.72 | 300.02 | 298.29 | 299.58 |
| LSE | ASTER | 0.981 | 0.978 | 0.980 | 0.975 | 0.958 | 0.932 |
| P (kpa) | AWS | 89.11 | 88.32 | 83.89 | 83.28 | 84.02 | 84.10 |
| LE (W/m2) | ER | 496.51 | 482.68 | 575.93 | 297.33 | 184.96 | 212.54 |
4.2. MODIS Retrievals of Rn, Gs, and LE
Rn, Gs, and LE were all derived from satellite retrieve. Table 4 showed input parameters obtained by satellite retrieve at the six sites. The dew point temperature, pressure, and LSE were similar among all sites, with values of about 278 K, 78 kpa, and 0.96, respectively. Other parameters were different among sites. In detail, AT were 296~299 K at all sites except for orchard (292 K) and desert (289 K) sites. Low LST appeared at vegetated sites (about 301 K), whereas high LST occurred at nonvegetated sites (300~309 K). Similarly, albedo was slightly lower at vegetated sites with value of about 0.17, compared to about 0.19 at nonvegetated sites. Thus, generally, the retrieved Rn was higher in vegetated region (650~685 W/m2) than in the nonvegetated region (570~685 W/m2). Considering the lower NDVI at nonvegetated sites (less than 0.2), the higher retrieved Gs (more than 250 W/m2) appeared there. On the basis of the retrieved Rn and Gs, RSLE was higher at vegetated sites (350~450 W/m2) than at the nonvegetated sites (120~440 W/m2).
| Parameters | Wetland | Vegetable | Orchard | Village | Gobi | Desert |
|---|---|---|---|---|---|---|
| Ts (K) | 301.64 | 301.39 | 301.46 | 300.73 | 307.61 | 309.33 |
| LSE | 0.965 | 0.972 | 0.973 | 0.973 | 0.964 | 0.963 |
| P (kpa) | 79.80 | 78.73 | 77.96 | 78.47 | 79.15 | 77.06 |
| Td (K) | 277.33 | 279.07 | 279.35 | 279.55 | 278.28 | 278.08 |
| Ta (K) | 298.15 | 298.58 | 291.75 | 296.16 | 299.10 | 289.44 |
| Albedo | 0.193 | 0.171 | 0.171 | 0.165 | 0.207 | 0.186 |
| NDVI | 0.713 | 0.701 | 0.717 | 0.790 | 0.143 | 0.117 |
| Rn (W/m2) | 654.26 | 685.18 | 650.64 | 685.19 | 616.08 | 572.75 |
| Gs (W/m2) | 84.46 | 89.46 | 83.35 | 73.91 | 264.77 | 257.16 |
| LE (W/m2) | 425.07 | 452.25 | 354.37 | 441.10 | 233.28 | 120.48 |
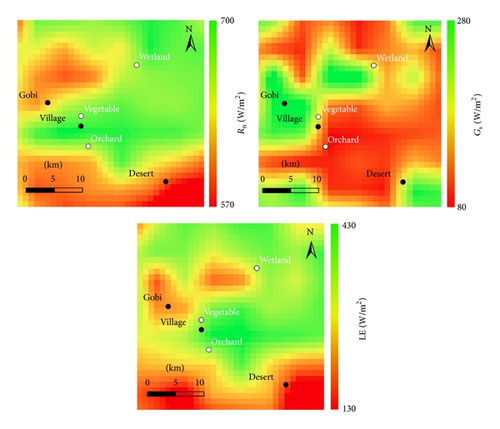
The instantaneous retrieve results of Rn, Gs, and LE in a part of Zhangye region at 05:55 (UTC) in August 20, 2012, were shown in Figure 3. The distribution of LE, Rn, and Gs was in good accordance with the oasis-desert ecosystem. The desert (the east and south of the region) had lower Rn because of the high albedo here. The desert also had higher Gs because of bare surface. In addition, the oasis (the middle of the region) and wetland (the north of the region) had more evaporation than desert because of the irrigation. In view of retrieve values, the LE was up to 300~400 W/m2 in the region of oasis, whereas the LE decreased to 150~250 W/m2 in the region of desert. In general, the distribution of retrieve results was deemed to be reliable.
4.3. Accuracy Assessment of MODIS-Retrieved LE
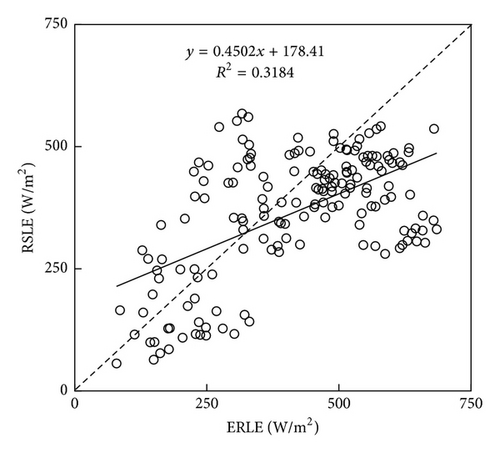
Figure 4 revealed the relationship between ERLE (donated by x-axis) and RSLE (donated by y-axis) at the retrieval moment. In general, relative to ERLE in 30 minutes, the RSLE was generally accurate and underestimated with bias, RMSE, RE, slope, and R2 of −49.64 W/m2, 144.20 W/m2, 11.97%, 0.45, and 0.32, respectively (Table 5).
| Sites | Bias (W/m2) | RMSE (W/m2) | RE (%) |
|---|---|---|---|
| Wetland | −71.44 | 79.77 | 14.39 |
| Vegetable | −43.77 | 73.62 | 8.82 |
| Orchard | −221.56 | 239.55 | 38.47 |
| Village | 143.77 | 160.14 | 48.35 |
| Gobi | 48.33 | 67.97 | 26.13 |
| Desert | −92.32 | 105.64 | 43.44 |
| Overall | −49.64 | 144.20 | 11.97 |
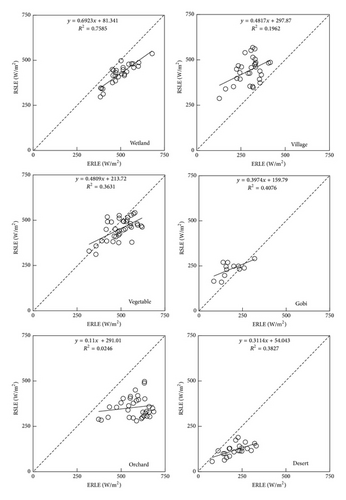
At the site scale, Figure 5 also showed the comparison between RSLE and ERLE at all 6 sites. RSLE was generally underestimated, and it was in relatively good agreement with ERLE at most of the sites, with R2 of 0.11~0.76, bias of −222~49 W/m2, RE of 9~49%, and RMSE of 68~240 W/m2. The highest accuracy occurred at vegetable, wetland, and Gobi sites, with RE (RMSE) value of 8.82% (73.62 W/m2), 14.39% (79.77 W/m2), and 26.13% (67.97 W/m2), respectively. The RSLE was less satisfactory at orchard and village sites, with RE of about 40~50% and RMSE of more than 160 W/m2.
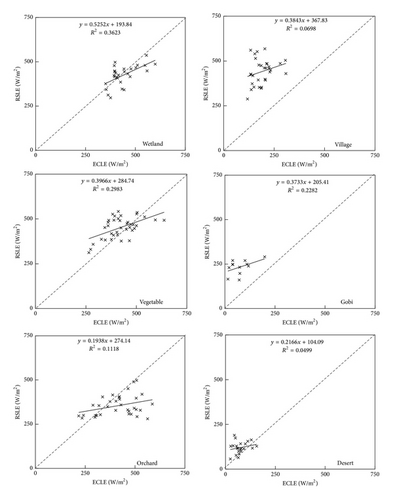
To validate the retrieved LE further, the LE directly observed by EC (ECLE) was also compared with RSLE in Figure 6. Similarly, the RSLE was in relatively good agreement with ECLE with R2 of 0.11~0.36 at vegetated sites. Nevertheless, at the nonvegetated sites, the accordance disappeared with R2 of 0.05~0.23. Relative to the ECLE in Figure 6, the ERLE matched better with retrieved surface LE in Figure 5, especially at nonvegetated sites. Thus, at least, the RSLE had a satisfactory accuracy at vegetated sites, and it also probably had a relatively good accuracy at nonvegetated sites.
4.4. Error Sources and Their Contributions to MODIS-Retrieved LE
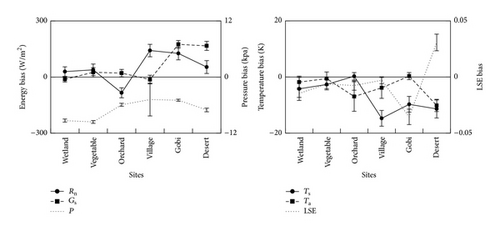
To reveal the error contributions of input error, the input error of each parameter was showed firstly (Figure 7). Rn was retrieved with low accuracy at village, orchard, and Gobi sites with bias value of more than 80 W/m2. There was a low accuracy of retrieved Gs at almost all sites, especially at Gobi and desert sites (bias values of about 170 W/m2). The large difference (about 10 kpa) of surface pressure appeared at Gobi and desert sites. At most sites, the biases of AT were 2~5 K, except for orchard (−7 K) and desert (−10 K) sites. Similarly, the biases of LST were also 0~4 K at vegetated sites, whereas they were more than 9 K at nonvegetated sites. The LSE difference between MODIS and ASTER products was less than 0.01 at all sites except for Gobi (−0.036) and desert sites (0.031).
On the basis of input errors, the error contribution can be revealed. Figure 8 showed the error contributions of each factor (shown as the line) and the error of RSLE (shown as the columns) at 6 sites. Except for orchard and village sites, the RSLE were in relatively satisfactory accuracy, and the biases were within −90~50 W/m2 at the other 4 sites. Based on the analysis of error sources, it was clear that the major error sources (inducing more than 40 W/m2 RSLE error) were Rn, Gs, LST, and AT at nonvegetated sites, with error contributions of 40~110 W/m2, −120~10 W/m2, >60 W/m2, and −100~10 W/m2, respectively. At vegetated sites, input errors were not the dominant error sources of RSLE.
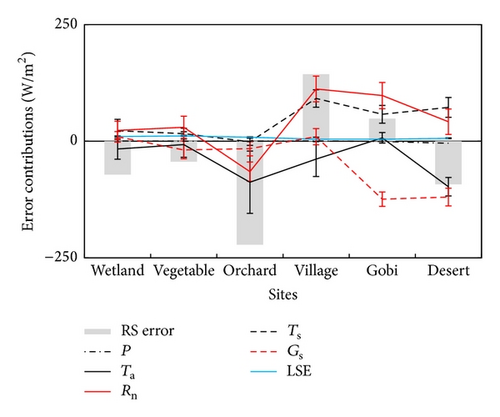
In detail, the large Gs error contribution (causing more than 100 W/m2 RSLE error) appeared at Gobi and desert sites. About 100 W/m2 RSLE error caused by the Rn error occurred at village and Gobi sites. The influence of AT and LST error on LE error was below 40 W/m2 at most of sites, except for the LST at village and Gobi sites, the AT and LST at desert site, and AT at orchard site. The error contribution of LSE accounted for RSLE error as a small part (leading to less than 10 W/m2 LE error). Similarly, the input errors of pressure affected RSLE error quite little (mostly less than 1 W/m2). In addition, according to validation, the accuracy of RSLE was unsatisfactory at orchard and village with a bias of −221.56 W/m2 and 143.77 W/m2, respectively. At these two sites, the main errors sources (inducing more than 100 W/m2 RSLE error) were AT and Rn.
5. Discussion
The improvement of input data can possibly benefit LE retrieve in the future. Rn and Gs are not the direct input parameters of algorithms but the indirect parameters retrieved by Bisht’s and Moran’s algorithm [36, 38]. The improvement of Rn and Gs retrieval algorithms is helpful to the improvement of RSLE. In our study, the Bisht’s algorithm under clear sky [36] is selected as Rn retrieval algorithm. Considering the widespread cloud, Bisht’s algorithm under all sky [65] can be chosen to broaden applications. Besides, the accuracy of retrieved Rn is especially unsatisfactory in arid nonvegetated region [36]. It is suitable to replace the retrieved Rn by the observation directly measured by the Clouds and the Earth’s Radiant Energy System (CERES) project [66]. CERES’s accuracy meets the demand of Rn input in the region of desert [67, 68]. For Gs, because of the subtle temporal variation of NDVI in the arid region, Gs retrieved by Moran’s algorithm varies slightly. Thus, some more sensitive algorithm can be chosen for Gs, such as the Gs retrieval algorithm in SEBS model or in the way of thermal inertia [19, 27].
AT and the dew point temperature are derived from the atmospheric profile data of MYD07 in our study. They are not the values at the near-surface but the values of the atmospheric profile nearest to the surface. It is evident that the more accurate atmospheric information contributes to the retrieve of Rn and LE. So the other Earth observations with the high accuracy (e.g., the Goddard Earth Observing System Model, Version 5 (GEOS-5)) are optional substitutions [69]. For LST and LSE, they are derived from the MYD11 in the split-windows algorithm [54]. Wan et al. [70] have reported that just the average of bands 31 and 32 emissivities could lead to an overestimation of LSE, especially in arid and semiarid region. Accordingly, LST is underestimated in these regions. The MYD21 C6 is estimated to be published in 2016, and it can supply the more accurate LST and LSE based on TES algorithm [71], especially in the arid and semiarid region. That means the remarkable improvement of Rn and LE retrieve if we replace MYD11 by MYD21.
Other datasets with a higher spatial and temporal resolution can be also used to retrieve LE, such as NDVI and albedo products. In our study, the NDVI/albedo is assumed to be invariant in 16/8 days. There is a way to improve the temporal consistency by using other NDVI and albedo products with 1 km and 5-day resolution [72–74]. Furthermore, the correction based on digital elevation models should be considered in the region with undulant surfaces [31, 75].
6. Conclusions
NP approach provides a novel but simple method to estimate LE. In our study, NP approach attempts to develop a LE retrieval algorithm under clear sky which primarily uses remote sensing information and eliminates the need for ground information as model input, by using various land and atmospheric data products available from MODIS. The validation of retrieval result and the exploration of error sources were analyzed in succession.
At the temporal and spatial scales, the result of RSLE is within a reliable range. At the retrieve moment, RSLE is generally accurate. The instantaneous RSLE is underestimated with bias, R2, RE, and RMSE values of −49.64 W/m2, 0.32, 11.97%, and 144.20 W/m2, respectively. At the site scale, RSLE is in relatively good accuracy at all sites, with R2 = 0.11~0.76, bias = −222~49 W/m2, RE = 9~49%, and RMSE = 68~240 W/m2. Nevertheless, the accuracy of RSLE is unsatisfactory at orchard and village sites. In view of error source, in arid nonvegetated region, the dominant error contributions (causing 40 W/m2 error of RSLE) are Rn, Gs, LST, and AT. In vegetated region, the input errors are not the dominant error sources of RSLE. In order to improve the accuracy of RSLE, some improvement recommendations of input parameters can be considered in the future. The future research work would aim to improve the accuracy of LE estimation.
Competing Interests
The authors declare that they have no competing interests.
Acknowledgments
This work is supported by the National Natural Science Foundation of China (no. 91125004). The authors thank the Cold and Arid Regions Science Data Center at Lanzhou for providing observation data (http://westdc.westgis.ac.cn) and the LAADS for providing MOIDS products (http://ladsweb.nascom.nasa.gov). They also thank Professor Liu S. M. and Dr. Xu Z. W. for their kind assistance in providing field data and help in field visit.


