Mechanism and Kinetics Study for Photocatalytic Oxidation Degradation: A Case Study for Phenoxyacetic Acid Organic Pollutant
Abstract
Photocatalysis is a rapidly expanding technology for wastewater treatment, including a wide range of organic pollutants. Thus, understanding the kinetics and mechanism of the photocatalytic oxidation (PCO) for degradation of phenoxyacetic acid (PAA) is an indispensable component of risk assessment. In this study, we demonstrated that the central composite design (CCD) coupled with response surface methodology (RSM) was successfully employed to probe the kinetics and mechanism of PCO degradation for PAA using an efficient zinc oxide (ZnO) photocatalyst. In our current case study, four independent factors such as ZnO dosage, initial concentration of PAA, solution pH, and reaction time on the PCO degradation for PAA were examined in detail. Based on our results obtained from RSM analyses, an efficient pathway leading to the high degradation rate (>90%) was applying 0.4 g/L of ZnO dosage with 16 mg/L of concentration of PAA at pH 6.73 for 40 minutes. The experimental results were fitted well with the derived response model with R2 = 0.9922. This study offers a cost-effective way for probing our global environmental water pollution issue.
1. Introduction
Lately, global warming poses one of the most serious threats to the global environment ever faced in human history, especially water pollution. One of the major water pollutants is the use of pesticides and herbicides in agricultural fields that created severe environmental issue, which are considered a wide variety of persistent organic pollutants introduced into the natural water resources or wastewater treatment systems. In fact, the release of the persistent organic structure with toxicity property may cause negative effects on the environment and human health as the persistent organic structure compounds are very toxic and chemically stable and resist biodegradation [1–4]. The control of persistent organic pollutants in our natural water resources or wastewater treatment systems is an important issue. It is a well-known fact that PAA is a parent molecule for herbicides and pesticides for weed control. In particular, the discharge of this PAA effluent into the natural water resources or wastewater treatment systems is undesirable. This is due to PAA possess various bioactivities, including anticancer, antitumor, analgesic, anti-inflammatory, inhibition of plant growth process and antimicrobial, which are harmful to human health [5–7]. Thus, PAA was selected as the model pollutant in our kinetics and mechanism study of direct oxidation organics in order to create a green and healthy living environment for our next generation.
In recent years, advanced oxidation processes (AOPs) system has attracted great interest from science community as the most promising way to solve the environmental problems, especially getting rid of residual dyes pollutants and mineralization and detoxification of various organic pollutants from wastewater stream [8–11]. In this manner, AOPs system is considered to be an ideal green environmental solution to realize our green economy future. In the field of photocatalysis today, ZnO-mediated heterogeneous photocatalyses have received increased interest due to their capability in degrading numerous kinds of contaminants into carbon dioxide and water [12–14]. Furthermore, ZnO catalysts emerged as the leading candidate in photocatalysis and appeared as a potential photocatalyst due to low cost, easy availability, excellent chemical stability, nontoxicity in nature, and high initial rate of activities [15, 16]. Moreover, ZnO is relatively cheaper and is able to absorb a wide range of UV spectrum compared to that of titanium dioxide (TiO2) [17].
Several researchers have reported the removal of PAA from aqueous media by utilizing the titanium dioxide as the photocatalyst through conventional study [4, 18, 19]. However, an obvious hindrance to the widespread use of TiO2 as a photocatalyst in this way is that it is time consuming and not cost-effective as more experiments need to be carried out in PAA removal if changing one parameter while fixing other processing parameters at constant value. Making intuitive guesses on their optimum processing parameters is more or less impossible, and a focused research on the area is a very challenging task. In this case study, response surface methodology (RSM) was applied in optimizing photocatalytic oxidation of various organics. This method is more practical by taking into account the interactive effects among the process parameters and could determine the optimal experimental conditions accurately with minimum labours [20, 21].
To the best of our knowledge, PAA removal using ZnO photocatalyst is still lacking at current stage. The optimization of PAA via multivariate approach has been developed in our case study. In this work, central composite design coupled with response surface study was adopted to optimize four process parameters, namely, ZnO loading, initial concentration of PAA, solution pH, and reaction time on the photocatalytic degradation of PAA. The kinetics and mineralization of PAA will be investigated and its possible photocatalytic degradation mechanism was proposed.
2. Experimental
2.1. Materials
Phenoxyacetic acid (C8H8O3, 99% purity) was obtained from Sigma Aldrich. Zinc oxide (ZnO, 99% purity) was obtained from Merck. NaOH and HNO3 obtained from Merck were used to adjust the pH of the reaction medium. All reagents were of analytical grade and were used without further purification. Deionized water was used for the preparation of all aqueous solutions.
2.2. Photocatalytic Degradation of Phenoxyacetic Acid
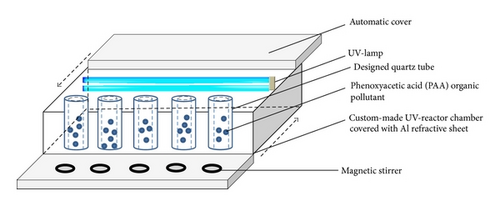
2.3. Response Surface Methodology
| Parameters | Unit | Symbol | Range | ||||
|---|---|---|---|---|---|---|---|
| −2 | −1 | 0 | +1 | +2 | |||
| ZnO loading | g/L | A | 0.20 | 0.30 | 0.40 | 0.50 | 0.60 |
| Initial concentration of PAA | mg/L | B | 10.00 | 15.00 | 20.00 | 25.00 | 30.00 |
| Solution pH | C | 5.00 | 6.00 | 7.00 | 8.00 | 9.00 | |
| Reaction time | min | D | 10.00 | 20.00 | 30.00 | 40.00 | 50.00 |
3. Results and Discussion
3.1. Multivariate Regression Analysis
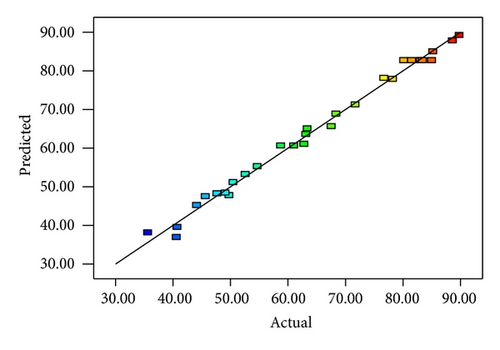
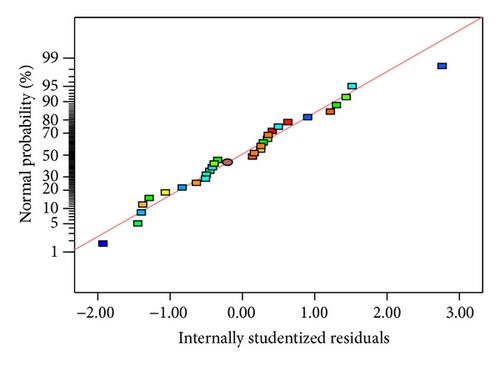
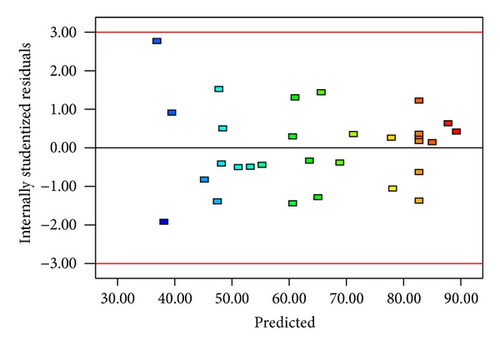
A total of 30 sets of batch experiments were carried out via CCD based on response surface methodology to investigate the interaction between the main and studied operational factors. Table 2 shows the experimental and predicted values of photocatalytic degradation of PAA under designed conditions. The adequacy of the model was further evaluated through analysis of variance (ANOVA) statistics (F-test, t-test, adjusted R2, and lack-of-fit) and the results are depicted in Table 3 [22]. The ANOVA of the derived response model indicates that the model is highly significant, as the F-value is 135.49 with p value < 0.0001. This implies that there is only 0.01% chance that a Model F-value could occur due to noise. The lack-of-fit F-value of 1.75 confirms that the lack-of-fit is not significant. There is a 27.96% chance that a lack-of-fit F-value could occur because of noise. The nonsignificant lack-of-fit suggests that the model is precise enough for model prediction. The low coefficient of variation of 3.17 revealed high precision of the model and the experiment results are reliable. Meanwhile, the significance of the model is supported by its R2 value of 0.9922 and adjusted R2 value of 0.9848. The R2 value should be close to 1, which implies that the experimental data fitted well with the model [25]. Adequate precision measures the signal to noise ratio, where a ratio greater than 4 is desirable. In this model, the value of 36.091 indicates an adequate signal, which can be used to navigate the design space. The coefficient of regression model and its significance for photocatalytic degradation of PAA is shown in Table 4.
| Standard | Point type | Experimental parameters | PAA degradation | ||||
|---|---|---|---|---|---|---|---|
ZnO loading (g/L) |
Initial concentration of PAA (mg/L) | Solution pH | Reaction time (min) | Experimental (%) |
Predictive (%) |
||
| 1 | Factorial | 0.30 | 15.00 | 6.00 | 20.00 | 63.13 | 63.58 |
| 2 | Factorial | 0.50 | 15.00 | 6.00 | 20.00 | 54.68 | 55.27 |
| 3 | Factorial | 0.30 | 25.00 | 6.00 | 20.00 | 40.72 | 39.52 |
| 4 | Factorial | 0.50 | 25.00 | 6.00 | 20.00 | 35.59 | 38.14 |
| 5 | Factorial | 0.30 | 15.00 | 8.00 | 20.00 | 71.73 | 71.27 |
| 6 | Factorial | 0.50 | 15.00 | 8.00 | 20.00 | 63.36 | 65.60 |
| 7 | Factorial | 0.30 | 25.00 | 8.00 | 20.00 | 45.64 | 47.49 |
| 8 | Factorial | 0.50 | 25.00 | 8.00 | 20.00 | 47.66 | 48.21 |
| 9 | Factorial | 0.30 | 15.00 | 6.00 | 40.00 | 78.24 | 77.90 |
| 10 | Factorial | 0.50 | 15.00 | 6.00 | 40.00 | 68.37 | 68.88 |
| 11 | Factorial | 0.30 | 25.00 | 6.00 | 40.00 | 52.58 | 53.24 |
| 12 | Factorial | 0.50 | 25.00 | 6.00 | 40.00 | 50.47 | 51.14 |
| 13 | Factorial | 0.30 | 15.00 | 8.00 | 40.00 | 85.22 | 85.03 |
| 14 | Factorial | 0.50 | 15.00 | 8.00 | 40.00 | 76.71 | 78.12 |
| 15 | Factorial | 0.30 | 25.00 | 8.00 | 40.00 | 61.03 | 60.64 |
| 16 | Factorial | 0.50 | 25.00 | 8.00 | 40.00 | 58.74 | 60.65 |
| 17 | Axial | 0.20 | 20.00 | 7.00 | 30.00 | 44.12 | 45.22 |
| 18 | Axial | 0.60 | 20.00 | 7.00 | 30.00 | 40.58 | 36.92 |
| 19 | Axial | 0.40 | 10.00 | 7.00 | 30.00 | 89.82 | 89.27 |
| 20 | Axial | 0.40 | 30.00 | 7.00 | 30.00 | 49.76 | 47.75 |
| 21 | Axial | 0.40 | 20.00 | 5.00 | 30.00 | 49.09 | 48.43 |
| 22 | Axial | 0.40 | 20.00 | 9.00 | 30.00 | 67.53 | 65.63 |
| 23 | Axial | 0.40 | 20.00 | 7.00 | 10.00 | 62.77 | 61.04 |
| 24 | Axial | 0.40 | 20.00 | 7.00 | 50.00 | 88.65 | 87.81 |
| 25 | Center | 0.40 | 20.00 | 7.00 | 30.00 | 80.16 | 82.74 |
| 26 | Center | 0.40 | 20.00 | 7.00 | 30.00 | 83.22 | 82.74 |
| 27 | Center | 0.40 | 20.00 | 7.00 | 30.00 | 83.05 | 82.74 |
| 28 | Center | 0.40 | 20.00 | 7.00 | 30.00 | 81.55 | 82.74 |
| 29 | Center | 0.40 | 20.00 | 7.00 | 30.00 | 85.02 | 82.74 |
| 30 | Center | 0.40 | 20.00 | 7.00 | 30.00 | 83.41 | 82.74 |
| Source | Sum of squares | DF | Mean square | F value | p value | |
|---|---|---|---|---|---|---|
| Model | 7981.60 | 14 | 570.11 | 135.49 | <0.0001 | Significant |
| Residual | 63.12 | 15 | 4.21 | |||
| Lack-of-fit | 49.07 | 10 | 4.91 | 1.75 | 0.2796 | Not significant |
| Pure error | 14.05 | 5 | 2.81 | |||
| R2 = 0.9922 | Adj. R2 = 0.9848 | |||||
| C.V. = 3.17 | Adeq. precision = 36.091 |
| Factor | Coefficient estimate | Degree of freedom | Standard error | F value | 95% confidence interval low | 95% confidence interval high | p value |
|---|---|---|---|---|---|---|---|
| Intercept | 82.74 | 1 | 0.84 | — | 80.95 | 84.52 | — |
| A | −2.07 | 1 | 0.42 | 24.55 | −2.97 | −1.18 | 0.0002 |
| B | −10.38 | 1 | 0.42 | 614.58 | −11.27 | −9.49 | <0.0001 |
| C | 4.30 | 1 | 0.42 | 105.44 | 3.41 | 5.19 | <0.0001 |
| D | 6.69 | 1 | 0.42 | 255.43 | 5.80 | 7.58 | <0.0001 |
| AB | 1.73 | 1 | 0.51 | 11.39 | 0.64 | 2.82 | 0.0042 |
| AC | 0.53 | 1 | 0.51 | 1.05 | −0.57 | 1.62 | 0.3216 |
| AD | −0.18 | 1 | 0.51 | 0.12 | −1.27 | 0.91 | 0.7332 |
| BC | 0.069 | 1 | 0.51 | 0.018 | −1.02 | 1.16 | 0.8942 |
| BD | −0.15 | 1 | 0.51 | 0.088 | −1.24 | 0.94 | 0.7712 |
| CD | −0.14 | 1 | 0.51 | 0.074 | −1.23 | 0.95 | 0.7895 |
| A2 | −10.42 | 1 | 0.39 | 707.31 | −11.25 | −9.58 | <0.0001 |
| B2 | −3.56 | 1 | 0.39 | 82.46 | −4.39 | −2.72 | <0.0001 |
| C2 | −6.43 | 1 | 0.39 | 269.23 | −7.26 | −5.59 | <0.0001 |
| D2 | −2.08 | 1 | 0.39 | 28.11 | −2.91 | −1.24 | <0.0001 |
3.2. Response Surface Analysis
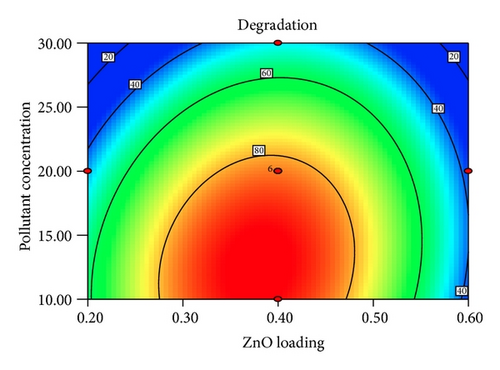
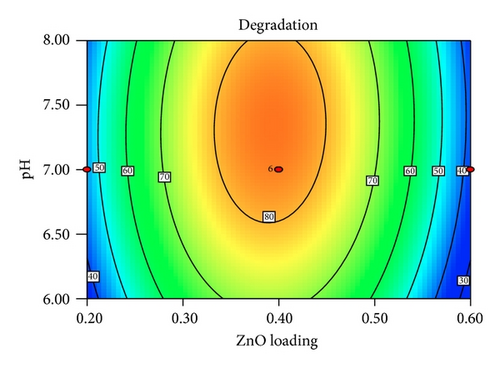
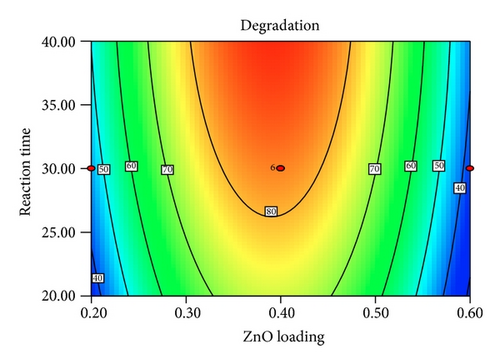
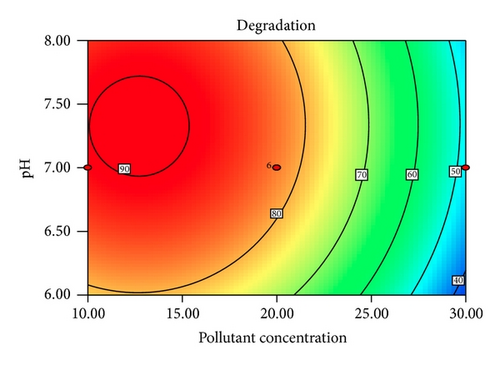
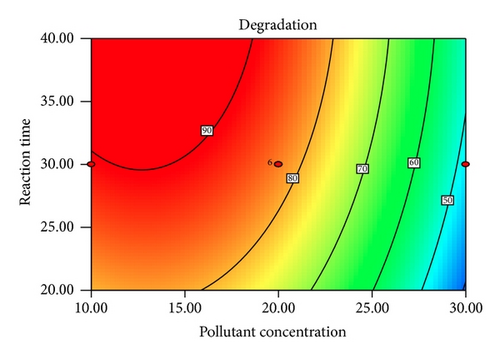
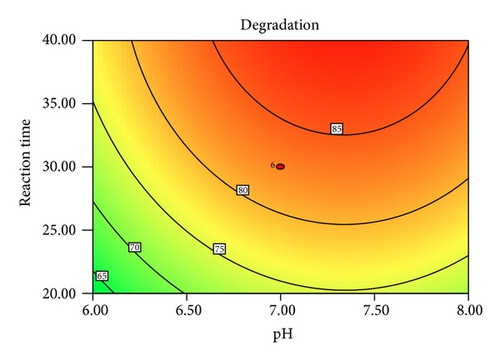
Figure 5 shows the interaction effects of amount of ZnO loaded, initial concentration of PAA, pH of the solution, and irradiation duration on the degradation efficiency of PAA. From the contour plot, it can be seen that the removal of PAA increased with increasing ZnO loaded up to 0.4 g/L and then gradually decreased at higher loadings. When the amount of ZnO increases above its optimum mass, the penetration of UV light into the reaction medium was reduced due to screening effect [31]. The decrement in the photodegradation efficiency may also result from the particle agglomeration, which reduces the active sites on the ZnO catalysts that have been exposed to UV illumination [32]. It is obvious that the degradation percentage decreased as the initial concentration of PAA increased. This is based on the fact that, as the concentration of PAA increases, the demand of oxidizing species such as •OH and • also increases in order to photodegrade more molecules of PAA that adsorbed on the catalyst surface. However, the number of hydroxyl radicals available on the catalyst surface is insufficient to photodegrade PAA at higher concentrations as the amount of catalyst loaded, light intensity, and irradiation duration are fixed [33]. The rapid formation of degraded products during the photocatalytic reaction may compete for the hydroxyl radicals at higher concentration of PAA, which reduces the photodegradation efficiency as well [34]. It has been reported that the pH of the reaction medium has an impact on the electrostatic interaction between a catalyst surface, solvent molecules, substrate, and charged radicals formed during the photodegradation process [35]. The protonation and deprotonation of PAA molecules and ZnO catalyst surface could occur either in acidic or in alkaline conditions. Therefore, the ZnO surface is positively charged below 9.0 and the surface of PAA is negatively charged above 3.12 (pKa of PAA = 3.12). Hence, optimum photodegradation efficiency was observed at pKa < pH < pHzpc. This is due to the electrostatic interaction enhancement between the positively charged ZnO surface and the negatively charged of PAA, which increased the photodegradation efficiency [36, 37]. The duration of exposure to UV irradiation also played a significant role in photodegrading PAA. The percentage of degradation increased with longer exposure duration, due to more photoinduced holes, and hydroxyl radicals will be generated, which facilitates the removal of PAA molecules [38].
3.3. Model Verification and Confirmation Test
The goal of a photocatalytic degradation reaction is to achieve greater degradation efficiency. Table 5 lists the optimization goal of each of the studied independent variables. Consequently, 5 sets of experiments were carried out to verify the derived response surface model according to the Design Expert software and the experimental and predictive results were shown in Table 6. As shown in Table 6, the experimental values were very close to the results predicted by the response surface software, which indicated that the developed model was reliable in optimizing the photocatalytic degradation of PAA.
| Independent variables | Goal | Lower limit | Upper limit | Importance |
|---|---|---|---|---|
| ZnO loading (g/L) | In the range | 0.30 | 0.50 | 3 |
| Initial concentration of PAA (mg/L) | In the range | 15.00 | 25.00 | 3 |
| Solution pH | In the range | 6.00 | 8.00 | 3 |
| Reaction time (min) | In the range | 20.00 | 40.00 | 3 |
| Run | ZnO loading (g/L) | Initial concentration of PAA (mg/L) | Initial solution pH | Reaction time (min) | Experimental (%) | Predictive (%) |
|---|---|---|---|---|---|---|
| 1 | 0.40 | 17.00 | 7.93 | 39.00 | 89.54 | 90.13 |
| 2 | 0.40 | 17.00 | 7.12 | 36.00 | 90.36 | 90.45 |
| 3 | 0.40 | 19.00 | 7.21 | 39.00 | 90.15 | 89.92 |
| 4 | 0.40 | 16.00 | 6.73 | 40.00 | 92.29 | 91.47 |
| 5 | 0.40 | 15.00 | 7.01 | 32.00 | 90.78 | 90.49 |
3.4. Kinetics Analysis and Total Organic Carbon Removal of PAA
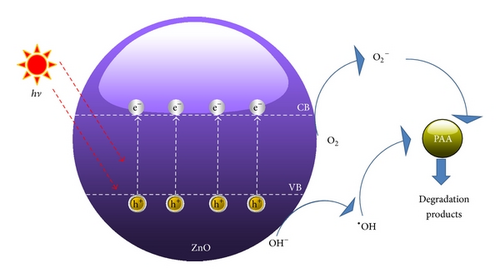
3.5. Proposed Photocatalytic Degradation of PAA by UV/ZnO System
4. Conclusion
In summary, the PCO of PAA was carried out by ZnO photocatalyst under UV-A irradiation. Modelling of PAA photodegradation was performed via CCD coupled with RSM. The derived response surface model successfully optimized four process parameters, namely, amount of ZnO loaded, initial concentration of PAA, pH of the solution, and irradiation duration. More than 90% of PAA was degraded under optimized conditions of 0.04 g ZnO loaded, 16 mg/L PAA, and solution pH of 6.73 in 40 minutes. In this study, the initial concentration of PAA was the most significant factor that affects the photodegradation of PAA.
Conflict of Interests
The authors declare that there is no conflict of interests regarding the publication of this paper.
Acknowledgment
The authors would like to thank University of Malaya for funding this research work under University of Malaya Research Grant (UMRG: RP022-2012A).


