Rice Husk Supported Catalysts for Degradation of Chlorobenzenes in Capillary Microreactor
Abstract
Chlorinated organic pollutants are persistent, toxic, and ubiquitously distributed environmental contaminants. These compounds are highly bioaccumulative and adversely affect the ozone layer in the atmosphere. As such, their widespread usage is a major cause of environmental and health concern. Therefore, it is important to detoxify such compounds by environment friendly methods. In this work, rice husk supported platinum (RHA-Pt) and titanium (RHA-Ti) catalysts were used, for the first time, to investigate the detoxification of chlorobenzenes in a glass capillary microreactor. High potential (in kV range) was applied to a reaction mixture containing buffer solution in the presence of catalyst. Due to high potential, hydroxyl and hydrogen radicals were produced, and the reaction was monitored by gas chromatography-mass spectrometry. The main advantage of this capillary reactor is the in situ generation of hydrogen for the detoxification of chlorobenzene. Various experimental conditions influencing detoxification were optimized. Reaction performance of capillary microreactor was compared with conventional catalysis. Only 20 min is sufficient to completely detoxify chlorobenzene in capillary microreactor compared to 24 h reaction time in conventional catalytic method. The capillary microreactor is simple, easy to use, and suitable for the detoxification of a wide range of chlorinated organic pollutants.
1. Introduction
Rice husk (RH) is an agricultural waste and the ash contains about 92–95% silica (SiO2). It is highly porous with lightweight and high surface area. Many publications reported the use of rice husk ash as catalyst support for metals [32]. HDC processes can be performed in batch reactors for small and medium-scale processes and/or continuous-flow reactors for large-scale processes. A glass capillary-based microreactor (as shown in Figure 1(a)) was fabricated for this study and the glass is chemically inert, optically clear, and nonporous, hence making it a suitable material [33, 34]. The present study investigates detoxification of chlorinated aromatic compounds over silica-platinum and silica-titanium supported catalysts under mild condition by using buffered solutions in a capillary microreactor.

2. Experimental
2.1. Materials
Platinum chloride (PtCl2) used as the source of platinum and titanium dioxide (TiO2) as the source of titanium were purchased from Merck, Darmstadt, Germany. Other materials used are nitric acid (65% purity), sodium hydroxide pellets (99%), and acetone (99.5%) (Sigma-Aldrich, St Louis). Cetyltrimethylammonium bromide (CTAB, 98%) and methylene blue were purchased from Sigma Aldrich. Rice husk (RH) was obtained from a rice milling company in Penang. A 100 ppm standards of 1,2-dichlorobenzene (1,2-DCB), 3-dichlorobenzene (1,3-DCB), 1,4-dichlorobenzene (1,4-DCB), 1,2,4-trichlorobenzene (1,2,4-TCB), hexachlorobenzene (HCB) and benzene (Sigma-Aldrich, ≥99.0%) were prepared.
2.2. Preparation of the Catalysts
30 g of clean rice husk was stirred with 750 mL of 1.0 M HNO3 at room temperature for 24 h. The cleaned RH was washed with copious amount of distilled water to constant pH, then dried in an oven at 100°C for 24 h, and burned in a muffle furnace at 600°C for 6 h so as to obtain white rice husk ash (RHA) [32]. About 3.0 g of RHA was added to 350 mL of 1.0 mol L−1 NaOH in a plastic container and stirred for 24 h at room temperature to get sodium silicate solution. About 3.6 g of CTAB (1 : 1.2, Si : CTAB molar ratio) was added into the sodium silicate solution and stirred to dissolve completely. This solution was titrated with 3.0 mol L−1 HNO3 at a rate of ca. 1.0 mL min−1 with constant stirring until pH 3.0. The resulting gel was aged for 5 days, then filtered and washed thoroughly with distilled water, and finally washed with acetone. The gel was dried at 110°C for 24 h, ground to fine powder, and calcined at 500°C in a muffle furnace for 5 h and then labeled as RHA-silica powder. Same procedure was followed for the preparation of RHA-silica solution of 10 wt.% Pt of PtCl2 which was dissolved in 50 mL of 3 mol L−1 HNO3 and titrated. Similarly, solution of 10.0 wt.% Ti of TiO2 was dissolved in 50 mL of 3 mol L−1 HNO3 and titrated. The resulting gels were treated as described above. The resulting powders were labeled as RHA-Pt and RHA-Ti, respectively.
2.3. Catalysts Characterization
The prepared RHA-Pt and RHA-Ti samples were characterized using Fourier transform infrared (FTIR) spectroscopy, N2 adsorption-desorption analysis, Field-Emission Scanning Electron Microscope (FESEM), and energy dispersive spectrometry (EDX).
2.4. HDC Reaction in a Capillary Microreactor
The capillary microreactor was used for studying the detoxification of chlorinated organic compounds. Several glass capillary microreactores (7 cm, 14 cm, and 21 cm) were designed for the HDC reaction as shown in Figure 1(a). The capillary microreactor and reservoirs A and B were filled with 2.5 mmol of buffer solution of different pH (2, 7 and 10) and 12.5 mg of catalyst and 100 μL of the mixture standard (8270 MagaMix) were introduced into the capillary microreactor at the reservoir A. Platinum wires were used as the electrodes and high voltage (1–5 kV) was applied. No air bubbles were found inside the capillary tube during the reaction. A reaction potential (1–5 kV) and 200 μA current were applied to reservoir A, while reservoir B was connected to ground. HDC reaction was carried out at room temperature and ambient pressure, all experiments were repeated three times, to get more accurate results, and the reaction time was controlled manually. The basic arrangement of the capillary microreactor, in which the experimental studies for the detoxification of chlorinated organic compounds were carried out, is depicted in Figure 1(a). The setup of the capillary microreactor system is composed of a high voltage power supply, glass capillary microreactor, and platinum wires.
2.5. Catalytic Hydrodechlorination (HDC) by Conventional Method
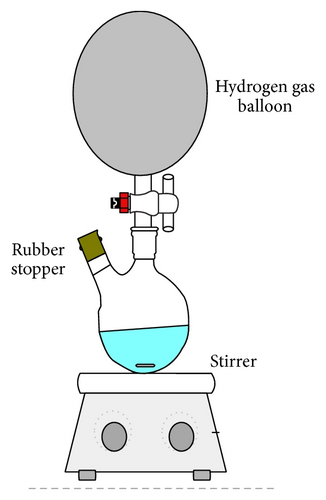
HDC reactions of 8270 MagaMix with molecular hydrogen gas were carried out at room temperature and ambient pressure by using buffered solutions in a round bottom flask. Hydrogen was introduced by balloon (Figure 1(b)). In a typical HDC procedure, 10 mL of buffer solution was spiked with 100 ppm chlorobenzenes, and 50 mg of supported Pt catalyst RHA-Pt, or 50 mg of RHA-Ti was added [2]. The mixture was magnetically stirred at 100 rpm with a stirring bar and after the desired time (2 h, 16 h, 24 h), the samples reaction mixtures were collected, and separated by 1.5 mL heptane for 5 min. The identification and quantification of all CBs was performed by GC-MS, and catalytic conversion was calculated by analyzing the peak areas of the target compounds. The setup is displayed in Figure 1(b). The buffer solutions used in the HDC reactions were prepared as follows: (a) phosphate buffer: phosphoric acid H3PO4 (2 mol L−1) was added to a solution of K2HPO4 (2 mol L−1) until the pH reaches 2; (b) phosphate buffer: a solution of NaH2PO4 (0.021 mol L−1) was added to a solution of Na2HPO4 (0.029 mol L−1) until the pH reaches 7; (c) borate buffer: a solution of sodium tetraborate (0.013 mol L−1) was added to a solution of NaOH (0.018 mol L−1) until the pH reaches 10.
3. Result and Discussion
3.1. Catalysts Characterization
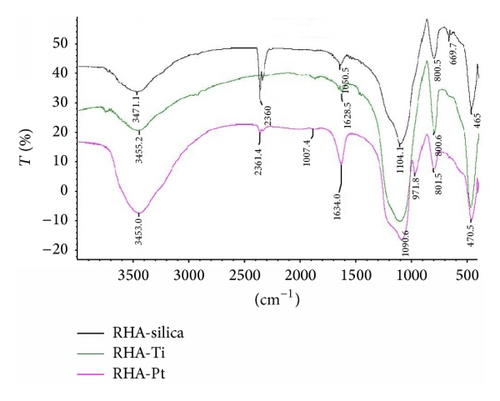
The FT-IR analysis was carried out in Nicolet 6700 FT-IR using the KBr pellet method. Figure 2 shows the FT-IR spectra of the catalysts RHA-Ti and RHA-Pt and RHA-SiO2 obtained in the wavenumber range 400–4000 cm−1. The broad band in the range 3471–3455 cm−1 is due to the stretching vibration of O–H bonds in Si–OH and the HO–H of water molecules adsorbed on the materials surface. The band at 1628–1650 cm−1 is due to the bending vibration of H2O trapped in the silica matrix. The band around 1104 cm−1 was shifted to a lower wavenumber for metal incorporated RHA. The band at 1090–1104 cm−1 is attributed to asymmetric Si–O–Si stretching vibration, from the structural siloxane bond. The band at 971.8 cm−1 can be attributed to the symmetric stretching vibration of Si–OH [32]. The intensity of this peak decreased in RHA-Ti and appears as a shoulder. This might indicate that some metal ions are attached on the surface of the silica as Si–O–M from the original Si–O–H or Si–O–Si silica structure. The absorption bands at about 465 cm−1 and 470.5 cm−1 are due to Si–O–Si bending vibrations [32]. The bands at 800–802 cm−1 are due to the deformation and bending modes of Si–O–Si.
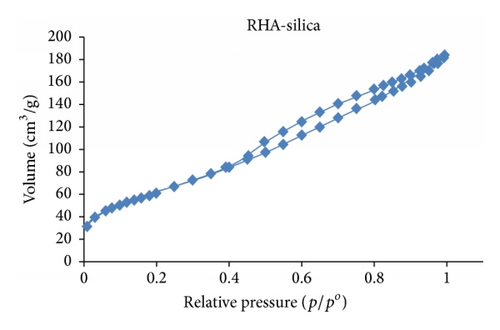
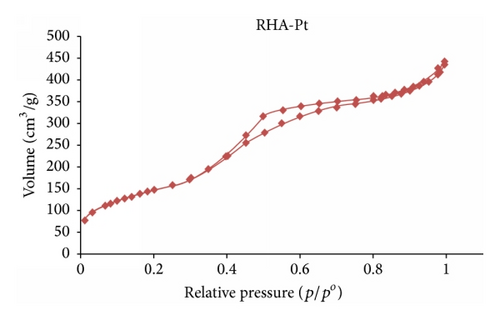
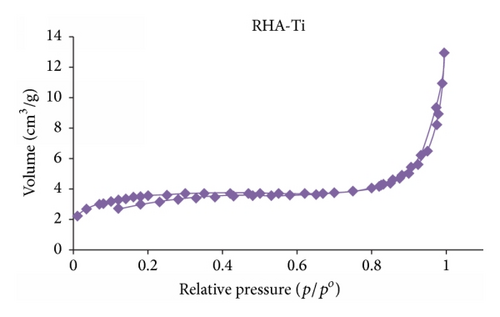
The specific surface area, pore volume, and pore size distribution of the prepared catalysts were determined using N2 adsorption-desorption on a Micromeritics ASAP 2020 volumetric instrument. Nitrogen sorption isotherms were performed at liquid nitrogen temperature (−195.786°C). The N2 adsorption-desorption isotherm of RHA-silica, RHA-Pt, and RHA-Ti is shown in Figure 3. The surface area, pore diameter, and pore volume were calculated using Barrett-Joyner-Halenda model and the results are displayed in Table 1. The average mesopore size was, for all catalysts, around 4 to 4.85 nm. We see that RHA-silica has high surface area of 225.4306 m2/g while RHA-Ti catalyst has associated BET surface area and pore volume of 12.6548 m²/g and 0.012738 cm³/g, respectively. The incorporation of Ti into silica reduced its surface area and pore volume compared to RHA-silica due to the pore blocking by the agglomerated particles [35]. However, in the RHA-Pt supported catalyst, the incorporation of Pt into silica matrix increased its surface area (538.0725 m²/g) and pore volume (0.637532 cm³/g) compared to those of the support RHA-silica. This could be good dispersion of Pt particles within the silica matrix [32].
| Catalyst | BET surface area (m2/g) | Pore volume (cm3/g) | Average pore size (nm) |
|---|---|---|---|
| RHA-silica | 225.4306 | 0.273179 | 4.84725 |
| RHA-Pt | 538.0725 | 0.637532 | 4.73938 |
| RHA-Ti | 12.6548 | 0.012738 | 4.02638 |
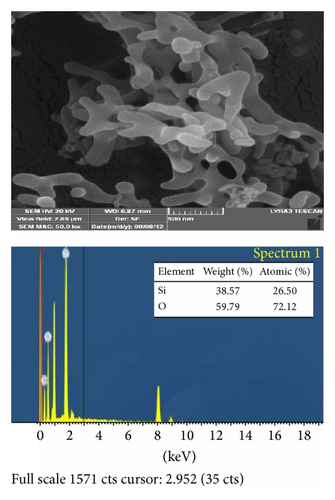
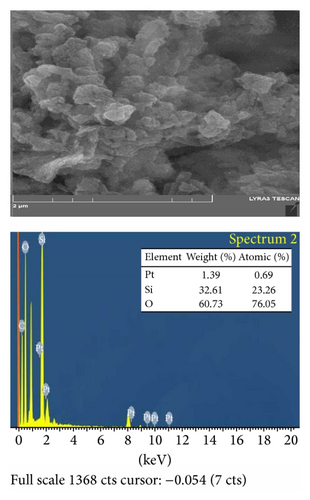
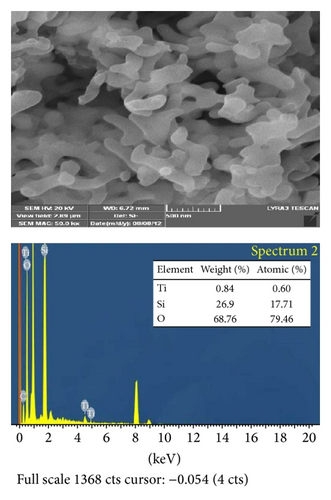
Field-Emission Scanning Electron Microscope (FESEM) (Tescan Lyra-3) was used to investigate the surface morphology and the general morphological features of the prepared RHA-silica and RHA-Pt nanoparticles. The EDX measurements were also used to confirm the percentage and the atomic ratio of the components in the prepared catalyst. Figure 4 shows the FESEM and EDX images of (a) RHA-silica sample, (b) RHA-Pt, and (c) RHA-Ti. The RHA-silica particles have flakes structure whereas the RHA-Pt particles have spherical structure with porous surfaces. While the RHA-Ti particles have rod-like morphology and less porous surfaces compared to RHA-silica.
3.2. Detoxification of COCs Using Capillary Microreactor
To optimize the HDC reactions in the capillary microreactor, analytical factors like applied potential, reaction time, length of the capillary, and pH of buffer solution were investigated to determine the most favorable reaction conditions. Temperature was kept constant at room temperature throughout the reactions. The results were then compared with those of the conventional method. The identification and quantitative results were determined from GC-MS data.
3.2.1. Effect of Reaction Time
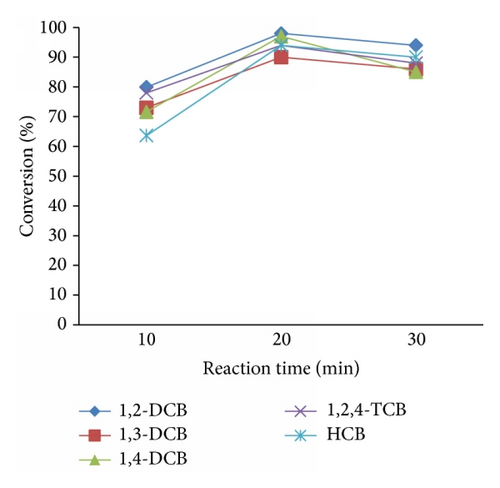
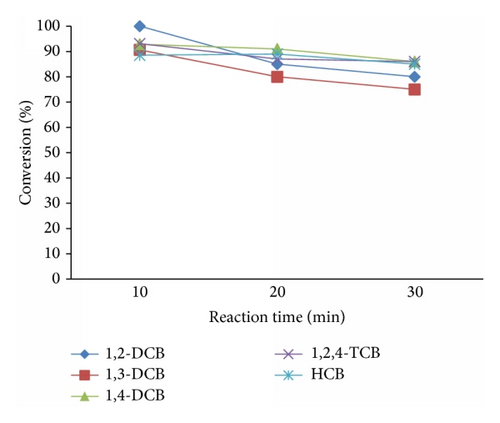
Reaction time is one of the most important factors in the HDC reactions. Therefore, various reaction times (10 min, 20 min, and 30 min) were applied. The reaction time was controlled manually; Figure 5 shows the conversion percentage of CBs with respect to these times. The dechlorination increases with the increase in reaction time up to 20 min, by using RHA-Pt catalyst (Figure 5(a)), while the best time for the dechlorination of CBs by using RHA-Ti as catalyst was 10 min (Figure 5(b)).
3.2.2. Applied Potential
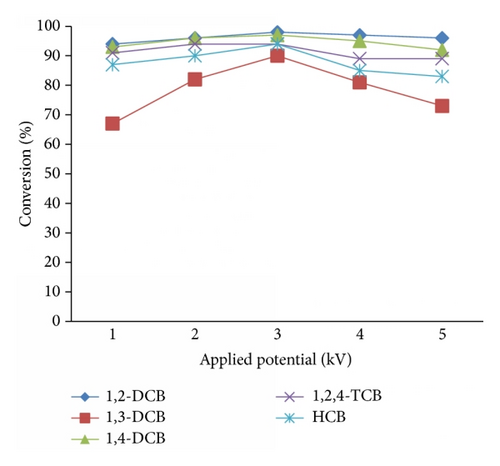
In order to achieve a high detoxification of COCs, different potentials were applied in the range of 1–5 kV at a constant current of 200 μA. Figure 6 shows the influence of the applied potential on the HDC reactions. As can be seen, a maximum detoxification of COCs by both catalysts (RHA-Pt and RHA-Ti) was obtained by using 3 kV. In a glass capillary microreactor, high potential (in kV range) was applied to create in situ generation of hydrogen as well as to expedite the activation of catalysts for the detoxification of chlorobenzene. Moreover, the higher applied potential increases the analyte interaction with the catalyst particles and enhances the hydrodechlorination (HDC) reaction to detoxify chlorobenzene [33, 34].

3.2.3. Length of the Capillary Microreactor
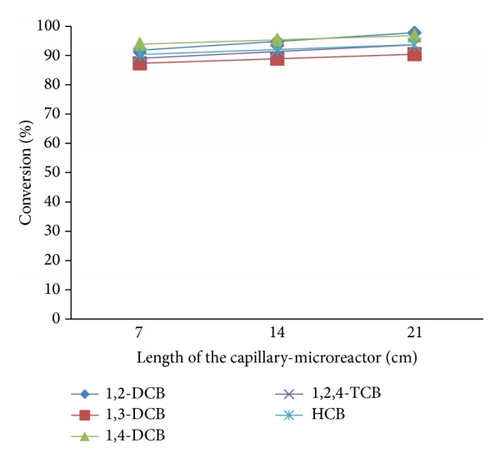
We have reported in a previous study that for microdevices, using an electrophoretic separation at constant field, resolution is proportional to the square of the channel length [33]. Various lengths (7 cm, 14 cm, and 21 cm) of the capillary were studied and significant improvement was obtained in the dechlorination of CBs when the length of the capillary was increased from 7 cm to 21 cm as shown in Figure 7.
3.2.4. Reaction pH
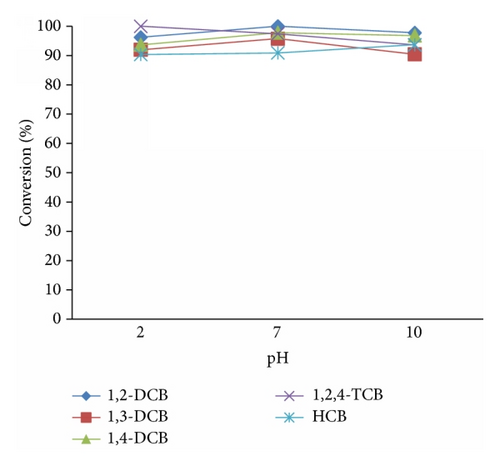
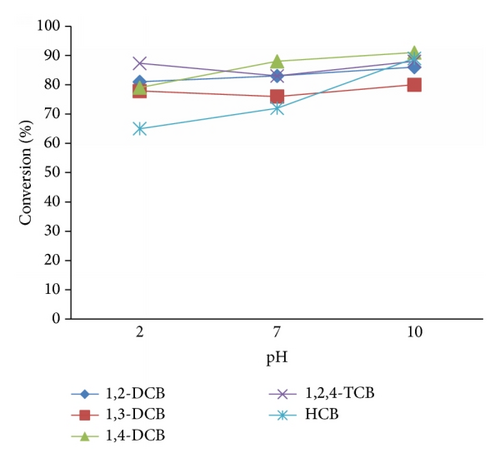
The pH of the solution is an important parameter which controls the rate of the dechlorination of CBs and CPs in the capillary microreactor. The pH values of the solution studied were 2.0, 7.0, and 10. The conversions of CBs and CPs by catalytic HDC in the capillary microreactor by different buffer solutions are used to neutralize the HCl which forms during the HDC reaction. Figure 8 shows the conversion of COCs involving different catalysts. The maximum conversion by using RHA-Pt catalyst was observed in the neutral range (pH 7) compared to other buffer solutions. This might be due to the dissolution of platinum particles [26]. However, when RHA-Ti was used as catalyst, the maximum conversion was obtained in alkaline range (pH 10).
3.2.5. Quantitative Determination of Detoxification of COCs Using Microreactor with GC-MS Compared to Conventional Method
In order to evaluate the most favorable reaction conditions, the optimum dechlorination conditions were set as follows: reaction time of 20 min, and pH 7 when using RHA-Pt as the catalyst and 10 min applied potential of 3 kV was used with a 21 cm long capillary microreactor, and pH 7 when the catalyst was RHA-Ti. The results are summarized in Table 2. Compared with conventional detoxification method, the capillary microreactor provided high conversion ratios of CBs in shorter reaction time (20 min) with very little amount of the reactants.
| Catalyst | Method | |||||||
|---|---|---|---|---|---|---|---|---|
| Glass capillary microreactor | Conventional method | |||||||
| RHA-Ti | RHA-Pt | RHA-Pt | RHA-Ti | |||||
| 10 min | 20 min | 2 h | 16 h | 24 h | 2 h | 16 h | 24 h | |
| Compound name | ||||||||
| 1,2-DCB | 100 | 98 | 38 | 95 | 99 | 56 | 97 | 97 |
| 1,3-DCB | 91 | 90 | 29 | 92 | 96 | 52 | 91 | 95 |
| 1,4-DCB | 93 | 97 | 35 | 93 | 97 | 50 | 95 | 100 |
| 1,2,4-TCB | 93 | 94 | 28 | 90 | 96 | 48 | 100 | 99 |
| HCB | 89 | 94 | 25 | 87 | 92 | 42 | 88 | 95 |
In a glass capillary microreactor, high potential (in kV range) was applied to cause in situ generation of hydrogen as well as to expedite the activation of catalysts in the reaction for the detoxification of chlorobenzene. Moreover, the higher applied potential increases the analyte interaction with the nanoparticles and enhances the hydrodechlorination (HDC) reaction to detoxify chlorobenzene and chlorophenols. In our reactor, we believe that the electron density on the surface of the catalysts and the efficiency/performance of HDC reaction increase by the applied potential and thereby enhance conversion and dechlorination of CBs.
4. Conclusions
In this work, for the first time rice husk supported platinum (RHA-Pt) and titanium (RHA-Ti) catalysts were used to investigate the detoxification of chlorobenzenes in a glass capillary microreactor. RHA-Ti and RHA-Pt supported catalysts showed very interesting catalytic activity in the detoxification of chlorobenzenes in ambient conditions. The main advantage of capillary reactor is the in situ generation of hydrogen for the detoxification of chlorobenzenes. Only 20 min is sufficient when compared to 24 h reaction time in conventional method. The proposed method is simple, easy to use, and suitable for the detoxification of a wide range of chlorinated organic pollutants in environmental remediation applications.
Conflict of Interests
The authors declare that there is no conflict of interests regarding the publication of this paper.
Acknowledgment
The authors gratefully acknowledge the support provided by the King Abdul Aziz City for Science and Technology through the Science and Technology Unit at King Fahd University of Petroleum and Minerals for funding Project no. 13-ENE277-04, as a part of the National Science Technology and Innovation Plan.


