Tunnel Probabilistic Structural Analysis Using the FORM
Abstract
In this paper tunnel probabilistic structural analysis (TuPSA) was performed using the first order reliability method (FORM). In TuPSA, a tunnel performance function is defined according to the boundary between the structural stability and instability. Then the performance function is transformed from original space into the standard normal variable space to obtain the design point, reliability index, and also the probability of tunnel failure. In this method, it is possible to consider the design factors as the dependent or independent random parameters with arbitrary probability distributions. A software code is developed to perform the tunnel probabilistic structural analysis (TuPSA) using the FORM. For validation and verification of TuPSA, a typical tunnel example with random joints orientations as well as mechanical properties has been studied. The results of TuPSA were compared with those obtained from Monte-Carlo simulation. The results show, in spite of deterministic analysis which indicates that the rock blocks are stable, that TuPSA resulted in key-blocks failure with certain probabilities. Comparison between probabilistic and deterministic analyses results indicates that probabilistic results, including the design point and probability of failure, are more rational than deterministic factor of safety.
1. Introduction
Structural instability is the most dominant failure mechanism of underground openings in moderately jointed rock masses. Traditional analyses in such openings have been largely based on rock mass classification methods. Rock load [1], RQD [2], RSR [3], RMR [4], and rock tunneling quality index (Q) [5] are the most practical rock mass classifications. Despite the empirical effectiveness of these classifications, they largely ignored particular stability problem due to the formation of removable rock blocks around the tunnel walls.
Block instability is not necessarily dependent on any rock mass classifications. Block theory [6] provides a mathematical and geometrical procedure to define the stability of rock structures triggered by discontinuities geometry. For a number of joint intersections behind an excavation free face, block theory determines the combinations of joints half spaces which create a removable rock block, block geometry, probable sliding or falling direction, and the safety factor of block using a rigorous approach. Block theory method considers the rock mass and support properties as deterministic parameters. However, they improved our understanding of structural instability of tunnels, in spite of their assumptions, most of the geomechanical characteristics of rock masses such as discontinuities orientation and mechanical properties and also support properties vary in wide ranges.
Unlike the probabilistic stress-controlled instability analysis, few researches have been performed on probabilistic instability analysis of block failures in underground openings: [7–9]. On the other hand, in these cases, the analysis is limited to the specific case studies with limited random dimension or specific probability distributions. So far, there is no direct study on the probabilistic analysis of structural instability in underground openings. Therefore, in this research a tunnel probabilistic structural stability analysis (TuPSA) was developed using first order reliability method.
For this purpose, at first, the reliability problem and first order reliability method (FORM) are explained, and then the performance function for tunnel structural stability is presented. By combining these two definitions, tunnel probabilistic structural stability analysis (TuPSA) will be explained. A computer code is developed for reliability analysis of structural failures and performing the TuPSA method. The reliability problem of a typical tunnel example is solved by developing computer code assuming different scenarios. Finally, the results are compared to those obtained from Monte-Carlo simulations.
2. First Order Reliability Method (FORM)
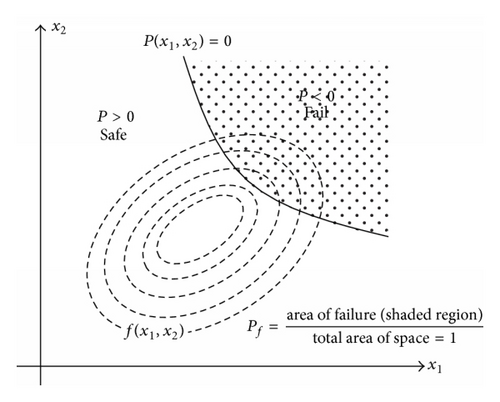
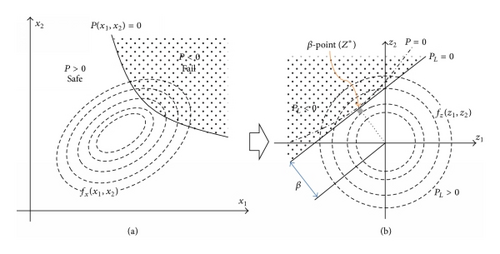
3. Tunnel Probabilistic Structural Stability Analysis (TuPSA)
- (i)
The blocks formed around the tunnel have maximum possible volume (considering the key blocks).
- (ii)
Specific falling/sliding blocks have no influence on other blocks’ stability.
- (iii)
Bolts are considered as the simple forces applied to the blocks in specific directions.
- (iv)
The influence of field stress on blocks stability [14] is not considered.
- (v)
The distribution of uncertain parameters is available.
- (1)
geometrical parameters:
- (a)
tunnel axis orientation: trend and plunge, TO,
- (b)
tunnel radius, r,
- (c)
joints orientation: joints dip and dip direction, JD,
- (a)
- (2)
mechanical parameters:
- (d)
cohesion of joints, Cj,
- (e)
friction angle of joints, φj,
- (f)
tensile strength of joints, Ten,
- (g)
water pressure on joints face, u,
- (h)
unit weight of rock mass, γ,
- (i)
unit weight of shotcrete, γs,
- (j)
shotcrete thickness, t,
- (k)
shotcrete shear strength, τs,
- (l)
bolts force pattern around the tunnel, Fb,
- (m)
seismic coefficient, K,
- (n)
seismic force direction, Sd.
- (d)
3.1. Removability Function
3.2. Key-Block Geometry Function
3.3. Factor of Safety Function
4. Typical Example
- (S1)
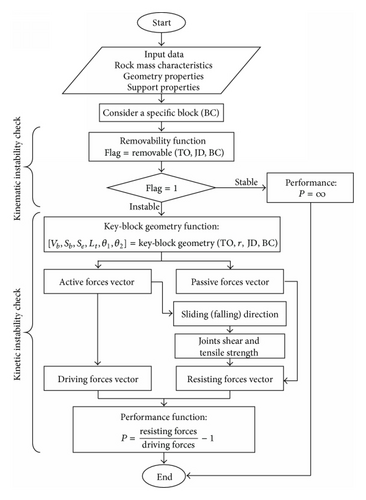
The parameters variability has no influence on the stability and only the mean values are effective in analysis. A deterministic safety factor and block performance were determined using the algorithm presented in Figure 3.
- (S2)
Only the joints strength parameters (C, φ, Ten) variability has an influence on the stability and these parameters are assumed as the independent variables.
- (S3)
It is similar to scenario 2, but with considering the effects of correlations between random variables.
- (S4)
Only the joints orientation parameters (DD1, D1, DD2, D2, DD3, D3) variability has an influence on the stability and these parameters are assumed as the correlated random variables.
- (S5)
All the joints properties (mechanical and geometrical properties) variability has an influence on the stability and these parameters are assumed as correlated random variables.
- (1)
Determine physical random vector using the standard normal variables.
-
Consider X = (C, φ, Ten, DD1, D1, DD2, D2, DD3, D3) as the physical random variables vector and Z = (z1, z2, …, z9) as the standard normal variables vector. The following steps are used to determine the translation function (X = g(Z) in (5)):
- (2)
Solve the nonlinear optimization problem of (5) by using the TuPSA computer code.
| Deterministic parameters | Probabilistic parameters | ||
|---|---|---|---|
| Parameter | Value | Parameter | Distribution |
| TTP | 0°, 0° |
/° |
Normal (μ = 30, σ = 5) |
| r | 2.5 m |
/° |
Normal (μ = 25, σ = 3) |
| u | 0 KPa | D2/° | Normal (μ = 55, σ = 7) |
| γ | 2.7 | DD2/° | Normal (μ = 110, σ = 5) |
| K | 0 | D3/° | Normal (μ = 70, σ = 4) |
| Support | No support | DD3/° | Normal (μ = 240, σ = 7) |
| C/KPa | Truncated normal (μ = 20, σ = 11) ≥0 | ||
| φ/° | Log-normal (μ = 30, CoV = 0.07) | ||
| Ten/KPa | Uniform ([0–8]) | ||
- ∗Di: dip of ith joint set; ∗∗DDi: dip direction of ith joint set.
| Variable | C | φ | Ten | DD1 | D1 | DD2 | D2 | DD3 | D3 |
|---|---|---|---|---|---|---|---|---|---|
| C | 1 | −0.5 | +0.8 | ||||||
| φ | −0.5 | 1 | −0.3 | 0 | |||||
| Ten | +0.8 | −0.3 | 1 | ||||||
| DD1 | 1 | 0.93 | 0.5 | −0.4 | −0.4 | −0.07 | |||
| D1 | 0.93 | 1 | 0.45 | −0.3 | −0.3 | −0.1 | |||
| DD2 | 0 | 0.5 | 0.45 | 1 | −0.7 | −0.5 | −0.1 | ||
| D2 | −0.4 | −0.3 | −0.7 | 1 | 0.3 | 0.2 | |||
| DD3 | −0.4 | −0.3 | −0.5 | 0.3 | 1 | 0.2 | |||
| D3 | −0.07 | −0.1 | −0.1 | 0.2 | 0.2 | 1 | |||
5. Results and Discussion
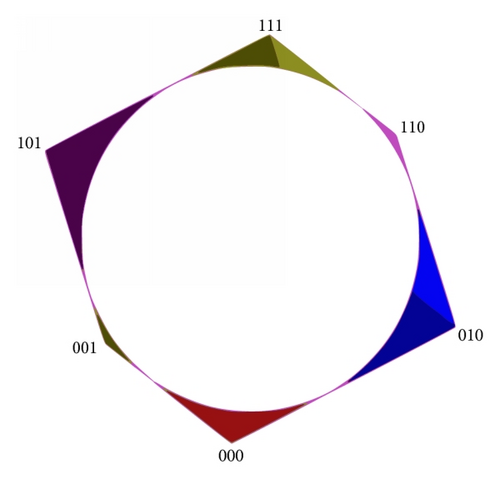
By deterministic stability analysis using the mean values of joints properties (scenario 1), six removable blocks have been found and analyzed using the kinematic and kinetic instability analysis. The position of these blocks around the circular tunnel has been illustrated in Figure 5. The performance function determination algorithm which is illustrated in Figure 3 has been used in this analysis. The results of key blocks removability, geometry, safety factor, and performance are presented in Table 3.
| Block code (BC) | Key-block geometry | FS | Performance (P) | |||
|---|---|---|---|---|---|---|
| Volume (vb) m3 | Joints area (Sb) m2 | Excavation face area (Se) m2 | Joints trace length (Lt) m | |||
| 0 0 0/UUU | 0.1906 |
|
1.3972 |
|
∞ (stable) | ∞ |
| 0 0 1/UUL ∗ | 0.0098 |
|
0.2768 |
|
47.08 | 46.08 |
| 0 1 0/ULU | 0.6032 |
|
2.5946 |
|
18.33 | 17.33 |
| 1 0 1/LUL | 0.6032 |
|
2.5946 |
|
3.05 | 2.05 |
| 1 1 0/LLU | 0.0098 |
|
0.2768 |
|
8.97 | 7.97 |
| 1 1 1/LLL | 0.1906 |
|
1.3972 |
|
1.05 | 0.05 |
- ∗UUL: key block created by combination of 1st and 2nd joints upper half spaces and 3rd joint lower half space (based on BTM; see [6]).
The probabilistic analysis using the TuPSA method has been carried out for scenarios 2–5 and the results are presented in Figures 6 and 7. Figure 6 illustrates the reliability index of each key block for different scenarios. Figure 7 illustrates the probability of each block failure for different scenarios. Note that the small probability of failures is illustrated in logarithmic scale. For validation, a Monte-Carlo simulation has been carried out for scenario 2. In the Monte-Carlo simulation, the number of iterations is selected so that, based on (3), the coefficient of variation of pf () becomes less than 0.1. A comparison between results of TuPSA method and Monte-Carlo simulation for scenario 2 is presented in Table 4.
| Block code (BC) | FORM analysis | Monte-Carlo simulation | ||||||
|---|---|---|---|---|---|---|---|---|
| Reliability index (β) | Probability of failure (pf) % | Calculation time (sec) ∗ | Function iterations | Iterations (~needed) | Probability of failure (pf) % | Simulation time (sec) ∗ (~needed) | Actual | |
| 0 0 0 | — | — | — | — | — | — | — | — |
| 0 0 1 | 3.838 | 6.19 × 10⁻³ | 10.6 | 58 | ~1.62 × 10⁶ | N-A ∗∗ | ~2.82 × 10⁵ | N-A |
| 0 1 0 | 10.320 | 2.76 × 10⁻²³ | 9.4 | 57 | ~6.61 × 1026 | N-A | ~1.15 × 1026 | N-A |
| 1 0 1 | 1.569 | 5.8 | 8.5 | 52 | 2000 | 5.5 | 348 | 0.093 |
| 1 1 0 | 2.021 | 2.17 | 9.7 | 52 | 5000 | 2.01 | 890 | 0.099 |
| 1 1 1 | 0.066 | 47.4 | 10.6 | 67 | 600 | 47.5 | 104.9 | 0.043 |
- ∗: calculation (simulation) time using a 2.67 GHz, core i5 processor.
- ∗∗: it is not possible to calculate in reasonable time period with ordinary processing units.
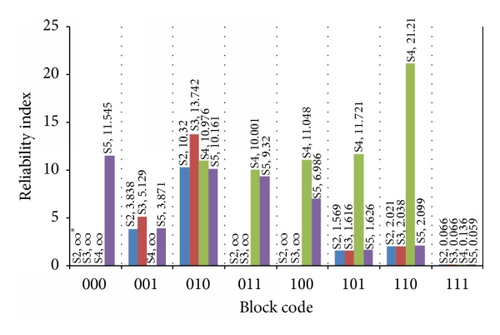
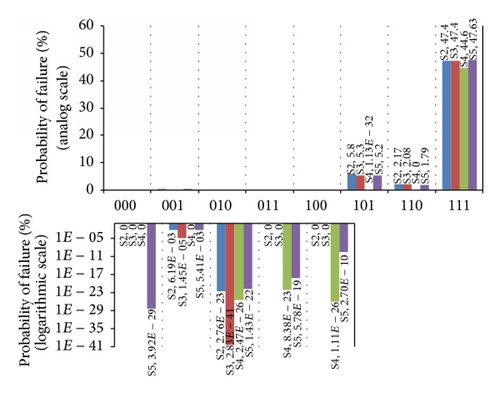
A comparison between reliability analysis using correlated and uncorrelated joint friction and cohesion strength (Figures 6-7) indicates that considering the negative correlation between joints friction and cohesion strength parameters reduces the probability of block failure and increases the tunnel reliability index.
As can be seen from Figures 6-7 (scenario 4), for the removable blocks with high safety factor (greater than 3), the variability of joints orientation has very little impact on the event of failure. By performing a comparison between scenarios 2, 3, and 4, it can be concluded that for these blocks the variability of strength parameters has a more effective role in failure events. By comparing scenarios 2, 3, and 4 for block [1 1 1], it can be concluded that, for the marginal blocks which have a low safety factor (between 1 and 2), both of the geometrical and strength variabilities are important, separately as well as together, in the failure event.
Table 4 illustrates the results of FORM analysis and the Monte-Carlo simulation for the assumed case study. Considering the running time and accuracy of results, it is clear that FORM is more efficient and more precise than ordinary Monte-Carlo simulation (in finite iterations). This fact is more evident when the probability of failure is too small and consequently it requires too many simulation iterations to evaluate accurate probability based on (3). Table 4 illustrates that, on the contrary to FORM analysis, the simulation iterations and simulation time increase when the probability of failure decreases.
6. Conclusions
A reliability-based design methodology for tunnel structural instability (TuPSA) is developed. Many sources of uncertainties can be modeled and analyzed in evaluating the probabilistic tunnel stability. The physical random variables are considered to have arbitrary probability distribution with any types of correlations. A combination of tunnel structural stability models and first order reliability method (FORM) has been used for reliability analysis of structural instabilities around the circular tunnels. In this method, by transforming the performance functions from the space spanned by physical random variables into the noncorrelated standard normal random variables space, the reliability index and probability of failure are calculated via optimization techniques.
A case study with five scenarios from deterministic to full probabilistic state is presented to show the implementation of the TuPSA model and to obtain an estimate of the target β-value for each removable key block. It is possible to replace factor of safety with the performance of tunnel considering the tunnel design goals. Comparison between probabilistic and deterministic analyses results indicates that probabilistic results, including the design point and probability of failure, are more rational than deterministic factor of safety. Comparison between the failure probabilities obtained from FORM and those obtained from Monte-Carlo simulations indicates that FORM is the most efficient reliability method and its accuracy is very high and more than sufficient.
Deterministic methods are the base of design and analysis in rock engineering. However, the reliability analysis presented in this paper demonstrates the applicability of the statistical and probabilistic analysis in problems dealing with uncertainties and variability. However reliability analysis could consider the effects of uncertainties in stability analysis, faced with the same problem as the deterministic approaches. Both of the deterministic and probabilistic analyses use the same failure models that may have inherent weaknesses.
Conflict of Interests
The authors declare that there is no conflict of interests regarding the publication of this paper.


