Effect of Process Parameter Optimization in Reducing Sintering Temperature in the Synthesis and Characterization of Ba(Zn1/3Nb2/3)O3
Abstract
Controlling the cooling rate during calcination and sintering, phase pure perovskite Ba(Zn1/3Nb2/3)O3 has been prepared by simple solid state reaction route with density >93% at relatively low sintering of 1175°C making it compatible for microwave dielectric applications. The samples are characterized by X-ray diffraction analysis and scanning electron microscopy. The X-ray diffraction shows pure perovskite phase with cubic structure. The lattice constants were obtained a = 4.1032 Å. Detailed studies of ε′ and ε′′ show that the compound exhibits dielectric anomaly at 430°C. Material shows distributed relaxation at higher temperature. Impedance analysis revealed that the impedance is mainly due to the grains. AC conduction activation energies are estimated from Arrhenius plots, and conduction mechanism is discussed.
1. Introduction
Ba(Zn1/3Nb2/3)O3 (BZN) is a very promising lead free perovskite material for electroceramics applications owing to its interesting dielectric properties. It can be used for various applications such as to the dielectric resonators [1–3]. Much research on BZN ceramics has been targeted to find alternate for the Ta-based complex perovskite ceramics such as Ba(Zn1/3Ta2/3)O3 and Ba(Mg1/3Ta2/3)O3 because of the expensive Ta2O5. One major problem in using BZN lies in the fact that it needs a high sintering temperature to reach a satisfactory final density ≈1350°C [4, 5]. Chemical processes such as sol-gel and precipitation method were also used to reduce the sintering temperature of the ceramics [6–8]. Sintering temperature of BZN ceramic can also be reduced by the use of additives such as B2O3 and CuO. However, BaB4O7 and BaB2O4 secondary phases were observed in the B2O3 added BZN [9]. Although the microwave dielectric properties of the BZN ceramic are very promising, the sinterability remains an issue.
In this work, we attempted the optimization of process parameters in simple solid state reaction route. We successfully prepared Ba(Zn1/3Nb2/3)O3 in pure perovskite phase with high density (>93%) at relatively low sintering temperature without using additives. This has been achieved by simply controlling the rate of cooling and heating during calcination and sintering. Structural, dielectric, and electrical impedance analyses of prepared BZN ceramics are investigated and compared with those reported earlier.
2. Experimental Procedure
Ba(Zn1/3Nb2/3)O3 was prepared by two-step solid state reaction route or columbite method. First, columbite structure was formed by prereacting Nb2O5 (99.9% Loba Chemie Pvt. Ltd., India) with ZnO (99.9% % Loba Chemie Pvt. Ltd., India) followed by calcination at 1100°C for 6 h. Calcined powder was then characterized by X-ray diffraction technique (Rigaku MiniFlex) with CuKα radiation, λ = 0.15418 nm. This material was then reacted with BaCO3 (99.5% Loba Chemie Pvt. Ltd., India), at 1125°C for 6 h. The fine and homogeneous powder was pressed into cylindrical pellets (10 mm diameter and 1-2 mm thickness) under a uniaxial pressure of 300 MPa using a hydraulic press. Polyvinyl alcohol (PVA) was used as a binder. The compacted pellets were fired first at 500°C to remove the binder and then sintered at 1150°C, 1175°C, 1200°C, and 1225°C for 6 h using controlled heating profile in a programmable muffle furnace. The sintered samples were electroded with silver paste and heated at 500°C for 1 hour before measurements were performed. The microstructure and grain size distribution of the sintered pellets were studied by scanning electron micrograph using JEOL JSM-5800 scanning electron microscope at 20 kV. The dielectric and impedance spectroscopic data were recorded using HIOKI 3532 LCR Hi TESTER impedance analyzer.
3. Results and Discussions
3.1. Structural and Micro Structural Studies
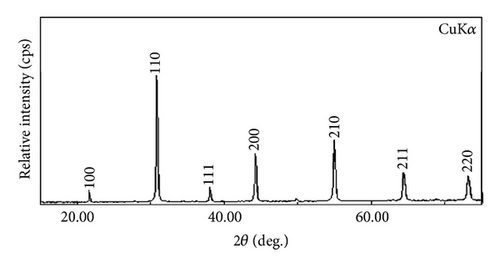
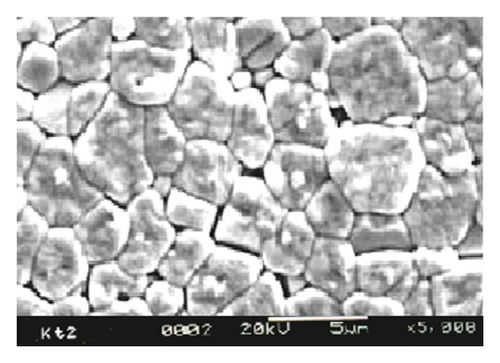
Figure 1 shows XRD patterns of Ba(Zn1/3Nb2/3)O3 samples calcined at 1125°C. With the observed interplanar spacing (dobs) of all the XRD peaks, unit cell parameters were obtained using a standard computer software POWD [10]. The unit cell with cubic crystal system was selected for which ΣΔδ = Σ(dobs − dcal) was minimum. The values of observed (dobs) and calculated (dcal) interplanar spacing, (hkl) indexing, and intensity are shown in Table 1. All major X-ray reflection peaks observed could be fitted satisfactorily in cubic perovskite phase with lattice constants a = 4.1032 Å. The calcined powders were sintered at different temperatures (1150°C, 1175°C, 1200°C, and 1225°C). Sintering is optimized which comes out as >93% of theoretical value. The estimated densities of pellets sintered at different sintering temperatures are shown in Table 2. The microstructure of the sintered pellets and distribution of grains over the sample surface were studied by scanning electron micrographs. The typical SEM micrograph of BZN is shown in Figure 2. Well-developed spherical grains of 2-3 μm are clearly visible.
| d spacing (obs.) | d spacing (cal.) | Intensity | h | k | l |
|---|---|---|---|---|---|
| 4.1021 | 4.1032 | 5 | 1 | 0 | 0 |
| 2.9015 | 2.9014 | 100 | 1 | 1 | 0 |
| 2.3687 | 2.3690 | 14 | 1 | 1 | 1 |
| 2.0512 | 2.0516 | 38 | 2 | 0 | 0 |
| 1.8357 | 1.8350 | 6 | 2 | 1 | 0 |
| 1.6751 | 1.6751 | 50 | 2 | 1 | 1 |
| 1.4511 | 1.4507 | 27 | 2 | 2 | 0 |
| 1.2974 | 1.2975 | 23 | 3 | 1 | 0 |
| Theoretical density of BZN is 6.522 gm/cm3 | ||||
|---|---|---|---|---|
| Sample | Calcination temperature (°C) | Sintering temperature (°C) | Experimental density gm/cm3 | % density |
| BZN | 1125 | 1150 | 4.9326 | 75.63 |
| 1125 | 1175 | 6.0796 | 93.21 | |
| 1125 | 1200 | 4.8722 | 74.70 | |
| 1125 | 1225 | 4.8134 | 73.80 | |
3.2. Dielectric Studies
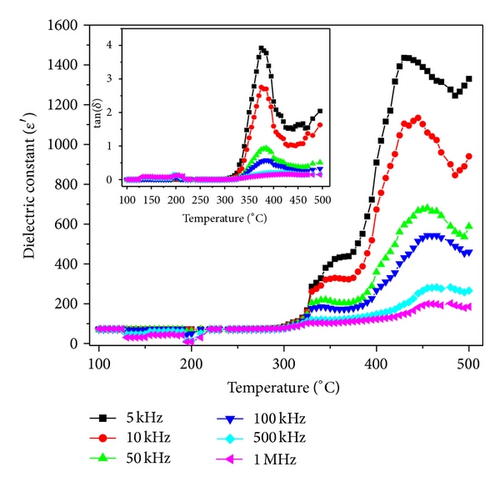
The temperature dependence of dielectric constant ε′ and tangent loss ((tanδ) in the inset) is depicted in Figure 3. The values of ε′ are stable in wide temperature range, associated with low dielectric losses. As the temperature increases, ε′ starts increasing, and a peak evolves at around 430°C. The increase in dielectric response with temperature may be due to interfacial polarization dominating over dipolar polarization [11]. The observed peak may be attributed to ionic conduction mechanism being dominant at high temperature in BZN.
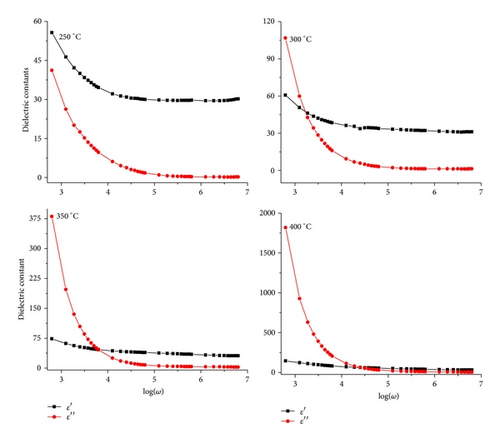
The frequency dependence of real (ε′) and imaginary (ε′′) parts of dielectric constant at different temperatures in the temperature range (250–400°C) is shown in Figure 4. The value of ε′ is slightly higher (60) than ε′′ (40) at 250°C. As the temperature increases, both ε′ and ε′′ values increase; the curves intersect at 700 Hz (at 250°C). The intersecting frequency shifts towards higher frequency as temperature increased (10 kHz at 400°C). The high ε′ values may be interpreted as the accumulation of charges at the interface between the sample and electrode, that is, space charge polarization. The relatively higher values of ε′′ at low frequency suggest the free charge motion that may be related to AC conductivity relaxation [12].
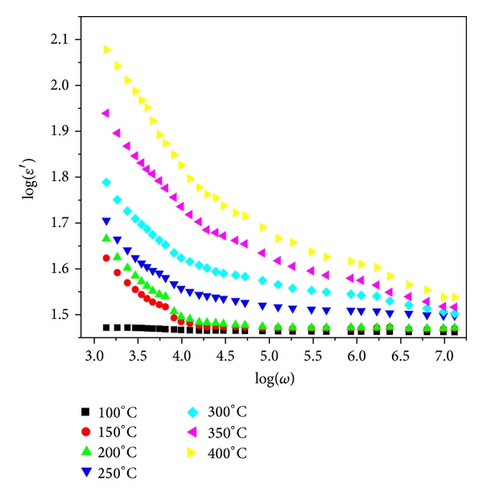

where ε∞ is the high frequency value of the dielectric constant, n(T) is the temperature dependent exponent, and a(T) determines the strength of the polarizability arising from the universal mechanism in question. A nonlinear fitting of dielectric data in (1) was used to obtain the values of parameters n(T) and a(T). The interaction between the charge carriers contributing to the polarization process is characterized by n(T); at low temperatures, n is almost 1, showing Debye-type relaxation (noninteracting dipoles). With increase in temperature, its value decreases and attains minimum at around 430°C (strongly interacting dipoles), and a(T) value increases with temperature showing the strength of polarizability increasing.
3.3. Impedance Studies
Impedance spectroscopy is frequently used to study the electrical properties of electroceramics because these materials have a variety of frequency dependent effects associated with heterogeneity. One of the main advantages of frequency dependent measurements is to separate contributions of the bulk, the grain boundaries, and electrode effects in the ceramics, if the time constants are different enough to allow separation [14].
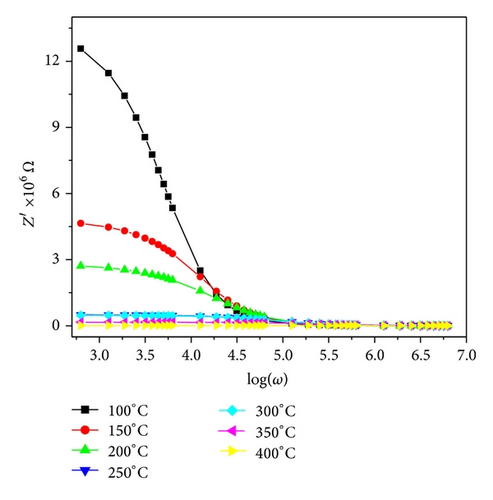
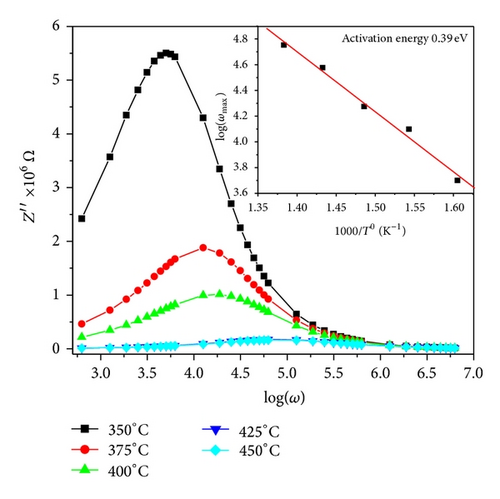
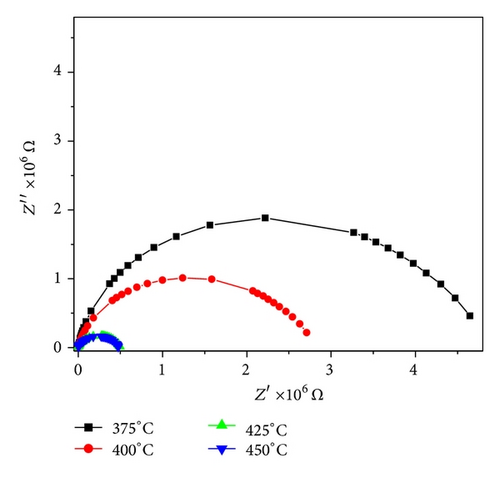
The calculated activation energy is 0.39 eV. The activation energy indicates less thermally activated charge carriers involvement. Figure 9 shows the complex impedance spectrum (i.e., Nyquist plot (i.e., Z′′ versus Z′)) at different temperatures. A single semicircular arc of Figure 9 confirms that the impedance is mainly due to the grains [16, 17]. The depressed arc shows the nonuniform grain distributions.
3.4. AC Electrical Conductivity Studies
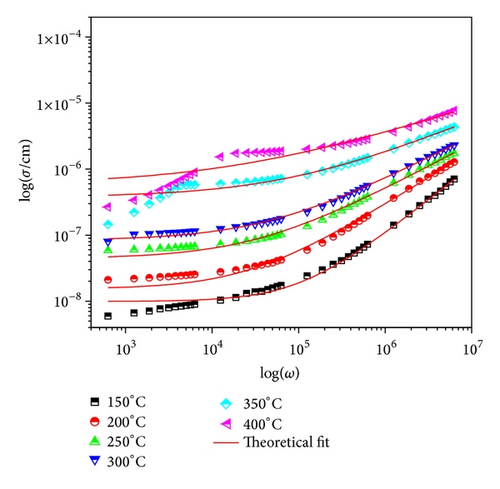
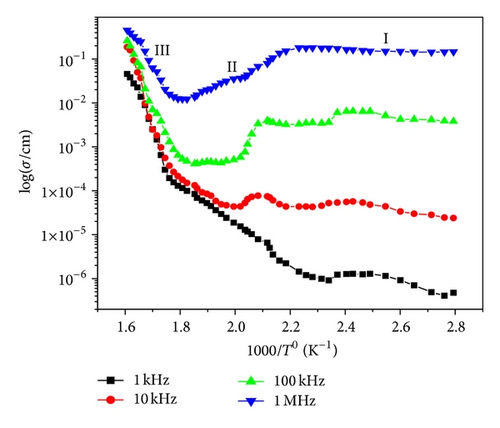
Figure 10 shows the variation of AC conductivity with frequency at different temperatures. The frequency dependence AC conductivity may arise due to free as well as bound carriers. In the present material, AC conductivity increases with an increase in frequency. Therefore it must be related to the bound carriers trapped in the sample, indicating the dispersion of conductivity with frequency. With increase in temperature dispersion in conductivity narrow all, the curves for different frequencies appear to merge at higher temperatures. The conductivity could be fitted through the expression σac = σdc + Aωn, known as Jonscher’s law [18], where A is a thermally activated quantity and n is the frequency dependent exponent that takes values <1. The data were fitted using the above relation, and the calculated values of σdc, A, and n are shown in Table 3. This indicates that the conduction process is a thermally activated phenomenon. Temperature dependence of AC conductivity of material is shown in Figure 11. The change in slope of conductivity plots (Figure 11) suggests that it can be divided into three regions, which are (i) 50–150°C, (ii) 175–325°C, and (iii) 350–450°C. The conductivity of the material is found to be independent from temperature (at lower temperature), independent part of curve increases with increase in frequency. The main contribution to the conductivity in this region may result from space charge. As temperature increases, space charges are released and recombined, and hence curves almost merge at region (III). The activation energy values in the system have been calculated from the slope of the graph (Figure 11) for three regions and are given in Table 4.
| Temperature (°C) | σac | A | n |
|---|---|---|---|
| 150 | 9.9 × 10⁻⁹ | 5.3 × 10⁻¹⁴ | 1.0 |
| 200 | 1.5 × 10⁻⁸ | 3.5 × 10⁻¹² | 0.8 |
| 250 | 4.4 × 10⁻⁸ | 3.0 × 10⁻¹¹ | 0.7 |
| 300 | 8.3 × 10⁻⁸ | 6.2 × 10⁻¹¹ | 0.6 |
| 350 | 3.7 × 10⁻⁷ | 7.9 × 10⁻¹⁰ | 0.5 |
| 400 | 5.8 × 10⁻⁷ | 8.4 × 10⁻⁹ | 0.4 |
| Frequency in (kHz) | Temperature range | ||
|---|---|---|---|
Activation energy (eV) 100°C to 175°C |
Activation energy (eV) 175°C to 275°C |
Activation energy (eV) 280°C to 380°C |
|
| 1 | 0.12 | 0.20 | 0.02 |
| 10 | 0.08 | 0.16 | 0.08 |
| 100 | 0.06 | 0.11 | 0.11 |
| 1000 | 0.01 | 0.08 | 0.22 |
4. Conclusions
Phase pure perovskite phase of BZN is stabilized through standard solid state reaction route by using controlled cooling rate during calcination and sintering. The crystal structure is cubic with unit cell parameter a = 4.1032 Å. The experimental density is >93%, and grain size is 1–3 μm. The dielectric dispersion results fitted with Jonscher’s dielectric dispersion formalism give coefficient a(T) and exponent n(T), which show non-Debye-type relaxation between the charge carriers at high temperatures. It shows that conducting charges and free charges both contribute to the dielectric relaxation in this material. Impedance spectroscopy is used to model the electrical properties of the material showing that the impedance is mainly due to the grains. AC conductivity exhibits dispersion at low frequencies and follows Jonscher’s power law. The charge in the exponent n in AC conductivity dispersion term (Aωn) shows the nature of conductivity mechanics. Charges from localized hopping to free ion motion with increase in temperature and that the conduction is a thermally activated process.
Acknowledgments
P. K. Bajpai would like to acknowledge Department of Science & Technology, Government of India, New Delhi, for the grants received under FIST Program and University Grants Commission, New Delhi, for Major Research Project Grant no. F-16/24-2004.


