Volume 2013, Issue 1 610310
Research Article
Open Access

Buoyancy Effect of Ionic Vacancy on the Change of the Partial Molar Volume in Ferricyanide-Ferrocyanide Redox Reaction under a Vertical Gravity Field

Yoshinobu Oshikiri

Corresponding Author

Yoshinobu Oshikiri

Yamagata College of Industry & Technology, Department of Environmental Engineering, 2-2-1, Matsuei, Yamagata, Yamagata 990-2473, Japan

Search for more papers by this author
Makoto Miura

Makoto Miura

Polytechnic College Akita, 6-1, Ohgida-michishita, Ohdate, Akita 017-0805, Japan

Search for more papers by this author
Ryoichi Aogaki

Ryoichi Aogaki

Polytechnic University, 2-20-12-1304, Ryogoku, Sumida-ku, Tokyo 130-0026, Japan t-kougei.ac.jp

Search for more papers by this author
First published: 25 March 2013
Citations: 4
Academic Editor: Shen-Ming Chen

Abstract

With a gravity electrode (GE) in a vertical gravity field, the buoyancy effect of ionic vacancy on the change of the partial molar volume in the redox reaction between ferricyanide (FERRI) and ferrocyanide (FERRO) ions was examined. The buoyancy force of ionic vacancy takes a positive or negative value, depending on whether the rate-determining step is the production or extinction of the vacancy. Though the upward convection over an upward electrode in the FERRO ion oxidation suggests the contribution of the positive buoyancy force arising from the vacancy production, the partial molar volume of the vacancy was not measured. On the other hand, for the downward convection under a downward electrode in the FERRI ion reduction, it was not completely but partly measured by the contribution of the negative buoyancy force from the vacancy extinction. Since the lifetime of the vacancy is decreased by the collision between ionic vacancies during the convection, the former result was ascribed to the shortened lifetime due to the increasing collision efficiency in the enhanced upward convection over an upward electrode, whereas the latter was thought to arise from the elongated lifetime due to the decreasing collision efficiency by the stagnation under the downward electrode.

1. Introduction

In electrochemistry, the density change in the solution during an electrode reaction gives rise to a gravitational convection [1]. Constant currents observed for hanging electrodes often come from the steady-state mass transfer by the gravitational convection under a parallel gravity field. As a force similar to gravitational force, centrifugal force often affects ionic transportation processes, for example, leading to thermodynamic emf generation [2] and bringing about hydrodynamic convection.

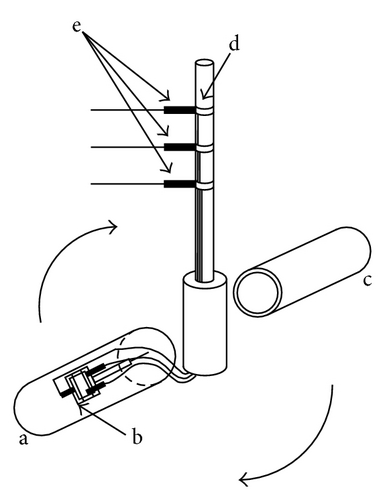
Gravity electrode (GE) is, as shown in Figure 1, operated in a high gravity field arising from a centrifugal force, which provides a great buoyancy force in the solution, promoting a gravitational convection. As shown in the theoretical analysis in Appendix, it was clarified that the buoyancy force comes from the change in the partial molar volume between product and reactant ions [3]. First, the effective density coefficient in the limiting diffusion (γ)lim  in an electrode reaction is measured. Then, from (A.33) in Appendix, the change in the partial molar volume ΔVG is calculated. On the other hand, in (A.30a) in Appendix, ΔVG is defined by the partial molar volumes of the product ion VP and reactant ion VR in the form of  . Reflecting the measurement of the diffusion current, is expressed by zRDR/(zPDP) in (A.30c) in Appendix, where zR and zP are the electron numbers without signs transferring between the reactant and product in the reaction, respectively. DR and DP are the diffusion coefficients of the reactant and product, respectively. Therefore, if  VP and VR are consistent with the equilibrium values, and measured by pycnometer (PM) mentioned later, the calculated value will agree with ΔVG. This is the blank test for the validity of the GE method. FERRO ion oxidation was actually performed, so that it was concluded that the data obtained by this method do not contain any other extra partial molar volumes and agree with thermodynamic data [4].
Details are in the caption following the image
Gravity electrode of vertical mode. a, the electrolysis cell; b, the electrodes; c, the counterbalance identical to the electrolysis cell; d, the rotor; e, metal brushes and lead wires electrically connected with a potentiostat.

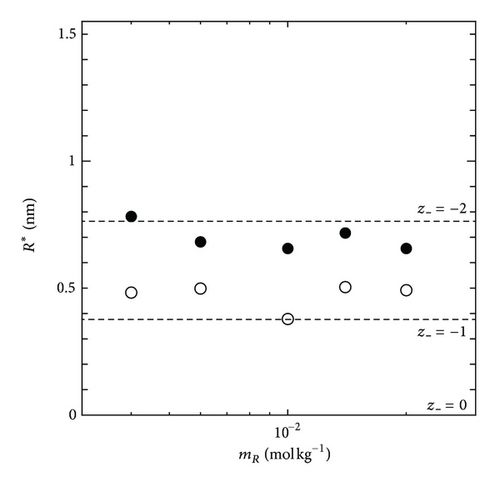
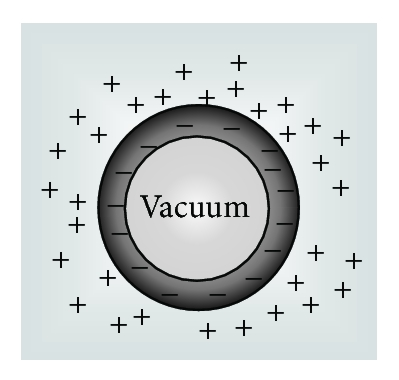
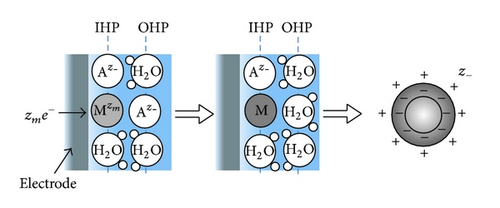
On the other hand, by using the GE method, as an extra component, the partial molar volume of ionic vacancy has been newly measured in copper electrodeposition [5, 6]. Figure 2 represents a schematic figure of the ionic vacancy; the center of an ionic vacancy is a charged vacuum void surrounded by an ionic cloud, and it has a size of the order of 0.1 nm. In Figure 3, it is shown that the measured radii of ionic vacancies agree well with the theoretical values. As shown in Figure 3, the vacancies created in cupric sulfate and cupric chloride solutions have −2 and −1 unit charges, respectively.
Details are in the caption following the image
Ionic vacancy [5, 6]. (a) structure. (b) formation process. , counter anion; , metallic ion; e, electron; IHP, inner Helmholtz plane; OHP, outer Helmholtz plane.
Details are in the caption following the image
Ionic vacancy [5, 6]. (a) structure. (b) formation process. , counter anion; , metallic ion; e, electron; IHP, inner Helmholtz plane; OHP, outer Helmholtz plane.
Details are in the caption following the image
Comparison of experimental data on the radius of ionic vacancy with theoretical calculations in copper electrodeposition [5, 6]. •, CuSO4  + 100 mol m−3 H2SO4 solution; ∘, CuCl2+ 100 mol m−3 KCl solution; z, the charge number of ionic vacancy; broken line, the theoretical value of the radius; R*, the radius of ionic vacancy; mR, the molality of the cupric salt.

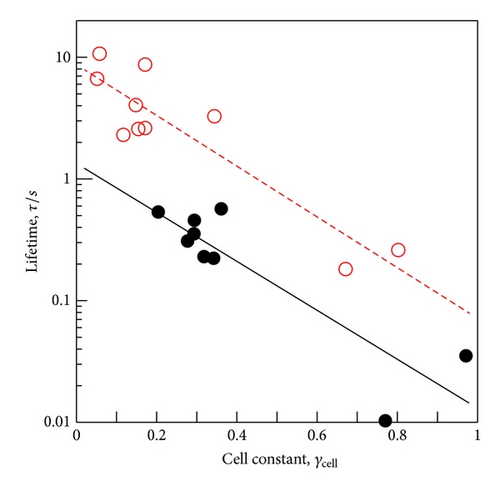
Recently, with a new electrode system called cyclotron magnetohydrodynamic (MHD) electrode (cyclotron MHDE), the lifetimes of ionic vacancies in some reactions have been measured, where the electrolyte solution together with ionic vacancies circulated along a pair of concentric cylinder electrodes in a vertical magnetic field [7]. The lifetime was measured from the circulating velocity. As a characteristic feature, the lifetime decreased with an increasing collision efficiency of ionic vacancies; copper depositions in magnetic fields from 1 T to 18 T lead to the vacancy lifetimes varying from 10 s to 0.1 s [7]. Though 10 times smaller than in the case of copper deposition, that is, 1 s to 0.01 s, in FERRI-FERRO redox reaction, the lifetime of ionic vacancy was also measured [8]. From these results, it was thought that there are two processes to determine the lifetime of ionic vacancy; one is the decay to the initial state, and the other is the conversion to nanobubble [7]. Here, nanobubble is the smallest type of bubble containing a gas. Recently, the formation process from ionic vacancies has been theoretically clarified [6]. Actually, in Figure 4, the plots of the lifetime τ against the cell constant γcell in copper deposition and FERRI-FERRO reaction are represented [7, 8], where γcell implies the collision efficiency of ionic vacancy [7]. For γcell = 0, the lifetime thus corresponds to the decay rate of ionic vacancy without collision, whereas for γcell = 1, it implies the formation time of nanobubble by collision of each vacancy. As will be discussed in the following, these experimental data elucidate the reason why by means of the GE method, ionic vacancy was observed in copper deposition, but not in FERRO ion oxidation; that is, the lifetimes in FERRO ion oxidation are too short to measure by the GE method. Since the time scale of the convection in GE is estimated of the order of 1 s or so, the GE method has the upper limit of the same order for the measurement.
Details are in the caption following the image
Lifetime of ionic vacancy in the redox reaction between FERRI and FERRO ions [7, 8]. τ, the lifetime; γcell, the cell constant of the cyclotron MHD electrode; •, FERRI-FERRO ion redox reaction in a 100 mol m−3 KCl solution; ∘, copper deposition in CuSO4  + 100 mol m−3 H2SO4 solution.
In a large amount of supporting electrolyte, the thermodynamic measurement such as pycnometer (PM) can determine the partial molar volumes of the individual ions in equilibrium state [3]. As a result, the validity and accuracy of the GE method to determine the change of the partial molar volume in an electrode reaction were ascertained by the PM method. The oxidation of FERRO ion to FERRI ion was first taken up as a test reaction
()
If there is no effect of ionic vacancy, as mentioned above, the change in the partial molar volume ΔVG measured by the GE method is equal to the equilibrium data ΔVpyc obtained by the PM method [3] as follows:
()
where
()
where is defined by (A.30c) in Appendix. and are the partial molar volumes of the product (FERRI ion) and reactant (FERRO ion) in equilibrium, respectively. Since at the same concentration, the density of the FERRO ion solution is higher than that of the FERRI ion solution, FERRO ion oxidation decreases the solution density. In a vertical gravity field, for a convection flow to occur, an upward electrode was thus chosen as the working electrode [4]. The data obtained by the GE method agreed with those of the PM method within a root mean square (rms) error of 1.48 × 10⁻⁵ m3 mol−1 [4]. Since, as will be mentioned later, the partial molar volume of ionic vacancy is estimated as the order of 10−4 m3 mol−1, this result assures that the partial molar volume of ionic vacancy cannot be observed in FERRO ion oxidation. However, an ionic vacancy is, as mentioned above, a kind of bubble made of a free vacuum space, so that when ionic vacancies are introduced to a large amount of solution, the total volume is expanded with a constant mass. From (A.14) in Appendix, this means that the buoyancy coefficient of ionic vacancy βV is positive, that is, the ionic vacancy production generates an upward buoyancy force, which accelerates the upward convection and decelerates the downward convection, resulting in the change in the partial molar volume.

In the present paper, in view of the lubricant effect of ionic vacancy, the convective-diffusion process in a vertical gravity field is first reexamined. Then, the change of the partial molar volume including ionic vacancy in a redox reaction is theoretically derived. Finally, the buoyancy effect of ionic vacancy in the redox reactions between FERRI and FERRO ions is experimentally examined.

2. Theoretical

2.1. Diffusion Current Equation including the Lubricant Effect of Ionic Vacancy

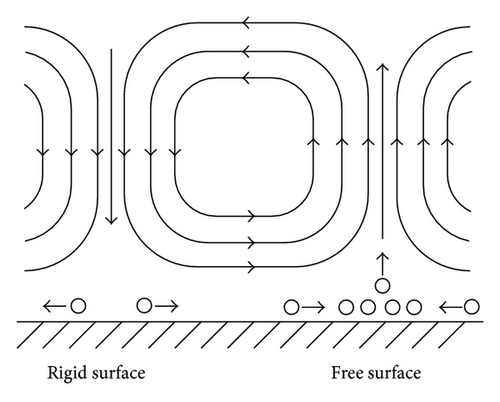
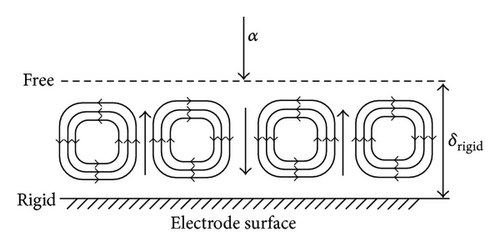
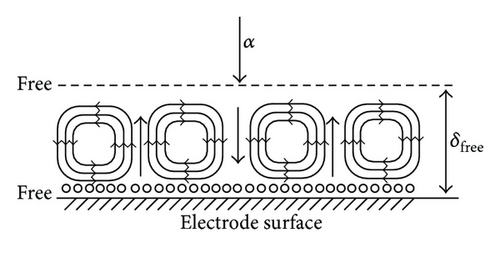
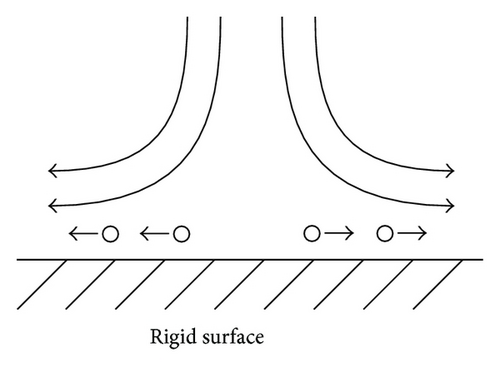
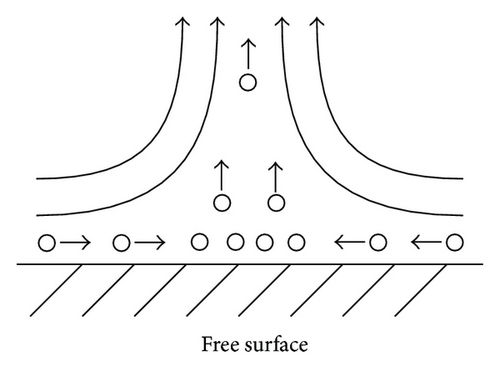
In the analysis of the chirality appearing in electrodeposition under a vertical magnetic field [10, 11], it has been clarified that ionic vacancy plays an important role of a lubricant [9, 12]. This is because ionic vacancy is easy to coalesce at electrode surface, so that the friction between the solution and the electrode is greatly decreased. As a result, two different kinds of surfaces emerge on an electrode surface, that is, surfaces covered without and with ionic vacancies, which are classified as rigid and free surfaces with and without friction, respectively. In the previous analysis of the convective-diffusion current under a high gravity field, however, we considered only a conventional rigid surface without ionic vacancies [13]. Figure 5 exhibits the formation processes of the free and rigid surfaces by ionic vacancies on an upward electrode; under the upward flow, following the stream lines, ionic vacancies are gathered to the center, covering the surface, whereas under the downward flow, they are swept away from the center, exposing the bare surface. Namely, the free and rigid surfaces arise from upward and downward flows, respectively. In Figure 6, a set of convection flows formed on the free and rigid surfaces is exhibited; the flow ascending from the free surface with ionic vacancies descends to the rigid surface without them. As discussed elsewhere [13], the convection in a vertical gravity field takes place between the electrode surface and the outer boundary of the convective-diffusion layer. Since the outer boundary provides the free surface, as shown in Figure 7, for the rigid electrode surface without ionic vacancies, the boundary conditions of the convection are consistent with those of rigid and free boundaries (Figure 7(a)), whereas for the free electrode surface completely covered with ionic vacancies, the conditions are given by two free boundaries (Figure 7(b)).
Details are in the caption following the image
Rigid and free surfaces formed by ionic vacancy [9]. (a), the rigid bare surface under a downward flow; (b), the free surface covered with ionic vacancies under an upward flow; ∘, ionic vacancy.
Details are in the caption following the image
Rigid and free surfaces formed by ionic vacancy [9]. (a), the rigid bare surface under a downward flow; (b), the free surface covered with ionic vacancies under an upward flow; ∘, ionic vacancy.
Details are in the caption following the image
A pair of upward and downward flows in a convection cell accompanied by ionic vacancy production. ∘, the ionic vacancy.
Details are in the caption following the image
Boundary conditions for the rigid and free surfaces on the upward electrode. (a), the case of a rigid surface without ionic vacancies; (b), the case of a free surface completely covered with ionic vacancies. α, the gravity acceleration; δrigid, the convective-diffusion layer thickness in the case of the rigid surface; δfree, the convective-diffusion layer thickness in the case of the free surface; ∘, the ionic vacancy.
According to the discussion in the previous paper [13], it is apparent that the onset of a vertical convection flow requires, as the necessary and sufficient conditions, not only the top-heavy distribution of fluid density, but also a Rayleigh number R larger than or equal to the critical value Rc. We must strongly emphasize that these conditions are valid only when the thickness δ of the convective-diffusion layer is a priori fixed in the same way as the conventional thermal convection (Bénard cell convection) [14], that is, under the fixed thickness δ, the convection occurs only when the value of the adjustable parameter R increases beyond the critical value Rc. However, in the present case, the situation is quite different; under the top-heavy distribution, the convective-diffusion layer is self-organized on the electrode surface, that is, the thickness δ is not fixed but automatically determined together with the formation of the convection cells. The electrode system by itself seeks the most stable nonequilibrium state and determines the thickness δ. In this case, Rayleigh number R always keeps the critical value Rc, whereas the thickness δ changes as an adjustable parameter. From the self-organized convection cells, the value is finally given by [13],
()
where α is the gravitational acceleration (ms−2), ν is the kinematic viscosity (m2 s−1), and DR is the reactant diffusion coefficient (m2 s−1). ΔCR is the concentration difference of the reactant between the bulk and the surface (mol m−3)
()
where CR(s) and CR(w) are the bulk and surface molar concentrations of the reactant (mol m−3), respectively. β is the buoyancy coefficient (m3 mol−1) defined by
()
where ρ is the density (kg m−3), CR is the molar concentration of the reactant (mol m−3), and the subscript μ means that the composition of the solution except for the reactant is kept constant. In many cases, under a gravity field of the order of 103 m s−2, the value of δ is of the order of 10 μ m.

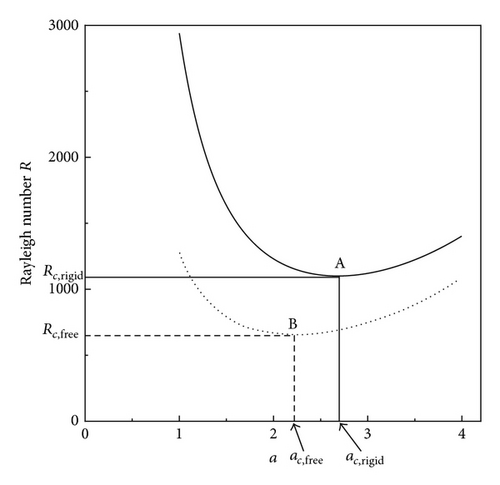
In accordance with the way in the previous paper [3], the Rayleigh numbers corresponding to the two kinds of mathematical solutions for the convection on rigid and free electrode surfaces are separately calculated against the nondimensional wave number of the convection flow. Figure 8 represents the result of the calculation; the critical Rayleigh number corresponding to the rigid electrode surface Rc,rigid = 1100.7 for the critical dimensionless wave number ac,rigid = 2.68 is larger than that to the free electrode surface Rc,free = 657.51 for ac,free = 2.221, so that under the condition R = Rc,free, the convection cells are possible for the upward flows on the free surface but are impossible for the downward flow on the rigid surface, that is, the convection cells shown in Figure 6 are as a whole not completed. To compensate this insufficient condition, it is necessary that the R increases up to the Rc,rigid for the downward flow to start, which takes the same value of δ as that of the preceding case of a rigid electrode surface [13], so that it is concluded that the diffusion current density equation obtained is consistent with the previous one.
Details are in the caption following the image
Plots of Rayleigh number versus nondimensional wave number. A, the case of the rigid surface (solid line), Rc,rigid = 1100.7 for ac,rigid = 2.68; B, the case of the free surface (dotted line), Rc,free = 657.51 for ac,free = 2.221.
In the previous papers, the diffusion currents of active species in parallel and vertical gravity fields were theoretically formulated and experimentally validated [13, 1519]. For the vertical field, according to above discussion, we obtain [13]
()
()
zR is the transferring electron number, F is the Faraday constant, and γ is the effective density coefficient discussed later and defined by
()

2.2. Rate-Determining Process of the Convection

In FERRO ion oxidation, as mentioned above, ionic vacancy has not been detected by GE. However, as shown in Figure 4, in the redox reactions including the same reaction, the lifetime of ionic vacancy has been measured. In the FERRI-FERRO redox reaction, as will be shown in Figures 11 and 12, the change in the partial molar volume between the product ion and the reactant ion is of the order of 10−5 m3 mol−1, whereas the estimated partial molar volume of ionic vacancy is of the order of 10−4 m3 mol−1. Therefore, if the lifetime was sufficiently long, GE could detect the partial molar volume of the ionic vacancy. However, in Figure 4, the lifetime measurement by the cyclotron MHDE suggests that the increasing flow velocity promotes the collision between ionic vacancies [7], assisting the rapid conversion to nanobubbles, which, due to much larger buoyancy forces, quickly escape from the electrode surface. If the buoyancy force of ionic vacancy enhances the convection, the lifetime will thus become shorter than that in a stationary solution. In the FERRI-FERRO redox reaction, as shown in Figure 4, the lifetime in the case of perfect collision is about 0.01 s, which is only 1/100th of the intrinsic lifetime.

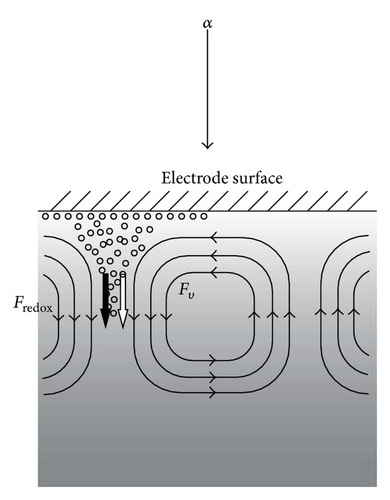
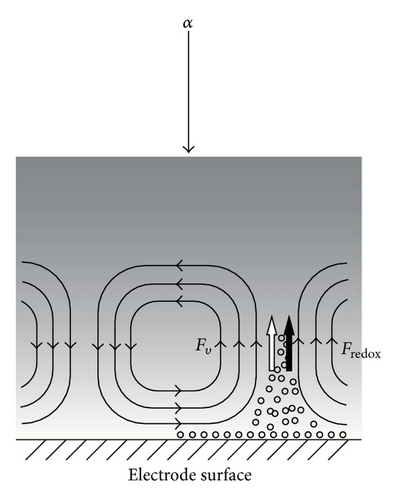
Based on these discussions, in Figures 9(a) and 9(b), we can elucidate the different contributions of ionic vacancies to the convections on upward and downward electrodes; for the FERRO ion oxidation, due to upward convection, as shown in Figure 9(a), the upward electrode is used as the working electrode. The vacancy production with upward buoyancy force thus accelerates the convection, promoting the collision between ionic vacancies, which decreases the lifetime, at most, down to 0.01 s. This is the reason why the vacancy is not detected in the FERRO ion oxidation by the GE method. As have been discussed in Section 1, since the GE method requires the measurement time more than 1 s, it is too short to measure the lifetime. In the case of FERRI ion reduction, due to downward convection, as shown in Figure 9(b), the downward electrode is used. The production of ionic vacancy with upward buoyancy force thus decelerates the convection, forming a stagnation area under the downward electrode; the created vacancies with upward buoyancy forces are first accumulated at the stagnation area, lightening the upper part of the solution, which results in the suppression of the convection. The extinction of the ionic vacancies then gradually takes place, inducing the downward convection with an increasing density. Such extinction process may proceed in a rate of the intrinsic lifetime, that is, 1 s, which is much longer than that of FERRI ion reduction.
Details are in the caption following the image
Effect of the buoyancy force of ionic vacancy on the total buoyancy force. (a), the case of upward electrode; (b), the case of downward electrode. Fredox thick black arrow, the buoyancy force by the product and reactant ions, upward by the density decrease (a) and downward by the density increase (b); Fv white arrow, the buoyancy force by the ionic vacancy, upward by the production (a) and downward by the extinction (b); α thin black arrow, the gravity acceleration.

2.3. Measurement of the Buoyancy Effect of Ionic Vacancy

In accordance with above discussion, instead of (A.26) in Appendix, the effective density coefficient is more correctly expressed by adding the effect of ionic vacancy as follows:
()
where γredox and γv,eff are the effective density coefficients of the redox reaction and ionic vacancy, respectively. As shown in (A.33) in Appendix, γ is used as (γ)lim  in the limiting diffusion, which is related to the change of the partial molar volume in the electrode reaction ΔVG (m3 mol−1), explicitly written as in (A.33), where ΔMm is the difference of the molar mass between the product Mm,P and the reactant Mm,R (kg mol−1), (see (A.30b)) mR(s) is the molality of the reactant in the bulk solution (mol kg−1), and ρs0 is the density of the bulk solution with supporting electrolyte (kg m−3). In view of the effect of ionic vacancy in (9), using the equilibrium data of and measured by the PM method, the partial molar volumes of the product and the reactant VP and VR in the electrode reaction are defined by
()
where is the effective partial molar volume of the vacancy (m3 mol−1). Instead of (2) and (3), the change in the partial molar volume ΔVG measured by the GE method is rewritten by ΔVpyc and as follows:
()
Therefore, is calculated by
()
As the lifetime becomes longer, approaches ±VV, where VV is the intrinsic partial molar volume of the ionic vacancy (m3 mol−1) and the sign ± corresponds to positive (upward) and negative (downward) buoyancies, respectively. On the other hand, converges to zero as the lifetime decreases.

3. Experimental

3.1. GE Method

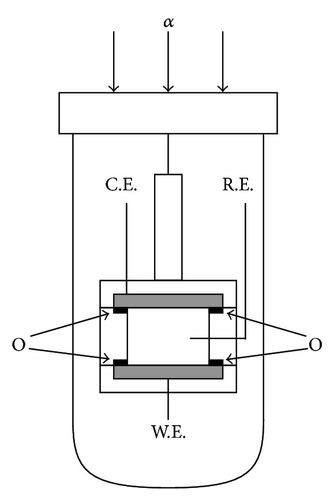
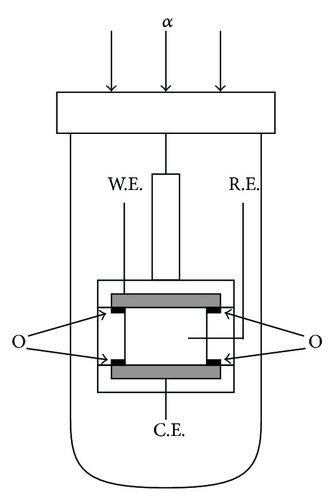
As test reactions, redox reactions between FERRO and FERRI ions were adopted. Concerning FERRO and FERRI ions, each of eighteen samples of 100 mol m−3 K2SO4 solutions was prepared for the molar concentration from 10 mol m−3 to 30 mol m−3. For the measurement of the density coefficient (γ)lim  in a limiting-diffusion current, a GE (GE01, Nikko Keisoku Co.) was used in the vertical gravity mode. As shown in Figures 10(a) and 10(b), a pair of circular Pt plates with 5 mm diameter shielded by o-rings was used for working and counter electrodes, where the active areas inside the o-rings were 3.14 mm2. Since the oxidation of FERRO ion decreases the solution density, the upward electrode configuration brings hydrodynamic instability, whereas the reduction of FERRI ion increases the solution density, so that the convection is expected for a downward electrode. Therefore, the upward electrode was used as the working electrode for the oxidation of FERRO ion, and the downward electrode was used as the working electrode for the reduction of FERRI ion. As the reference electrode, a silver wire coated by AgCl film with a 1 mm diameter was used. The reactions were performed at overpotentials of +200 mV and −200 mV for the oxidation and reduction, respectively, that is, at the limiting diffusion ranges. Prior to the measurement, argon bubbling was performed to evacuate dissolve oxygen in the solution. To calculate the constant Av in (7b), the kinematic viscosity ν was measured by the Cannon-Fenske viscometer (Sibata Scientific Technology Ltd.), and the diffusion coefficients DP and DR were determined by the rotating disk electrode (RRDE-1, Nikko Keisoku Co.). The solution was also kept at 27 ± 1°C. After the measurement, according to the procedure elucidated in the preceding paper [4], the data obtained were calculated.
Details are in the caption following the image
Upward and downward working electrode configurations [9]. (a), upward working electrode for the oxidation of FERRO ion; (b), downward working electrode for the reduction of FERRI ion. o, o-ring.
Details are in the caption following the image
Upward and downward working electrode configurations [9]. (a), upward working electrode for the oxidation of FERRO ion; (b), downward working electrode for the reduction of FERRI ion. o, o-ring.
Details are in the caption following the image
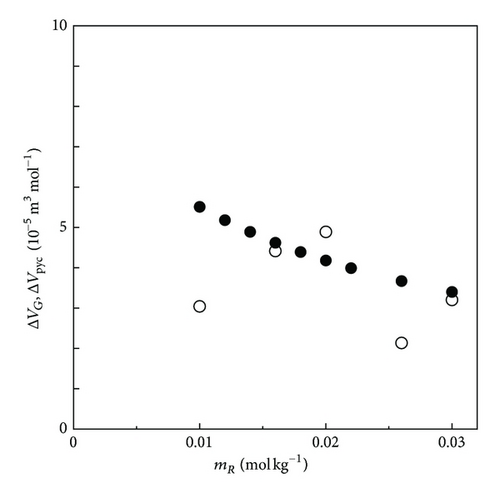
Comparison of the partial molar volume change between the GE and PM methods in the oxidation of FERRO ion at the upward electrode. ∘, ΔVG; •, ΔVpyc. DP (FERRI) = 8.28 × 10⁻¹⁰ m2 s−1; DR (FERRO) = 6.98 × 10⁻¹⁰ m2 s−1; ν = 9.01 × 10⁻⁷ m2 s−1.
Details are in the caption following the image
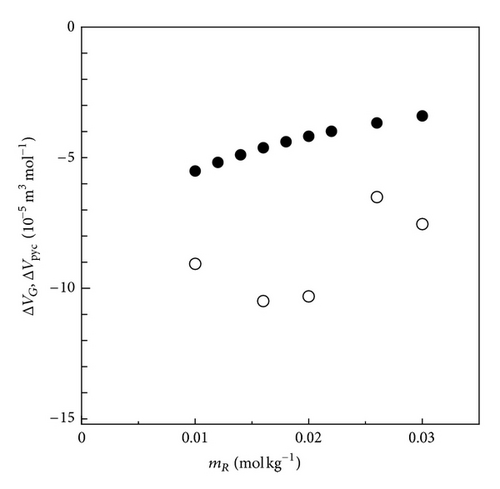
Comparison of the partial molar volume change between the GE and PM methods in the reduction of FERRI ion at the downward electrode. ∘, ΔVG; •, ΔVpyc. DP (FERRO) = 6.98 × 10⁻¹⁰ m2 s−1; DR (FERRI) = 8.28 × 10⁻¹⁰ m2 s−1; ν = 9.01 × 10⁻⁷ m2 s−1.

3.2. PM Method

Concerning FERRO and FERRI ions, the same samples as those of the GE method were prepared. For thermodynamic data to obtain, Hubbard-type PM (Specific Gravity Bottle, Sibata Scientific Technology Ltd.) was used. The sample was also kept at 27 ± 1°C. The data obtained were treated in the same way as that in the preceding paper [4].

4. Results and Discussion

Figure 11 shows the plot of the partial molar volume change in the oxidation of FERRO ion measured by the upward electrode together with the thermodynamic data by the PM method. Both data take positive values, consistent with each other within a relative error of 1.48 × 10⁻⁵ m3 mol−1. As discussed above, such agreement is attributed to the shortened lifetime of the ionic vacancy due to the increasing collision efficiency in the convection flow driven by the upward buoyancy forces arising from the vacancy production together with the positive partial molar volume change between FERRO and FERRI ions.

In Figure 12, the partial molar volume change in the reduction of FERRI ion at the downward electrode is exhibited. Different from the above case, all the data are shifted toward the negative side, which is attributed to the negative buoyancy forces occurring from the vacancy extinction together with the negative partial molar volume change between FERRI and FERRO ions, which suggests that the stagnation under the downward electrode keeps the collision of vacancy away, making the lifetime longer.

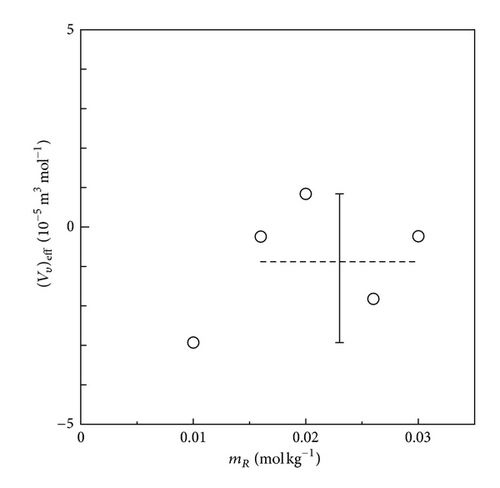
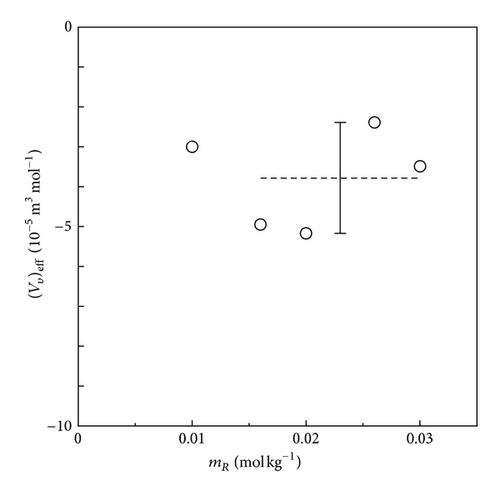
In Figures 13 and 14, the effective partial molar volumes extracted by (12) are exhibited. For the FERRO ion oxidation in Figure 13, the average value of is nearly equal to zero, that is, −8.77 × 10⁻⁶ m3 mol−1. In comparison with the expected value of the ionic vacancy with –1 unit charge given by VV = 2.13 × 10⁻⁴ m3 mol−1, it is concluded that the FERRO ion oxidation at the upward electrode not only always assures the validity of the diffusion current equations (7a) and (7b), but also can be used as the blank test for the GE method. On the other hand, for the FERRI ion reduction in Figure 14, due to the negative buoyancy force of ionic vacancy, the takes a negative average value −3.80 × 10⁻⁵ m3 mol−1, which, in comparison with the intrinsic value −2.13 × 10⁻⁴ m3 mol−1, can be regarded as a meaningful value. The difference between the experimental and the intrinsic values in Figure 14 results from the fact that the intrinsic lifetime of the vacancy is not sufficiently long for complete observation. Accordingly, it is concluded that the exact measurement for the size of ionic vacancy by the GE method requires, at least, an intrinsic lifetime longer than 1 s. Actually, for the ionic vacancy with an intrinsic lifetime of 8.6 s in copper deposition from acidic cupric sulfate solution, as shown in Figure 3, in spite of upward electrode, observed data agreed with the intrinsic value.
Details are in the caption following the image
Plot of the effective partial molar volume of ionic vacancy in the oxidation of FERRO ion against the molality of FERRO ion. ∘, the measured values; broken line, the average value. The measured effective partial molar volume,m3 mol−1; the expected partial molar volume of ionic vacancy with −1 unit charge, Vv = 2.13 × 10⁻⁴ m3 mol−1.
Details are in the caption following the image
Plot of the effective partial molar volume of ionic vacancy in the reduction of FERRI ion against the molality of FERRI ion. ∘, the measured value; broken line, the average value. The measured effective partial molar volume,  m3 mol−1; the expected negative partial molar volume of ionic vacancy with −1 unit charge, −Vv = −2.13 × 10⁻⁴ m3 mol−1.

5. Conclusions

In a vertical gravity field, ionic vacancies create partly rigid and partly free surfaces on an electrode surface with and without friction, respectively. However, since the convection flow on the rigid surface is rate-determining step, the whole convection process is controlled by the convection on the rigid surface. Accordingly, it is concluded that in this situation, the same equation as that of rigid surface is derived.

The gravitational convection for FERRI-FERRO ion redox reaction in the GE method arises from the buoyancy force occurring in the reaction, which takes a positive or negative value according to the fact whether the rate-determining step is the production or extinction of ionic vacancy together with the positive or negative partial molar volume change between product and reactant ions. Whether the total buoyancy force of the reaction is positive or negative can be discriminated by the upward or downward electrode used for measuring diffusion current. As a result, it was found that in FERRO ion oxidation and FERRI ion reduction, upward and downward convection cells, arise from the positive and negative buoyancy forces, respectively. However, in the FERRO ion oxidation, the positive partial molar volume of the vacancy from the vacancy production was not observed, whereas in the FERRI ion reduction, the negative partial molar volume from the vacancy extinction was not completely but partly observed. The former result was ascribed to the short vacancy lifetime shortened by the accelerated convection on the upward electrode, and the latter was to the lifetime elongated by the stagnation under the downward electrode.

Acknowledgment

The authors are thankful to Dr. Sugiyama, Waseda University, for providing us with the data of the lifetime of ionic vacancy in FERRI-FERRO redox reaction.

    Appendix

    The Partial Molar Volume Change Measured by GE in a Redox Reaction

    In accordance with the foregoing paper [3], the partial molar volume change measured by GE is formulated as follows. First, the density of a solution is defined by the mass M and volume V of the solution
    ()
    In the solution, the volume V is thought to be a physical quantity defined in the area in local equilibrium. Resultantly, inside the volume, the temperature T, the pressure p, and the composition Ci (molar concentration) are regarded constant. The change in the density during the reaction is assumed to proceed at constant temperature and pressure. Since the concentration of the active ion is quite low (the order of 1 mol m−3), we can neglect the thermal effect due to Joule heat as well as exthothermic and endothermic reactions. A large amount of supporting electrolyte brings large dielectric relaxation to the bulk solution, so that the electric field strength is drastically weakened. The migration of supporting electrolyte can be therefore disregarded. In the presence of a large amount of supporting electrolyte sharing the counter ion with the active ion, except for a narrow region of electric double layer, the counter ion together with the other ion of the supporting electrolyte is thus thought to distribute homogeneously in the solution, so that the active ion is independently treated from other components.
    A solvent containing only supporting electrolyte is first assumed, of which mass and volume are denoted as Ms0 and Vs0, respectively. The reactant and product of the electrode reaction are then virtually introduced to the solvent. According to the increments of the mass and volume, dM and dV, the solution density also changes by dρ. The infinitesimal volume dV is defined by the scale of length much smaller than the diffusion layer thickness but sufficiently large in comparison with the double layer thickness. Therefore, dM contains a sufficient large number of solution particles. At constant temperature and pressure, (A.1) is expanded to obtain the equation of the first expansion of ρ with regard to dVand dM at M = Ms0 and V = Vs0
    ()
    where
    ()
    ()

    where ρs0 denotes the density of the solvent with the supporting electrolyte.

    In the presence of a large amount of electrolyte, we can express the change in the volume by the change in the molar number nk of the active ion k, that is, reactant or product ion (k = R or P) as follows:
    ()
    where Vk is the partial molar volume of the ion k, exhibited as
    ()
    Then, the molar change of the ion k by the change in its mass can be expressed by
    ()
    where Mm,k is the molar mass of the active ion k. From (A.4) and (A.6), the following relationship is derived
    ()
    Substitution for dM from (A.7) in (A.2) allows us to obtain
    ()
    where
    ()
    The density ρ of the solution is also a function of the molar concentration Ck, that is,
    ()
    where subscript μ means that other concentrations except for Ck together with other physical parameters are kept constant. The volume variation by the change in the molar concentration can be expressed by
    ()
    Substituting (A.11) into (A.8), and comparing the resultant equation with (A.10), we obtain
    ()
    According to (6), the buoyancy coefficient of a single active ion k is defined as
    ()
    Substitution of (A.12) into (A.13) leads to
    ()
    Practically, as have already been shown in (7a) and (7b), the following density coefficient γk of the single active ion k is rather important for the measurement by GE. The density coefficient is the relative density of the ion k for the gravitational convection, instead of (8), newly defined for the ion k by
    ()
    γk is a dimensionless number intrinsic to the solvated active ion k. ΔCk is, as shown in (5), the molar concentration difference between the bulk and surface:
    ()
    where Ck(s) and Ck(w) are the bulk and surface concentrations, respectively. Ck is the molar concentration of the ion k, defined as
    ()
    Differentiating (A.17), we obtain the relationship
    ()
    The total volume V is a function of the molar number of the active ion k at constant temperature and pressure, that is,
    ()
    Substitution for dnk from (A.18) in (A.19) leads to
    ()
    Comparing (A.20) with (A.11), we obtain
    ()
    Assuming the following condition where the molar concentrations of the active ions are sufficiently low and their molar volumes are small, that is,
    ()
    We rewrite (A.21) as
    ()
    where in view of the fact that the total volume is approximated by the volume of the solvent with the supporting electrolyte, V in (A.21) is replaced by Vs0. Inserting (A.14) into (A.15) and substituting (A.9) and (A.23) into the resultant equation, we obtain the density coefficient of the ion k as follows:
    ()
    This is the basic equation describing the relationship between γk and Vk.
    Based on the above preliminary discussion, the density coefficient for an electrode reaction can be derived. First, the effective density coefficient γ for an electrode reaction is defined in the following redox reaction, which is generally expressed by
    ()
    where zk is the number of electron transferring in the reaction. Since in the presence of a large amount of supporting electrolyte, the minority active ions are always surrounded by the majority ions of the supporting electrolyte, and the circumstance around each active ion remains the same, which guarantees the superimposition of the partial molar volumes. The effective density coefficient γ in (8) is thus expressed by
    ()
    where subscripts P and R denote the product and reactant, respectively. As the reactant is consumed during the reaction, the product is produced. As mentioned above, due to dielectric relaxation, a large amount of supporting electrolyte weakens the migration of supporting electrolyte together with the occurrence of electric field. As for active ions, since the minority active ions are always surrounded by the majority ions of the supporting electrolyte, the circumstance around each active ion remains the same. Namely, an active ion does not feel the existence of other active ions, so that without migration, they can diffuse in the same way as neutral molecules. Therefore, at the electrode surface (z = 0), the following Fick’s first law is satisfied
    ()
    where zk (k = R or P) is the electron number in the reactant or product transferring in the reaction and Dk is the diffusion coefficient. Using the diffusion layer thickness δ and the concentration differences of the reactant and product ions ΔCR and ΔCP between the bulk and surface, we can rewrite (A.27) as
    ()
    From (A.24), (A.26), and (A.28), γ is explicitly written as
    ()
    where  ΔCR, ΔVG, and ΔMm are defined in (5) as the following:
    ()
    ()
    ()
    Under the condition of limiting diffusion where the surface concentration of the reactant becomes zero, that is, CR(w) = 0, the difference of the molar concentration of the reactant ΔCR is thus rewritten as
    ()
    where CR(s) and mR(s) are the molar concentration and the molality of the reactant in the bulk, respectively. Substituting (A.31) into (A.29), we obtain the relationship corresponding to the limiting diffusion as follows:
    ()
    where (γ)lim  denotes the effective density coefficient measured in the limiting diffusion. Therefore, from the experimental data of (γ)lim  in an electrochemical reaction, the value of ΔVG is calculated by
    ()
    All the physical quantities on the right-hand side can be determined by electrochemical and thermodynamic measurements, so that (A.33) is applicable to nonequilibrium state as well as equilibrium state.

      The full text of this article hosted at iucr.org is unavailable due to technical difficulties.