A Numerical Study on the Progressive Failure of 3D Four-Directional Braided Composites
Abstract
The complexity of the microstructure makes the strength prediction and failure analysis of 3D braided composites difficult. A new unit cell geometrical model, taken as the representative volume element (RVE), is proposed to describe the yarn configuration of 3D braided composites produced by the four-step 1 × 1 method. Then, based on the periodical boundary conditions, a RVE-based micromechanical model by using the nonlinear finite element method has been presented to predict the progressive damage and the strength of 3D braided composites subjected to tensile loading. The numerical model can simulate the effect of damage accumulation on the tensile stress-strain curve by combining the proposed failure criteria and the stiffness degradation model. The longitudinal shear nonlinearity of braiding yarn is considered in the model. To verify the model, two specimens with typical braiding angles were selected to conduct the simulations. The predicted stress-strain curves by the model compared favorably with the experimental data, demonstrating the applicability of the micromechanical finite element model. The effect of the nonlinear shear parameter on the tensile stress-strain curve was discussed in detail. The results indicate that the tensile mechanical behaviors of 3D braided composites are affected by both the yarn shear nonlinearity and the damage accumulation.
1. Introduction
Three-dimensional (3D) braided composites as a kind of textile composites have been attractive for industrial applications because of their excellent mechanical performances, such as better out-of-plane stiffness, strength, and impact resistance, compared with the fiber-reinforced laminated composites. To promote 3D braided composites widely applied in aeronautics and astronautics structure design, the prediction models on the mechanical performance should be developed.
For 3D braided composites, the microstructures and the effective elastic properties have been early studied by many scholars [1–6]. Ma et al. [1, 2] studied the effective elastic properties of 3D braided composites by using the “fiber interlock model” based on the maximum strain energy principle and the “fiber inclination model” based on the modified laminated theory. Y. Q. Wang and A. S. D. Wang [3] adopted a mixed volume averaging technique to predict the mechanical properties of 3D braided composites. X. Sun and C. Sun [4] reported a volume-average-compliance method to calculate the elastic constants. Chen et al. [5] and K. Xu and X. W. Xu [6] developed finite element prediction models to evaluate the elastic performance of braided composites. Since the microstructures of 3D braided composites are complicated, it is challenging to predict the strength and failure process. However, many researchers attempted to propose the strength prediction models and analyze the progressive damage behavior. Gu [7] presented an analytical model to predict the uniaxial tensile strength of 3D braided composites based on the strain energy conservation law. Tang and Postle [8] analyzed the nonlinear deformation of 3D braided composites by the finite element method. Fang et al. [9] developed a finite element model for analyzing the compressive strength of 3D braided composites.
Recently, many scholars have made efforts to further investigate the microstructure model and the mechanical performance prediction of textile composites. Vanaerschot et al. [10] proposed the stochastic model of an experimentally measured unit cell structure by using the multiscale textile software Wise Tex. Blacklock et al. [11] presented a Monte Carlo algorithm defined for generating replicas of textile composite specimens by using the computed tomography. Rinaldi et al. [12] studied the algorithms for generating 3D models by using the statistical data from high resolution X-ray computed tomography, which helps provide an accurate geometrical model for damage analysis. Yang and Cox [13] predicted the failure in textile composites using the Binary model with gauge-averaging and assessed the accuracy of predictions by triaxially braided carbon/epoxy composites. Mouritz [14] studied the tensile fatigue properties of 3D composites with through-thickness reinforcement. Mouritz and Cox [15] made a comparison research on the advantages and disadvantages of 3D woven, stitched, and pinned composites based on substantial published data. Koh et al. [16] investigated the importance of the skin-flange thickness on the strengthening mechanics and fracture modes of z-pinned composite T-joints by conducting an experimental and analytical study. The above-mentioned researches indicate that it is vital to present an accurate microstructure model and establish an effective mechanical analysis model for the strength prediction and failure analysis of 3D braided composites.
The main aim of the present work is to develop a strength prediction model for 3D braided composites subjected to tensile loading by the MFEM. First, the microstructures of 3D braided composites produced by the four-step 1 × 1 method are investigated in detail. A new unit cell geometrical model, taken as the representative volume element, is proposed to describe the yarn configuration of 3D braided composites. Then a micromechanical damage model based on the RVE is established by the nonlinear finite element method. Two specimens with typical braiding angle are chosen to verify the numerical model. The predicted results by the numerical model will be compared with experimental data. The effects of the longitudinal shear nonlinearity of yarn and the damage accumulation on the tensile mechanical behavior of 3D braided composites are discussed in detail. Finally, some conclusions are drawn herein.
2. Microstructure Analysis and Unit Cell Model
3D four-directional braided composites reported herein are produced by the 4-step 1 × 1 rectangular braiding procedure, which are composed of the braided preforms and the matrix pockets. Figure 1 describes the four-step 1 × 1 braiding process to manufacture 3D braided preforms. The pattern of the yarn carriers on a machine bed in xy plane is shown in Figure 1(a). Their movements in one machine cycle are illustrated in Figures 1(b)–1(f). Each machine cycle consists of four movement steps and each carrier moves one position at one step along x or y direction. At the first step, the yarn carriers in rows move horizontally one position in an alternating manner as shown in Figure 1(c). At the second step, the yarn carriers in columns move one position vertically in an alternating manner as shown in Figure 1(d). At the third and fourth steps, as illustrated in Figure 1(e) and Figure 1(f), the carrier movements are opposite to their previous movements, respectively. After the cycle consisting of these four steps is accomplished, all the yarn carriers return to their original pattern in Figure 1(b), which is the reason why this process is called the four-step braiding process. Then a certain “jamming” action is imposed on all the intertwined yarns along the z-axis direction to make the yarns stabilized and compacted in space, which is so-called the “jammed condition.” As a result, the finite length of the resultant preforms is defined as the braiding pitch, denoted by h. As these steps of motion continue, the yarns move throughout the cross section and are interlaced to form the braided preforms [17].

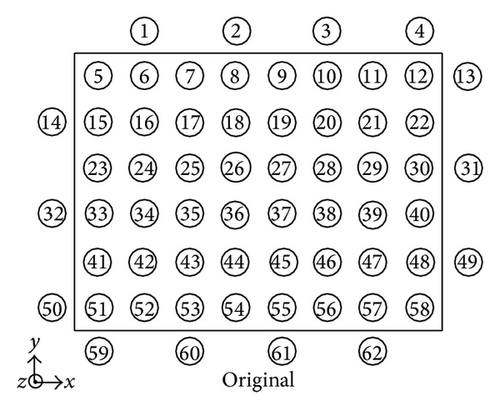

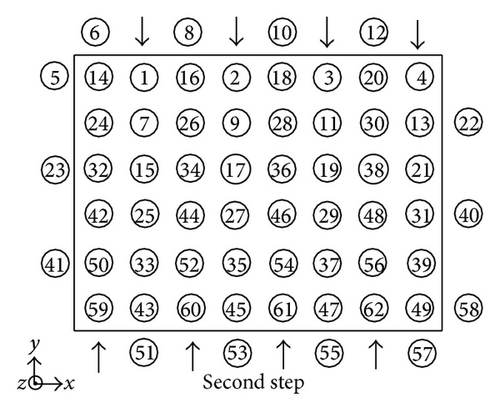
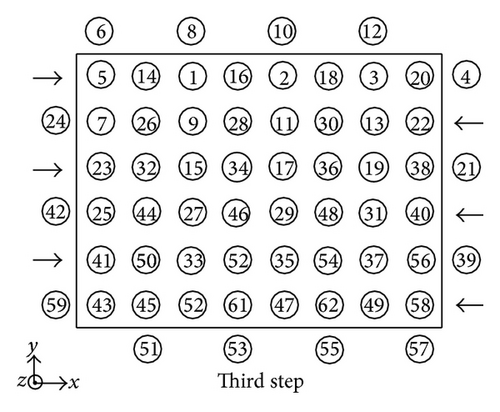
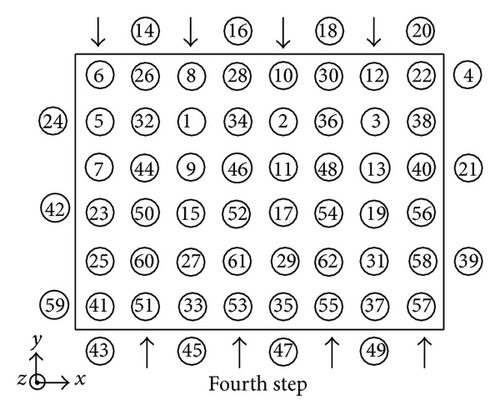
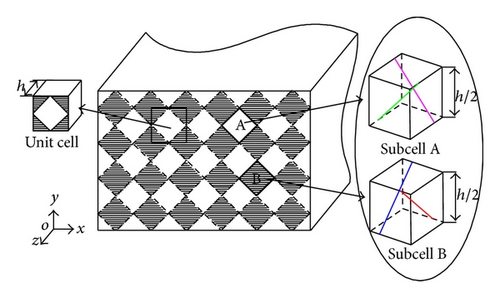
Based on the movements of yarn carriers, the planar and spatial traces of the braiding yarns can be obtained and the unit cell model can be established as well. Considering the structure complexity of braided composites, many models based on the interior unit cell models in the mesoscale have been presented to analyze the mechanical properties of 3D braided composites in the macroscale. In the paper, a new representative unit cell model is established according to the interior braided structures of 3D four-directional rectangular braided composites. According to the periodical feature of subcell distribution, the interior unit cell as the smallest periodical unit cell can be selected as shown in Figure 2. As shown in Figure 2(a), 3D four-directional braided composites can be regarded to be made of an infinite periodic interior unit cell, which can be further divided into two kinds of subcell A and B. Figure 2(b) schematically shows the distribution of subcells A and subcell B in 3D space. It is noteworthy that subcell A and subcell B marked with the dash lines distribute alternately every half of a pitch length h in the braiding direction of the z-axis, as shown in Figure 2(b).
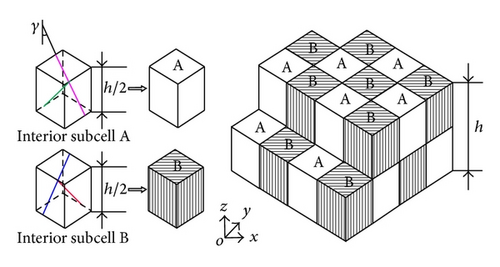
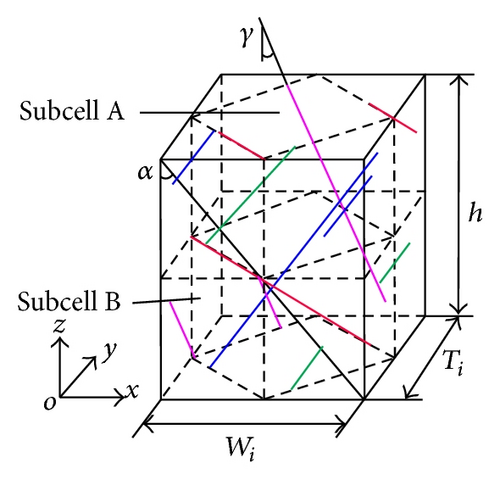
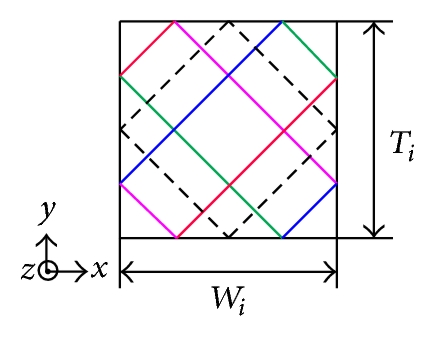
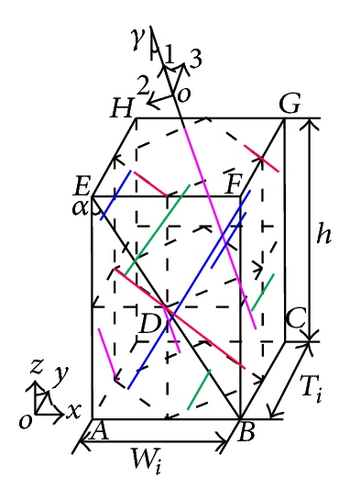
According to the unit cell partition scheme, the interior unit cells are oriented in the same reference frame as the specimen cross section, which is quite favorable for the mechanical properties analysis. Figure 3 shows the topological relation of the main yarns in a parallelepiped unit cell with the width Wi, the thickness Ti, and the pitch height h. In Figure 3, α is the braiding angle between the grain formed by the adjacent braiding yarn with the same orientation on the composites surface and the z-axis and γ is the interior braiding angle between the central axis of the interior braiding yarn and the z-axis. According to the orientation angles, as shown in Figures 2 and 3, the interior subcell A and subcell B altogether include four groups of braiding yarns, which distribute in two sets of intersecting parallel planes. Each yarn in the adjacent parallel planes has +γ or −γ distribution, respectively.
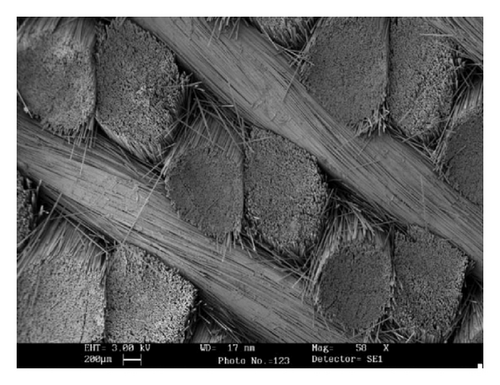
The microstructure of interior unit cell model is important for the strength prediction and failure analysis of 3D braided composites. Figure 4 gives the cross-sectional morphology of the interior preforms cut longitudinally at a 45° angle with the rectangular surface by scanning electron microscope method [17]. From the interior yarn configuration in Figure 4, it shows that the braiding yarns axes stay straight and keep surface contact with each other by sharing a plane due to their mutual squeeze. In order to consider the mutual yarn squeeze, most of the models [3, 17] supposed the yarn cross section shape to be elliptical.
By analyzing the mutual contact relation of the braiding yarns, the solid RVE model of 3D 4-directional braided composites is established, as illustrated in Figure 5. In the model, some assumptions have been made based on the above analysis. (1) The cross section shape of the braiding yarns is the octagon containing an inscribed ellipse with major and minor radii, a and b, respectively, which is shown in Figure 5(a). (2) The braiding yarns used in the braided preforms have identical constituent material, size, and flexibility. (3) The whole braided preforms keep a “jammed” condition.
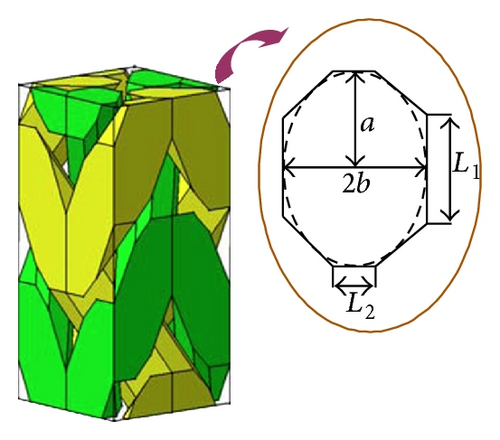
Therefore, once the braiding angle α, the pitch length h, and the fiber volume fraction Vf are obtained, the other geometry parameters of the RVE unit cell model can be calculated according to formulas (1)–(8). Then the 3D parametrical solid unit cell models can be established by using the CAD software CATIA P3 V5R14.
3. Finite Element Damage Model
The RVE-based micromechanical damage model consists of three major parts: the periodical boundary conditions and finite element meshing, the constitutive relations of constituent materials, and failure criteria combined with the stiffness degradation model. The details of the damage model are presented in the subsections.
3.1. Periodical Displacement Boundary Conditions and Finite Element Meshing
By applying (13) in the finite element analysis of the RVE, two continuities can be satisfied at the boundaries of the neighboring cubic RVEs. The first is that the displacements must be continuous, and the second is that the traction distribution at the opposite parallel boundaries of the RVE must be uniform [18].
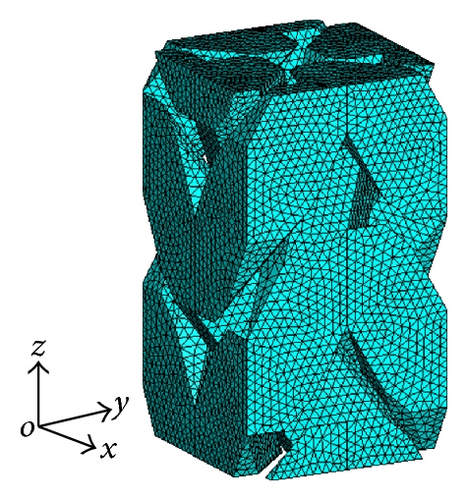
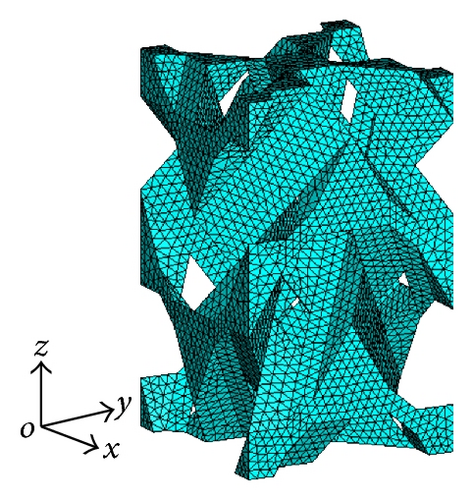
The unit cell model is composed of the straight yarns in various directions and the resin matrix pocket. It is assumed that the perfect bonding exists between the yarns and the matrix pocket. Due to the microstructure complexity, the tetrahedron elements are applied to mesh the whole model, as shown in Figure 6. Uniform meshes should be made to satisfy the continuities of stress and displacement on the interfaces of the component materials, including the interfaces of yarns in different directions and the interfaces between the yarns and the resin matrix pocket. Adaptive finite element meshes were used to keep element size small enough in the edges of the matrix pocket.
3.2. Constitutive Relations of Constituent Materials
The model is composed of the braiding yarns and the resin matrix pocket. The yarns can generally be regarded as the unidirectional fiber-reinforced composites in the material coordinates systems. It is noted that the principal material directions of a yarn are defined in Figure 5(b). The yarns and the resin matrix are assumed to be transversely isotropic and isotropic, respectively. Moreover, the resin matrix is assumed to be linearly elastic in the damage model. Since the yarns act as the reinforcement body of 3D braided composites, it is crucial to establish their effective constitutive relation for conducting failure analysis.
3.3. Failure Criteria and Stiffness Degradation Model
Due to braiding yarns acting as the reinforcement body of 3D braided composites, it is important to simulate the yarn damage initiation and propagation for the failure analysis of 3D braided composites. Therefore, the appropriate failure criteria for yarns should be chosen in the damage simulation. Hashin [25] proposed a set of famous failure criteria for predicting the unidirectional composites failure. These Hashin-type criteria have been extensively applied in the progressive damage models aiming at the laminated composites [26, 27]. Three-dimensional failure criteria of the unidirectional composites can be given as follows:
It is noted that the notation of all the quantities appearing in these criteria refers to the local material coordinates systems of the yarn. If κ is assumed to be zero, these criteria have the same form as those in the literature [28]. The yarn strength data are calculated by using the simplified formulas proposed by Chamis [29]. The Von Mises failure criterion is chosen to predict the damage of the isotropic resin matrix. Note that once resin matrix failure occurs, the epoxy matrix material is no longer isotropic.
The responses of the constituent materials are assumed to be linearly elastic before damage occurrs, except for the longitudinal shear nonlinearity of yarn. When the combined stresses reach one of the yarn failure criteria or Von Mises failure criterion, the corresponding damage events occur. Once the yarn damage at some corresponding integration point occurs, all the responses are assumed to be linearly elastic, but with reduced moduli by the degradation model. The case is suitable for the resin matrix pocket. The modified version of Blackketter’s model [30] is adopted to simulate the mechanical performance degradation due to damage. The degradation factors of the corresponding failure modes for the yarns and the resin matrix pocket are listed in Table 1.
| Modes of failure | E1 | E2 | E3 | G12 | G13 | G23 |
|---|---|---|---|---|---|---|
| Fiber tensile failure (σ1 > 0) | 0.01 | 0.01 | 0.01 | 0.01 | 0.01 | 0.01 |
| Fiber compressive failure (σ1 < 0) | ||||||
| Matrix tensile cracking (σ2 > 0) | — | 0.01 | — | 0.2 | — | 0.2 |
| Matrix compressive cracking (σ2 < 0) | ||||||
| Matrix normal-tensile cracking (σ3 > 0) | — | — | 0.01 | — | 0.2 | 0.2 |
| Matrix normal-compressive cracking (σ3 < 0) | ||||||
| Fiber-matrix shear-out (σ1 < 0) | — | — | — | 0.2 | 0.2 | — |
| Resin matrix failure | 0.01 | 0.01 | 0.01 | 0.2 | 0.2 | 0.2 |
According to the failure criteria and the degradation model, the progressive failure analysis can be conducted at each integration point of every element in the material coordinates systems.
4. Stress Analysis and Failure Analysis Approach
For the progressive damage analysis of the cubic RVE subjected to tensile loading, the process consists of two parts: the stress analysis and the failure analysis.
- (1)
Increase the applied displacement load from pn−1 to pn by a small increment Δpi.
- (2)
At each load step, calculate the stresses at each Gauss integration point according to the constitutive relations in the previous configuration Vn−1.
- (3)
Transform the stresses to the material coordinates systems of the yarn. Assess the damage by using the above failure criteria at each of the Gauss integration points.
- (4)
If no damage is found, the shear moduli G12 and G31 should be modified according to the current stress state and return to the first step.
- (5)
If damage occurs, the material property should be reduced by the degradation model. Once the yarn damage has occurred, the longitudinal shear nonlinearity should be terminated. The response of the yarn is assumed to be linearly elastic with holding the current shear moduli, which can be used as the “initial” shear moduli in the next step analysis.
- (6)
If the propagation of damage has resulted in the catastrophic failure of unit cell, no more loads can be added and the analysis is finished. Otherwise, proceed to the first step until the material is no longer able to carry any further incremental loads.
It is noted that when the material properties are degraded at an integration point, redistribution of load could result in failure of nearby points. Therefore, it is necessary to recalculate the stresses and strains to determine any additional damage as a result of stress redistributions at the same load. However, Sleight [31] stated that if the load increment step, Δpi, was small enough, the step of reestablishing equilibrium may be omitted. Thus, small load steps were used in this analysis to omit the step of reestablishing equilibrium after the change of material properties. Besides, small load steps were used to maintain accurate initial predictions of the nonlinear constituent properties, without missing important intermediate stress-strain behavior.
5. Numerical Results and Discussion
In order to verify the proposed damage model and the corresponding computer codes, the procedure was developed to simulate the progressive failure of 3D braided composites subjected to tensile loading. All the analyses reported herein were done for 3D braided composites by the four-step 1 × 1 procedure. Two examples with typical braiding angles (one is 19.2° and the other is 36.6°) were selected from Xiu [32]. The elastic properties of the constituent materials, including the carbon fiber and the epoxy resin, are listed in Table 2. The strength properties in Table 2 are obtained from the handbook [33].
| Ef1 (Gpa) | Ef2 (Gpa) | Gf12 (Gpa) | Gf23 (Gpa) | μf12 | μm | Xt (Mpa) | Xc (Mpa) | S (Mpa) | σm (Mpa) | |
|---|---|---|---|---|---|---|---|---|---|---|
| T300 | 230 | 40 | 24 | 14.3 | 0.26 | 3528 | 2470 | |||
| Epoxy resin | 3.5 | 0.35 | 80 | 241 | 60 | 80 |
The braiding parameters of two specimens and the microstructure parameters of unit cell models are presented in Table 3, where Vf is the fiber volume fraction of the specimen and Dy is the equivalent yarn diameter. According to the equivalent diameter, the yarn packing factor ε was calculated. The FE model of specimen Number 1 is composed of 25849 nodes and 132954 elements and the FE model of specimen Number 2 is composed of 15268 nodes and 78318 elements. As shown in Table 3, the geometry parameters of unit cell model compare favorably with the specimens, which indicates that the unit cell model has effectively described the microstructure of 3D braided composites.
| Braiding parameters of specimens | Structural parameters of unit cell model | ||||||||||||||
|---|---|---|---|---|---|---|---|---|---|---|---|---|---|---|---|
| Dimensions | α (°) | m × n | Vf (%) | Dy (mm) | γ (°) | Wx = Wy (mm) | ε (%) | h (mm) | Vf (%) | ||||||
| No. 1 | 20.6 × 6.32 × 250 | 19.2 | 22 × 6 | 60.69 | 0.757 | 26.2 | 1.904 | 75.6 | 5.46 | 60.04 | |||||
| No. 2 | 20.6 × 8.58 × 250 | 36.6 | 27 × 9 | 52.04 | 0.535 | 46.4 | 1.662 | 69.5 | 2.23 | 48.17 | |||||
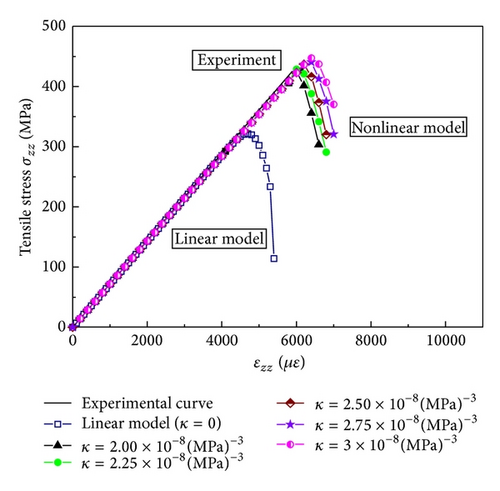
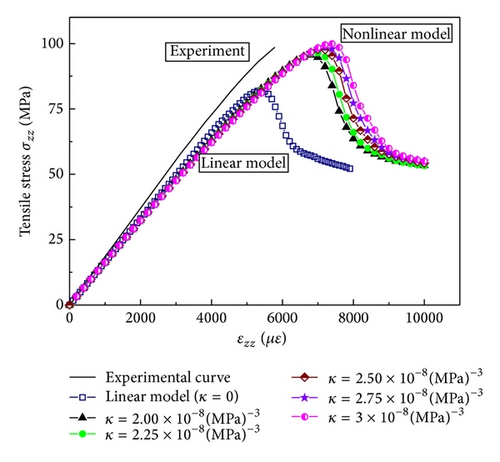
As the longitudinal shear nonlinearity has effect on the yarn damage analysis of 3D braided composites, it is important to choose a reasonable value of the shear nonlinearity parameter for the unidirectional braiding yarn. Chang et al. [27, 34] reported that the longitudinal nonlinearity shear parameter κ was estimated to be about 2.5 × 10⁻⁸ (Mpa)−3 when the fiber volume fraction of the unidirectional lamina was 66%. There is a difference of fiber volume fraction between that case and the models in Table 3. In order to objectively analyze the effect of the longitudinal nonlinearity shear parameter on the failure behavior, the parametric study has been conducted by varying κ from 2.0 × 10⁻⁸ (Mpa)−3 to 3.0 × 10⁻⁸ (Mpa)−3 herein. Figure 7 and Table 4 give the predicted results. The curves marked as “nonlinear model” mean that the curves were obtained by the models considering the longitudinal shear nonlinearity of yarn, while the curve marked as “linear model” means the curve was predicted by assuming the nonlinearity shear parameter κ to be zero.
| Experiment values (Mpa) | Linear model | Nonlinear model | ||||
|---|---|---|---|---|---|---|
| Predicted (Mpa) | Error (%) | Nonlinear parameter κ 10−8 (Mpa)−3 |
Predicted (Mpa) | Error (%) | ||
| No. 1 | 425.0 | 318.9 | −24.96 | 2.00 | 424.7 | −0.07 |
| 2.25 | 428.8 | +0.89 | ||||
| 2.50 | 436.9 | +2.80 | ||||
| 2.75 | 440.3 | +3.60 | ||||
| 3.00 | 447.2 | +5.22 | ||||
| No. 2 | 99.0 | 82.4 | −16.76 | 2.00 | 95.5 | −3.54 |
| 2.25 | 96.5 | −2.53 | ||||
| 2.50 | 97.4 | −1.62 | ||||
| 2.75 | 98.7 | −0.30 | ||||
| 3.00 | 99.9 | −0.91 | ||||
5.1. Tensile Stress-Strain Curves and Parametrical Study
The tensile stress-strain curves provide the macroscopic mechanical behavior of 3D braided composites subjected to tensile loading. As shown in Figure 7, it is noted that the experimental curve taken from the literature [32] only shows the stage of the stress-strain curve before reaching the peak strength, while the predicted tensile stress-strain curves gives the whole simulation process from damage initiation to catastrophic failure, as the carbon-fiber reinforced resin braided composites actually exhibit the brittle character of breakage behavior, which means that the stress-strain curves suddenly drop down along almost vertical lines once reaching the climax of strength. Therefore, it could be the reason that the stages of the after-peak strength have been omitted in the experimental curves.
From Figure 7(a), the predicted tensile stress-strain curves of specimen Number 1 with a low braiding angle are compared with the experimental curve. Before reaching the peak strength, the calculated stress-strain curves of specimen Number 1 almost keep linear whether those are predicted by the “nonlinear model” or the “linear model”. The linear feature of the responses is consistent with the experimental result. However, the peak strength predicted by the linear model is obviously less than those predicted by the nonlinear models. On the whole, compared with the experimental curve, the numerical models considering the yarn shear nonlinearity are able to obtain more reasonable strength prediction results than the linear model. When the nonlinearity shear parameter κ varies from 2.0 × 10⁻⁸ (Mpa)−3 to 3.0 × 10⁻⁸ (Mpa)−3 by an increment of 0.25 × 10⁻⁸ (Mpa)−3, the predicted peak strength gradually increases.
By analyzing the results, it can be concluded that the shear nonlinearity parameters of braiding yarn have a certain effect on the failure strength of specimen with a low braiding angel. In fact, the value of the nonlinear shear parameter in the literature [32] is 2.50 × 10⁻⁸ (Mpa)−3 when the fiber volume fraction is 66%. As for specimen Number 1 with a low braiding angle, the fiber volume fraction of braiding yarn is 75.6%. The nonlinearity of resin matrix is the basic reason that results in the longitudinal shear nonlinearity of the unidirectional composite yarn. Therefore, the nonlinear shear response of unidirectional yarn is weakened when the resin volume fraction of unidirectional yarn decreases. From Table 4, comparing the fiber volume fraction of specimen Number 1 with that case [32], it seems that the nonlinear shear parameter of the unidirectional braiding yarns should be assumed to be 2.00 × 10⁻⁸ (Mpa)−3 so as to obtain a satisfactory result.
For specimen Number 1, the damage was initiated in the yarns and the matrix pocket almost simultaneously, whether for the “nonlinear model” or the “linear model”. The detailed analysis about damage event sequence will be investigated in the following section. From Figure 7(a), once the damage of specimen Number 1 with a low braiding angle came to occur, the damage rapidly propagated and caused the catastrophic failure of braided composites. After reaching the peak strength, the stress-strain curve of the specimen Number 1 dropped down rapidly and suddenly lost its ability of carrying load. The phenomenon indicates that the tensile mechanical behavior of specimen Number 1 with a low braiding angle is more likely to be brittle.
As shown in Figure 7(b), the predicted tensile stress-strain curves of specimen Number 2 with a large braiding angle are presented. The stress-strain curves keep nonlinear whether those were predicted by the “nonlinear model” or the “linear model”. The nonlinearity extent of the curves predicted by the “nonlinear model” is more prominent than the curve obtained by the “linear model”. The peak strength predicted by the linear model is obviously less than those predicted by the nonlinear models. Since the linear model has assumed all the mechanical behavior of the constituent materials to be linearly elastic, the nonlinear feature of the stress-strain curve predicted by the “linear model” indicates that the damage accumulation results in the macroscopic nonlinear behavior. Generally speaking, the stress-strain curves predicted by the nonlinear models compared favorably with the experimental curve. When the nonlinearity shear parameter κ varies from 2.0 × 10⁻⁸ (Mpa)−3 to 3.0 × 10⁻⁸ (Mpa)−3 by an increment of 0.25 × 10⁻⁸ (Mpa)−3, the predicted peak strength begins to gradually increase. However, the errors are limited to 5%. For specimen Number 2 with a large braiding angle, the fiber volume fraction of braiding yarn is 69.5%. Compared with specimen Number 1, it seems that the effect of the nonlinear shear parameter on the peak strength of specimen Number 2 is smaller.
For specimen Number 2, whether for the “nonlinear model” or the “linear model,” the damage was initiated in braiding yarns and then the resin matrix damage gradually began to occur. The detailed sequence of damage events will be investigated afterwards. It is worth to mentioning that, after the damage of the specimen with a large braiding angle occurred in the yarn, the damage gradually began to propagate and accumulate in a slow speed compared to the specimen with a low braiding angle. There is a long time between the initial damage occurring and the final failure of the specimen. Therefore, for 3D braided composites with a large braiding angle, the nonlinear mechanical behavior subjected to tensile load can be attributed to two main factors: one is the material properties degradation due to the damage accumulation and the other is the yarn shear nonlinearity.
After reaching the peak strength, the stress-strain curves of specimen Number 2 are not to drop down in a rapid speed but to descend gradually. The trend of the curves shows that specimen Number 2 with a large braiding angle gradually loses its ability of carrying loads. The great dissimilarity of failure strength between specimen Number 1 and specimen Number 2 can be attributed to the difference of braiding angle, which plays an important role in determining their mechanical behaviors.
The predicted ultimate strength values and the experimental results are listed in Table 4. From Table 4, the predicted results obtained by the nonlinear models compare well with the experimental values. The errors are almost limited to be no more than 5%. For 3D four-directional braided composites, the primary material direction of the yarn is orientated γ with respect to the z-axis of the tensile load direction. The reason why the “nonlinear model” can obtain the preferable prediction of tension strength could be that the shear stress component of the yarn is comparable to the tensile stress component. So the longitudinal shear nonlinearity can not be neglected in damage modeling.
5.2. Evolution of Damage
The damage analysis of 3D braided composites is important for strength prediction. As given in Table 1, there are multiple failure modes for braiding yarns and resin matrix pocket. These failure modes are assumed to exist simultaneously in the model if the combined stresses satisfy the corresponding failure criteria. It is not doubtful that fiber tensile failure is the dominant failure mechanism. In the following section, the damage initiation and evolution in braiding yarns and resin matrix pocket predicted by the “nonlinear model” are chosen to be investigated in detail.
As for specimen Number 1, the nonlinear model with the shear parameter κ equaling 2.0 × 10⁻⁸ (Mpa)−3 is taken as the example. The damage was initiated in the yarn interface regions and the neighboring matrix pocket simultaneously with the increase of load. When the global average strain εzz reached 4800 με, the yarn damage modes, fiber breakage and matrix normal-compressive cracking, were predicted to take place at the interfaces between the yarns and matrix pocket, while the matrix damage occurred at the same region. Then these failure modes propagated rapidly along the primary direction of the corresponding yarns. When the global average strain εzz reached 5400 με, the other yarn damage types, including matrix tensile cracking, matrix compressive cracking, matrix normal-tensile cracking, and fiber-matrix shear-out, had occurred almost simultaneously. As the load increased, these damage modes propagated along the yarn surfaces with a high speed. The damage types of fiber breakage and matrix normal-compressive cracking had become the primary failure modes of unit cell model when final failure was reached.
As shown in Figure 7(a), the stress-strain curve of the specimen Number 1 reached the maximum when εzz equaled 6000 με. Considering that the serious yarn failure mode is fiber tensile failure, Figure 8(a) shows the damage evolution of fiber tensile failure after the global average strain exceeds 6000 με. Fiber breakage damage propagates rapidly up to the catastrophic failure of specimen Number 1. Figure 8(b) shows the resin matrix failure in resin pocket after the global average strain εzz exceeds 6000 με. From Figure 8(b), resin matrix damage usually took place at the stress concentration areas of the matrix pocket edges.


The nonlinear model with the shear parameter κ equaling 2.5 × 10⁻⁸ (Mpa)−3 is chosen as the example for specimen Number 2. When the global average strain εzz reached 3800 με, the yarn damage was predicted to take place by matrix normal-tensile cracking at the interfaces between the yarns and matrix pocket. With the increase of load, damage of fiber breakage occurred when εzz equaled 5600 με. Then these damage types propagated gradually along the primary yarn directions. When the global average strain εzz reached 6200 με, the resin pocket damage began to initiate at the stress concentrations. As the load increased, the other yarn damage types, including matrix compressive cracking, matrix normal-compressive cracking, and fiber-matrix shear-out, occurred almost simultaneously when εzz equaled 6700 με. Then these damage modes propagated along the yarn surfaces with a slow speed compared to specimen Number 1. However, when final failure was reached, the damage types of fiber breakage and matrix normal-tensile cracking had become the primary failure modes of unit cell model.
The stress-strain curve of specimen Number 2 reached the maximum as shown in Figure 7(b) when ε33 equaled 7000 με. Figure 9(a) shows the evolution of fiber breakage damage after the global average strain εzz exceeds 6600 με. Fiber breakage damage propagates gradually up to the progressive failure of the model. Figure 9(b) shows the matrix failure in resin matrix pocket after the global average strain εzz exceeds 6600 με. From Figures 8(b) and 9(b), the resin matrix pocket damage usually occurred at the stress concentration areas of the matrix pocket edges.


Comparing the progressive failure analysis of the two specimens, it can be found that failure mechanisms differ from each other due to the various braiding angles. For example, as shown in Figures 8 and 9, the propagation velocity of fiber breakage damage of the specimen Number 1 is faster than that of specimen Number 2. In a summary, the damage event occurring sequence and the damage propagation velocity have great effect on the nonlinear behavior of specimen Number 2.
6. Conclusions
- (1)
The predicted stress-strain curve of specimen Number 1 with a low braiding angle almost keeps linear, and the linear feature of the curve is consistent with the experimental curve. The results indicate that the breakage behavior of 3D braided composites with a low braiding angle exhibits obvious brittle.
- (2)
The predicted stress-strain curve of specimen Number 2 with a large braiding angle keeps nonlinear, and the nonlinear trend of the curve is consistent with the experimental curve. The macroscopic nonlinear behavior of 3D braided composites with a large braiding angle is mainly influenced by the yarn shear nonlinearity and the damage accumulation.
- (3)
The damage event occurring sequence and the damage propagation velocity have resulted in the different failure mechanisms of 3D braided composites with different braiding angles, which finally influences their macroscopic mechanical behavior.
- (4)
For 3D four-directional braided composites subjected to tensile loading, since the shear stress component in the yarns is comparable to the tensile stress component, the contribution of the yarn shear nonlinearity to obtaining the reasonable strength prediction should not be neglected in damage analysis. Meanwhile, the results indicate that the shear nonlinearity parameter of yarn has a certain effect on the stress-strain curves of 3D braided composites with different fiber volume fractions.
Acknowledgments
The author would like to acknowledge the support given by the Fundamental Research Funds for the Central Universities (Grant no. ZYGX2011J122) and the National Natural Science Foundation of China (Grant no. 11302045).


