Optimizing Containment and Control of Candida parapsilosis Fungemia among Neonates in the Outbreak Setting Using a Mathematical Modeling Approach
Abstract
Candida is the second leading cause of sepsis related death in the neonatal intensive care unit (NICU). Using the C. parapsilosis paradigm, the endogenous and exogenous routes of infection were simulated in order to enhance prevention among neonates at highest risk. A deterministic model was constructed with transmission parameters calculated from the basic reproductive number (R0), derived from the mean serial interval from two published outbreaks. Uncertainty and sensitivity analyses were performed via Latin hypercube sampling. Prevention measure effects were ascertained by incorporating percent coverage and efficacies into the existing model. The colonized and infected neonatal prevalence peaked at 17.4% and 39.4%, respectively, and reduction was achieved by compartmental replacement with susceptibles. Containment of greater than 60% of the cohort had minimal effect on the effective reproductive number (Re) unless hand hygiene compliance dropped below 40% at a fixed ratio of nurses to neonates. Antifungal prophylaxis in combination with hand hygiene and cohorting extinguished an outbreak 14 days sooner than baseline. The critical proportion (pc) requiring prophylaxis in order to stop an outbreak increases, as R0 rises, and the prophylaxis efficacies decrease. Internal and external sources of Candida lead to invasive disease in neonates differentially. Optimal prevention is dependent upon understanding the dynamics of this disease process under diverse circumstances.
1. Introduction
Candida species are commensals of the human gastrointestinal tract and skin but can become pathogenic, being the fourth leading cause of bloodstream infections in the United States [1]. Candida parapsilosis is an “emerging fungal pathogen,” with infection incidences increasing globally [2]. According to data from the ARTEMIS DISK Surveillance Program (1997–2005), C. parapsilosis was the fourth most common yeast isolated with an estimated prevalence of 4%–7% and the second most common yeast associated with bloodstream infections [3, 4]. C. parapsilosis candidemia prevalence is 4%–34%, depending upon the time period, location, and host factors [5]. In particular, neonates—defined as infants whose age is within 30 days following birth—are especially vulnerable to this infection. Though attributable mortality is 10% over 10 years in neonates despite therapy—lower than that due to other Candida species, overall, the genus is the second leading cause of death from sepsis in the neonatal intensive care unit (NICU) [6, 7].
Colonization precedes infection. The gastrointestinal tracts of 10% of neonates are colonized within the first 5 days after birth, mostly from mother to neonate via the birth canal [8, 9]. Candidemia is usually endogenously acquired through host gastrointestinal tract translocation, given the immaturity of the neonatal gut wall integrity and immune system. However, healthcare-related exogenous transmission from fomites such as biofilms within implantable devices and indwelling catheters contaminated total parenteral nutrition, and contact with the colonized hands and fingernail beds of healthcare workers (HCW) has been reported sporadically and in the outbreak setting as evidenced by molecular epidemiologic studies [10, 11]. Indeed, recent molecular typing advances have confirmed nosocomial clusters that may have previously not been noticed and the clonality of infection [12, 13]. Although some investigators have reported large outbreaks of C. parapsilosis bloodstream infections among adults [14], the majority have occurred among neonates [15–17].
I report the construction of a deterministic, compartmental model of C. parapsilosis invasive disease among neonates in the NICU unit in order to better understand optimum prevention strategies.
2. Methods
2.1. Model Structure and Parameterization
| Parameter | Meaning | Standard value (range) | Comments and/or reference |
|---|---|---|---|
| a | NICU admission rate (includes births per day) |
|
[18] |
| m | Nondisease causing death rate | 0.0001 (0.000001–0.08) per day | 4% per year [19, 20] |
| μ | Disease induced mortality rate |
|
10% over 10 years [6, 7] |
| β1 | Exogenous transmission rate for infection from reservoir |
|
[16, 17] |
| β2 | Endogenous transmission rate for infection from gut colonization |
|
[15] |
| φ | Colonization rate with epidemic strain |
|
10% in first 5 days of life [8, 9, 11] |
| γ | Recovery rate |
|
Days for successful clearance = 5 (3–8) days [21] |
| σ | Fomite generation rate |
|
Based on NICU hand hygiene, colonization, survival, and transmission studies [8, 22, 23] § |
| ε | Fomite decay rate |
|
ε = ln2/t1/2 where C. parapsilosis half-life (t1/2 ) on hands = 12.8 minutes [23] |
| r | NICU readmission rate |
|
[20, 24] |
| d | Discharge rate | 0.029 (0.020–0.294) per day | Adjusted length of stay = 34.3 (3.4–49.0) days [20, 25] |
| p | Handwashing compliance proportion | 0.40 | [26] |
| h | Handwashing efficacy | 0.90 | [26] |
| q | Cohorting probability | 0.80 | [27] |
| n | Neonate to nursing ratio | 3 | [27] |
| α1 | Colonization reduction efficacy | 0.63† 0.64‡ | [28–31] |
| α2 | Infection reduction efficacy | 0.88† 0.79‡ | [28–31] |
| π | Prophylaxis proportion | 0.29 | [32] |
- §σ = (probability of effective transmission from hand to object per contact) × (prevalence of C. parapsilosis on healthcare worker hands) × (average number of direct contacts with neonate in NICU per day).
- †Selective digestive decontamination (SDD) prophylaxis.
- ‡Systemic antifungal prophylaxis.
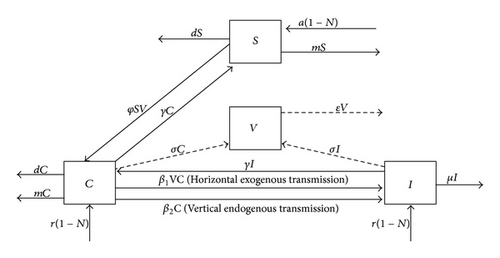
The transmission parameters—β1 and β2—were calculated from published outbreak data in which the source of infection was primarily exogenous and endogenous, respectively [15, 16]. Specifically, the basic reproductive number (R0)—the expected number of secondary cases (infected) arising from an average primary infected individual in an entirely susceptible population—was estimated from the mean generation or serial interval (Tc) using the method previously described by Wallinga and Lipsitch [33]. Defined as the average duration of time between infection of an initial case and a subsequent case presumed to have arisen from the initial case, each Tc was derived from the epidemic curve of each outbreak and assumed unchanging as the outbreaks proceeded. The assumptions that (1) the perpetuation of infection was by a unique clonal strain of C. parapsilosis and that (2) initial cases begot subsequent cases made the approximation of Tc tenable. I assumed a delta distribution of the generation interval, where ρ is the exponential growth rate of new infections per capita, such that R0 = exp ρTc, as illustrated by Wallinga and Lipsitch. To calculate ρ, I used the midpoint time interval of each month since the outbreak began. The number of new infections per unit of time in days was summed to construct a cumulative growth rate curve for each outbreak. Cumulative new infections per interval were then ranked in ascending order, and median ranks were calculated. Since these outbreaks included left and interval censored data and the hazard varied with time, a Weibull parametric distribution was chosen to fit the data. Because the logarithmic probability plot of the cumulative hazards function (i.e., ln [−ln {1/1 − median rank} versus ln(cumulative new infections)) was approximately linear—the requirement for fitting any exponential distribution, Weibull parameters were calculated from a constructed simple-linear regression line between these dependent and independent variables. ρ was then calculated as the inverse of the Weibull scale parameter [34]. R0 = β/γ yielded an estimate of the transmission parameters (Table 1).
All analyses were performed utilizing Microsoft Excel 2010 and “R” version 2.14.1. I used an embedded Runge-Kutta family method for solving the ODE (“R” package: deSolve) [35, 36].
2.2. Uncertainty and Sensitivity Analyses
In order to enable characterization of the uncertainty in state variable outcomes consequential to parameter variability (since the parameter values differ to some degree from study to study), I pursued a random Latin hypercube sampling approach for computational simplification. After making 1000 runs of the model by including the parameter point estimates and ranges, a large, random sample, that created a probability distribution function of the 1000 values for each of the parameters, was independently chosen—one set being selected at a time without replacement (i.e., each permutation could be chosen only once). From this input, I produced a frequency distribution of values for each of the state variable outcomes in the model—the uncertainty analysis. To determine the sensitivity or robustness of state variables to variation in the parameter values, a plot of the different parameter set residuals as a function of time for each state variable outcome was made. These results were also ranked according to the partial rank correlation coefficient (PRCC) between the parameter and the outcome sets from the uncertainty analysis to identify the statistically most influential (|PRCC| ≥ 0.5) and significant (P < 0.05) (“R” package: “FME”)—the sensitivity analysis [37, 38]. The uncertainty and sensitivity analyses were performed in the absence of interventions.
2.3. Prevention Measure Simulations
The effective reproductive number (Re) was the expected number of secondary cases arising from an average primary infectious case (Re = R0S). When Re = 1, equilibrium (i.e., when the transition rates between compartments of a system were zero: dS/dt = dC/dt = dI/dt = dV/dt = 0) was achieved, and the outbreak ceased. Therefore, if the equilibrium value of the state variables were represented by “*,” then R0 = 1/S* (i.e., S* = a(1 − N)/(φV + m + d); see (1)). To ascertain optimum, scenario-specific infection control options, I incorporated the following interventions: (1) strict hand hygiene practices, (2) cohorting, (3) selective digestive decontamination (SDD), and (4) systemic antifungal prophylaxis. The assumption of independence among utilization of these strategies was made.
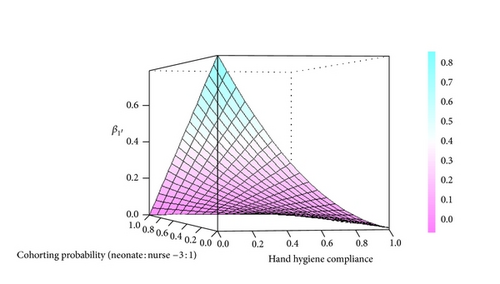
The effect of hand hygiene was such that Re = R0(1−ph)2, where p represented the percent compliance with handwashing and h represented handwashing efficacy [39]. I assumed 40% compliance and 90% efficacy with an undiluted 4% chlorhexidine gluconate in alcohol based hand wash among HCWs not bearing artificial or untrimmed fingernails and hand jewelry [26]. If the cohorting probability, q, represented the proportion of HCW that did not move between the same neonate, 80%, and n represented the ratio of neonates to nurses in the NICU, 3, then Re = R0 (1 − q)/(1 − 1/n), since Re was the product of R0 and the proportion of the population that were at risk [27, 39]. Finally, a combination of effective hand hygiene and cohorting was calculated from Re = R0 (1− ph)2(1 − q)/(1 − 1/n) [27]. The primary source affected most immediately by these two interventions was exogenous, and so the R0 calculated from the C. parapsilosis outbreak described by Huang et al. was used, permitting calculation of a new for each strategy and the combination of the two [16]. Simulations were rerun using these intervention parameter values.
3. Results
3.1. Model Structure and Parameterization
To calculate the exogenous transmission rate, β1, data from the outbreak investigated by Huang et al. were utilized [16, 17]. The Tc for this outbreak was estimated as 13.8 days. The Weibull scale parameter was 15.2, so ρ was 0.07 per day. Thus, R0 from this exogenous outbreak was estimated at 2.63, and so β1 = 0.53 per (infective) contact per day. To estimate the endogenous transmission rate, β2, data from the outbreak investigated by Saxen et al. were used [15]. The Tc for this outbreak was approximately 28.4 days. The Weibull scale parameter was 73.1, so ρ was 0.014 per day. Hence, R0 from this primarily endogenous outbreak was estimated at 1.49, and so β2 = 0.30 per (infective) contact per day (Table 1).
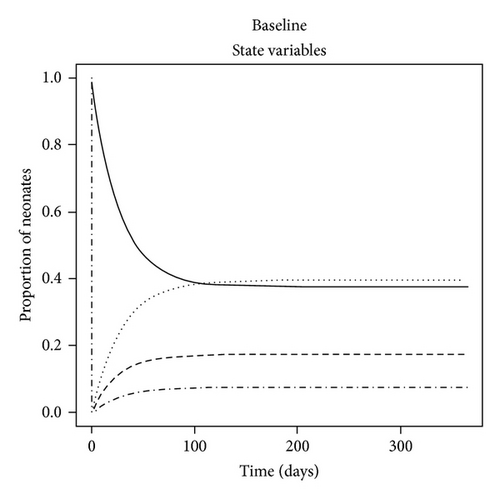
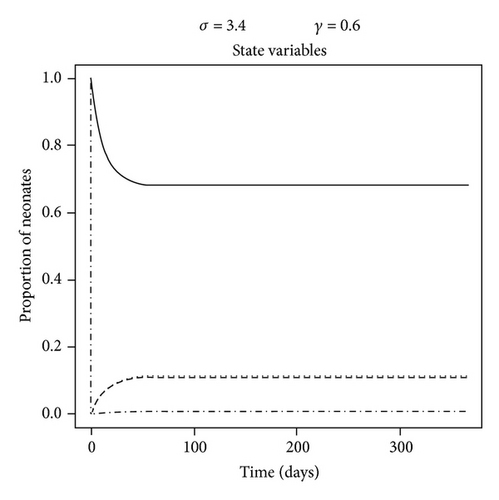
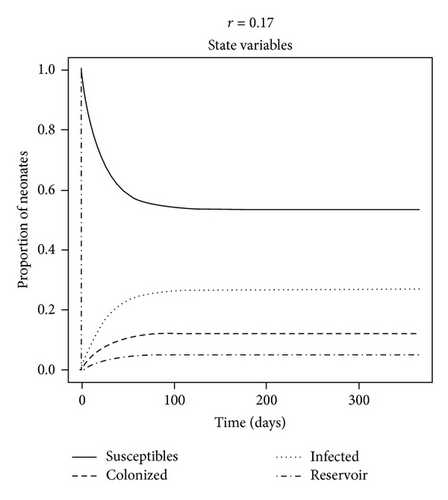
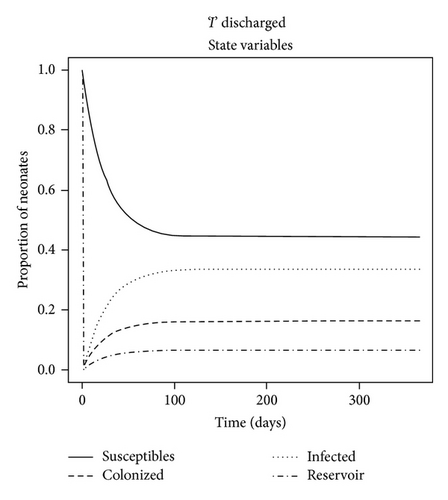
The dynamics of the state variables are listed in Figure 2. In the absence of any intervention, the prevalence of C. parapsilosis colonized and infected neonates initially increased exponentially but then peaked on average at 17.4% and 39.4%, respectively, by one year at baseline. In contrast, the prevalence of susceptible neonates and HCW fomites reduced to a steady level of approximately 37.5% by this time (Figure 2(a)). When certain parameter estimates were changed, the model dynamics shifted in different manners. For example, reducing the fomite generation rate, σ, and increasing the recovery rate, γ, threefold forced the prevalence of infected neonates to coincide with that of those merely colonized at 11% (Figure 2(b)). This is because the duration of infectiousness (1/γ)—and to some extent exposure via σ—was reduced, such that infected (and colonized) neonates were being removed from the NICU and replaced with mostly susceptible neonates. Algebraically manipulating the four ODE (1)–(4) at equilibrium demonstrated that the modifiable parameters that appeared to impact most of the state variables were the NICU readmission rate, r, and the discharge rate from “C,”, d—independent of all causes of morality m and μ (not shown); in the baseline model, discharge of infected was not permitted, as such neonates were deemed too sick to leave the NICU, whereas colonized could be discharged alive and sequestered from the unit. If r was decreased by one-half, the epidemic exhibited a similar dynamics to a situation in which discharges from “I” (e.g., to another high level care unit) as well as “C” were possible (see Figures 2(c) and 2(d)). Therefore, discharging infected neonates from the NICU was as effective in reducing “I” as screening for and halving the entry rate of colonized and infected neonates (33% versus 27%, P = 0.8). In general, “I” was much higher than “C” due to (1) the force of infection from endogenous and exogenous sources and (2) discharges not occurring from the infected state unless the patient died in the baseline model.
3.2. Uncertainty and Sensitivity Analyses
Figure 3(a) depicts the uncertainty in the state variables according to parameter variability. The largest uncertainty occurred in the “C” and “I” compartments. The mean prevalence for colonization and infection was 22% ± 4% and 41% ± 11%, respectively. The range for the prevalence of colonization and infection was 13%–36% and 9%–68%, respectively, with 90% of values falling between 16.2% and 19.0% and 23.4% and 33.0% (skewed), correspondingly. The proportion of neonates in the NICU remaining susceptible to colonization/infection by the same time period was 19.4% ± 9.3%, and “V” maintained a low level of fomite transmission potential to neonates (8.4% ± 3.6%).
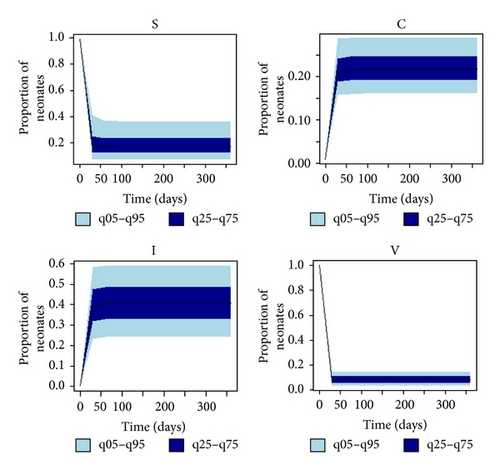
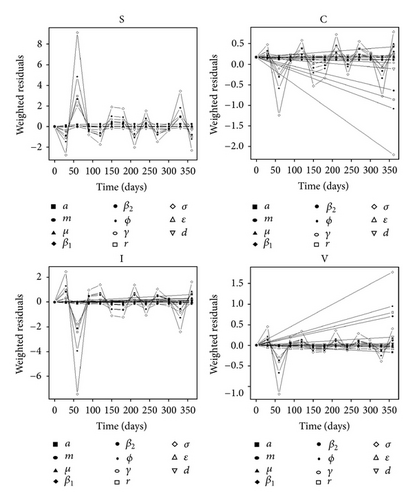
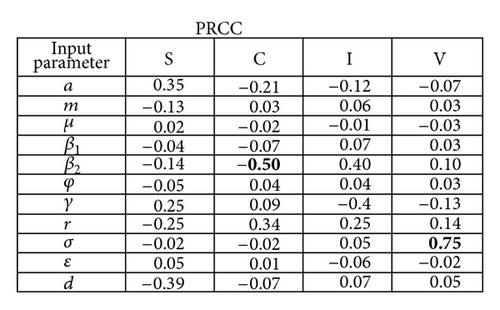
Figure 3(b) depicts the sensitivity analysis of the state variables to uncertainty in the parameters. Over time, the parameter with the highest imprecision significantly affecting “C” was β2 (PRCC = − 0.50, P-value = 0.005), whereas “V” was mostly influenced by variability in σ (PRCC = 0.75, P value < 0.00001). The state variables were most sensitive to perturbations in the fomite generation rate, σ. In particular, they were affected by fluctuations in variables that pertained to exogenous transmission: r, σ, and β1. Initial depletion and repletion of susceptible neonates explained the illustrated pattern among the graphs in Figure 3(b) until the equilibrium value in the “S” compartment was achieved.
3.3. Prevention Measures Simulations
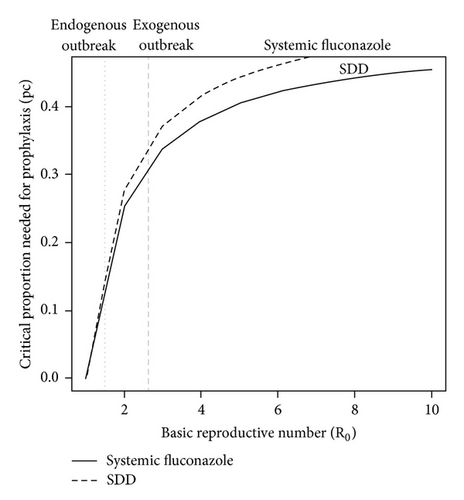
The calculated with strict hand hygiene was 0.22, with cohorting was 0.35, and with the combination was 0.14. Limiting contact to more than 60% of the cohort at a fixed nursing to neonate ratio of 1 : 3 had minimal effect on unless the hand hygiene compliance dropped below 40% (Figure 4). The combination of systemic fluconazole prophylaxis, strict hand hygiene, and cohorting led to the outbreak attaining equilibrium 14 days earlier than in the absence of any intervention (from day 99 to day 85). As illustrated in Figure 5, the critical proportion (pc) that must receive antifungal prophylaxis in order to stop an outbreak was comparable between systemic fluconazole and SDD but was greater as R0 rises (e.g., 62% in the exogenous outbreak versus 30% in the endogenous outbreak).
4. Discussion and Conclusions
With C. parapsilosis as the paradigm, this study has shown that internal and external sources of Candida can lead to invasive disease in neonates differentially. This has implications on surveillance and prevention efforts for candidemia in the NICU when the number of infections exceeds that which is expected based on average known endogenous rates that represent the minimum background level of disease. Choosing the best prophylaxis strategies is dependent upon understanding the dynamics of this disease process under various conditions.
In the absence of an intervention, the prevalence of C. parapsilosis colonized and infected neonates peaked on average at 17.4% and 39.4%, respectively, (90% of values falling between 16.2–19.0% and 23.4–33.0%, respectively). However, reducing the duration of infectiousness forced the prevalence of infections to decrease, such that infected neonates were removed from the NICU and replaced with susceptible and colonized neonates. Further proof of this concept is that changing modifiable parameters such as the readmission rate, r, and the discharge rate, d, led to rapid extinction of an outbreak, independent of changes in all-cause mortality, μ and m. Also, the uncertainty in β2 was most influential on “C,” whereas “V” was most robust to imprecision in σ, but neither had similar effects on the most important compartment for prevention, “I.” This finding from the sensitivity analysis suggests that despite the inherent uncertainty in estimation from observational data, the model parameters were reasonable, since the proportion infected was not highly influenced by any.
Four practical interventions were simulated: strict hand hygiene, cohorting, SDD with nystatin, and systemic fluconazole prophylaxis. If colonized and/or infected neonates are grouped in a restricted environment (i.e., cohorting), an outbreak may be stopped even if hand hygiene compliance decreases, provided the ratio of nurses for every neonate increases. However, if this ratio is fixed, proper hand hygiene compliance will need to increase if the cohorting probability decreases. The present study illustrated that restricting contact to more than 60% of the cohort at a fixed nursing to neonate ratio of 1 : 3 had little effect on the exogenous transmission probability unless the hand hygiene compliance dropped below 40%. Unfortunately, while the efficacy of barrier methods for reducing the transmission of viral and bacterial pathogens is well established, there is little quantitative evidence basis that such contact rate reducing methods work in the prevention of Candida transmission in the NICU [41].
Fluconazole reduced both exogenous and endogenous transmissions, but SDD with nonabsorbable oral antifungals such as nystatin reduced endogenous transmission primarily. Since the efficacy of both strategies on “C” and “I” was comparable according to the literature cited [28, 31], this study asserted that the minimum proportion to receive either prophylaxis to stop such a candidemia outbreak was approximately the same unless R0 increases greatly, and/or the limit of α1α2 approached zero, since the function is hyperbolic. This is of practical importance if the patient population is more immunocompromised such as children with severe combined immunodeficiency (SCID), where defects in both humoral and cellular mediated immunity increase the probability of colonization and infection despite chemoprophylaxis—decreasing α1α2 dramatically!
However, each prophylaxis type has its own advantages and disadvantages. When combined with strict hand hygiene and cohorting, these antifungal prophylaxis strategies ceased an outbreak two weeks sooner. Although selection of resistant phenotypes may occur over time with certain nonalbicans Candida when antifungals are used habitually, the lack of significant resistance emergence makes systemic fluconazole prophylaxis an effective containment strategy in the outbreak setting [28, 42, 43]. In preterm neonates, it did not decrease all-cause and fungal attributable mortality significantly according to the multicenter, randomized controlled trial by Manzoni et al. [28], but contradictory findings have been reported [43]. SDD may have a role in infection control, when gut translocation is a persistent source, as can be the case with the critically ill. Moreover, SDD may work indirectly to diminish skin colonization and resistance, though this point is controversial. Finally, SDD avoids the systemic toxicity and drug interaction potential found with azoles, amphotericin B, and echinocandins, though C. parapsilosis is known to have a higher minimum inhibitory concentration to the latter. Thus, a good strategic approach may be to initially use the antifungal strategy in which the product of α1 and α2 is greatest if R0 is very high, which corresponds to the maximum incline of the epidemic curve during an outbreak since R0 = exp ρTc. This will reduce the coverage proportion needed and associated systemic antibiotic exposure and, perhaps, costs. However, transitioning to a more cost effective antifungal or using it as the mainstay if R0 is not too high—assuming comparable efficacies—may be prudent.
This study had several limitations. First, due to limited information from the epidemic curves from the two outbreaks (i.e., no contact tracing), I needed to assume that the serial intervals were constant and independent and that their probability distribution function approximated the average observed value [33]. However, the mean generation interval decreases with time when infection occurs from multiple sources (i.e., since the growth rate, ρ, increases with multiple source infection a scenario in which Tc is shortened, according to ln R0/Tc = ρ) [44]. In addition, these outbreak data may not necessarily reflect the pure transmission dynamics of invasive disease such as candidemia in the absence of interventions, making calculation of the serial interval suboptimal. Thus, I focused on short range vehicles (e.g., HCWs), in which organisms divide less frequently, rather than long range vehicles, such as total parenteral nutrition which would affect reservoir dynamics. Moreover, calculation of the α parameters was dependent upon studies that used invasive disease and not just the subgroup—candidemia—as an endpoint, likely underestimating the efficacy on pure bloodstream infections alone. Finally, since the NICU has a high turnover rate and relatively small capacity, random effects may have predominated making stochastic modeling more desirable. Nonetheless, Boldin et al. demonstrated that deterministic and stochastic models of ICU pathogen colonization transmission resulted in similar conclusions—the former modeling technique affording more lucidity and interpretability to a clinical audience [45].
In the future, application of similar methods to other systems of infection control importance, such as toxigenic Clostridium difficile, may be useful given the similarities to Candida parapsilosis with respect to endogenous modes of transmission. Finally, incorporation of these techniques, through a simultaneous hierarchical approach at the microscopic and macroscopic levels, will enhance the conceptual framework of antimicrobial pharmacodynamic modeling that is essential to the drug development process needed in this era of “bad bugs … no drugs.”
Conflict of Interests
Although A. A. Panackal has no conflict of interests to report, he performed this study on his own time but currently holds an academic appointment as a civil servant at USUHS.
Acknowledgments
The author thank Dr. Marc Lipsitch from the Harvard School of Public Health and Dr. Christie Jeon from UCLA for their feedback on this project. The author thank Dr. Sarah Holte from the University of Washington for her statistical advice on this project.


