A New Evapotranspiration Model Accounting for Advection and Its Validation during SMEX02
Abstract
Based on the crop water stress index (CWSI) concept, a new model was proposed to account for advection to estimate evapotranspiration. Both local scale evaluation with sites observations and regional scale evaluation with a remote dataset from Landsat 7 ETM+ were carried out to assess the performance of this model. Local scale evaluation indicates that this newly developed model can effectively characterize the daily variations of evapotranspiration and the predicted results show good agreement with the site observations. For all the 6 corn sites, the coefficient of determination (R2) is 0.90 and the root mean square difference (RMSD) is 58.52W/m2. For all the 6 soybean sites, the R2 and RMSD are 0.85 and 49.46W/m2, respectively. Regional scale evaluation shows that the model can capture the spatial variations of evapotranspiration at the Landsat-based scale. Clear spatial patterns were observed at the Landsat-based scale and are closely related to the dominant land covers, corn and soybean. Furthermore, the surface resistance derived from instantaneous CWSI was applied to the Penman-Monteith equation to estimate daily evapotranspiration. Overall, results indicate that this newly developed model is capable of estimating reliable surface heat fluxes using remotely sensed data.
1. Introduction
Evapotranspiration (ET) is a very important process which relates to energy and water exchange between the hydrosphere, atmosphere, and biosphere [1, 2]. The research on evapotranspiration is very crucial to further our understanding of global climate change, land-atmosphere interaction, water cycle, and ecological studies [3–5]. Recently, the “evaporation paradox,” which is referred to as the decreasing pan observations and the increasing surface air temperature over the past 50 years, has been reported in many regions around the world [6–8]. Pan evaporation provides a measurement of the integrated effect of radiation, wind, temperature, and humidity on the evaporation from an open water surface. Actual evaporation is the quantity of water that is actually removed from natural surfaces. There is a need to understand the change of actual evapotranspiration at regional and global scales behind evaporation paradox. Actual evapotranspiration is a key factor to understand the regional water cycle and energy balance. An in-depth understanding of regional evapotranspiration will benefit the water resource planning and management in arid and semiarid areas [9].
As a promising means of land surface observation, remote sensing has some salient characteristics, such as large scale coverage, multitemporal observation, and low cost, and it provides excellent datasets for estimating regional evapotranspiration [10]. Many studies have been carried out on the retrieval of regional evapotranspiration based on remote sensing. A lot of remote sensing based evapotranspiration models have been proposed and used in different regions of the world. Jackson et al. [11, 12] is one of the pioneers who investigated the regional evaporation retrieval based on thermal infrared observations from remote sensing. Subsequently, many scholars developed different kinds of models based on different assumptions. These models can be roughly divided into four categories. (1) The first category is empirical/statistical models [13, 14]. As a good example of this category, Jung et al. [15] estimate global land-ET based on FLUXNET, remote sensing, and meteorological observations. (2) The second one is surface energy balance based single and dual source models [16–20]. The surface energy balance system (SEBS) model developed by Su [20] is a good example of the surface energy balance-based single source model. The two-source approach proposed by Norman et al. [19] to distinguish vegetation transpiration and soil evaporation is a good representation of the surface energy balance-based two source model. Coupled with a time-integrated component connecting surface sensible heating with planetary boundary layer development, Anderson et al. [21] proposed a two-source time-integratedmodel for estimating surface fluxes. Recently, the Atmosphere-Land Exchange Inverse (ALEXI) model was developed by Anderson et al. [16, 17] and they applied this model to study the continental evapotranspiration based on thermal infrared observations from geostationary satellites. (3) The third category is spatial contextual models based on land surface temperature-vegetation index space (Ts/VI). This category includes the works by Moran et al. [22], Roerink et al. [23], Jiang and Islam [24], Zhang et al. [25, 26], Wang et al. [27], Stisen et al. [28], and Shu et al. [29]. In general, three types of feature space are often used in the spatial contextual models. They are LST/NDVI space, LST/albedo space, and ΔT/NDVI (ΔT, temporal changes of LST). Comprehensive reviews of models in this category can be found in the recent papers by Carlson [30] and Petropoulos et al. [31]. (4) The fourth one is Penman-Monteith equation based models. Cleugh et al. [32] used NDVI and LAI to calculate surface resistance and applied this approach to map the regional ET for Australia from 2001 to 2004. Later, Mu et al. [33, 34] further revised Cleugh’s approach and developed a global remote sensing ET algorithm. Comprehensive reviews of methodologies for regional ET estimation from remotely sensed data can be found in the papers by Kalma et al. [35] and Li et al.[36].
Although great progress has been made on ET estimation based on remote sensing, there are still many pending issues that have not been solved properly. Firstly, advection having great impact on ET has been reported by many field measurements [37]. Wang et al. [38] noticed a significant “desert-oasis effect” in the Heihe River Basin Field Experiment (HEIFE). Tolk et al. [39, 40] observed that ET can be enhanced greatly by advection in the semiarid regions of the southern High Plains. In some experiments, ET can even exceed net incoming radiation due to advection from the surrounding landscape. Allen et al. [41] found that 24 h ET from alfalfa, as measured by lysimeters, is larger than net radiation (Figure 1 in his paper). Oke [42] also observed that daily ET from a minilysimeter exceeds the net radiation. Rijks [43] found that the evaporation rate is 1.8 times greater than the supply of net radiation. It is not uncommon in semiarid, advective environments to have ET that exceeds (Rn − G) by 30–50% (Terry A. Howell, 2011, personal communication). However, (Rn − G) is often used as the potential rate of ET in most surface energy balance-based single and dual source models. Penman-Monteith equation based models may be useful under advective environments, but the parameterization scheme of the surface resistance based on LAI and NDVI is far from being validated. Secondly, the development of an accurate method for extrapolating instantaneous estimates to daily values is imperative. The evaporative fraction method is widely used to derive daily ET [20]. However, contrary conclusions have been drawn by different scholars. Chávez et al. [44] evaluated six extrapolation methods and they suggested that the evaporative fraction method showed the best performance. Farah et al. [45] evaluated the temporal variability of the evaporative fraction in a tropical watershed and found a good relationship between daily and average day evaporative fraction. While Crago [46] derived a quite different conclusion, he suggests that a complicated combination of weather conditions, soil moisture, and biophysical conditions contributes to the conservation of evaporative fraction. Hoedjes et al. [47] showed that evaporative fraction is almost constant under dry conditions, but it is depicted as a concave shape under wet conditions. The reference ET based extrapolation fraction method was proposed by Allen et al. [48] to scale daily ET from instantaneous ET values. However, Chávez et al. [44] indicated that this method overestimates daily ET by about 4 ± 10.0% (MBE ± RMSE).
In this paper, a new ET model was proposed to account for advection based on the crop water stress index (CWSI), and then this method was employed to estimate ET at both local and regional scales. Section 2 presents a description of ET from natural nonsaturated surfaces and the CWSI concept. Section 3 introduces the datasets used to assess the model at site scale and regional scale. Section 4 firstly reports the evaluation of the model performance at site scales and then presents the results of the model applied to regional scale with variables from Landsat based variables. In the remainder of Section 4, daily ET was estimated using the surface resistance derived from CWSI. Section 5 discusses the limitations in this work and the final section gives a conclusion.
2. Theory and Methodology
2.1. Evaporation from Natural Nonsaturated Surfaces
2.2. Crop Water Stress Index and Surface Resistance
2.3. Aerodynamic Resistance
3. Study Area and Data Description
3.1. SMACEX02 Experiment
The Soil Moisture-Atmosphere Coupling Experiment (SMACEX) was designed to provide a multiscale dataset of vegetation, soil, and atmospheric states [71, 72]. It was undertaken over Iowa, US, from June 19 through July 9 in 2002. The primary objective was to extend microwave soil moisture observations and retrieval algorithms to changing crop biomass conditions and to provide validation data for the Advanced Microwave Scanning Radiometer (AMSR) brightness temperature and soil moisture retrieval algorithms. The Walnut Creek watershed was the core study area of this experiment. The land cover in the Walnut Creek watershed is primarily comprised of corn and soybean. The details of this experiment can be found in the paper by Kustas et al. [71].
3.2. Tower Measurements
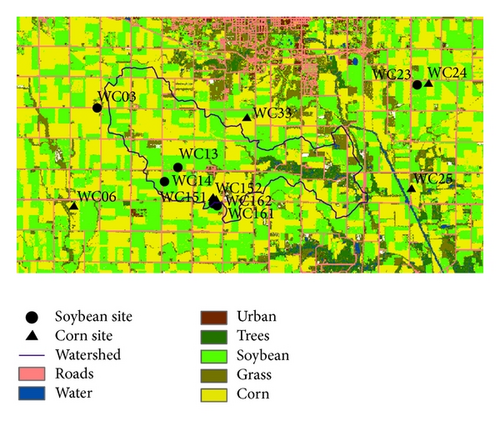
Most of the SMACEX measurements include the surface energy, water, and carbon fluxes, as well as mean and turbulent atmospheric boundary properties. Twelve field sites with eddy covariance (EC) were deployed in the central area of the study. There were 6 corn sites and 6 soybean sites. However, for the WC03 site, the land cover was classified as soybean in the field notes but was located in a corn field based on the provided coordinates [73]. The towers were instrumented with sensors to measure turbulent fluxes of water vapor and sensible heat, as well as net radiation and soil heat flux at 30 min intervals. The distribution of flux towers in the Walnut Creek catchment and the land use classifications are provided in Figure 1. Additional hydrometeorological observations included wind speed and direction, air temperature, vapor pressure, near-surface soil temperature, and moisture at 10 min intervals. In this study, the hydrometeorological data were resampled to 30 min to be compatible with heat flux measurements. Correction was performed using the approach suggested by Twine et al. [74], which assumes that the energy nonclosure is caused by EC underestimation, while the corresponding Bowen ratio is correctly estimated. Based on this approach, sensible and latent heat fluxes were adjusted by forcing the energy balance closure using the measured net solar radiation, soil heat flux, and Bowen ratio. The tower based composite radiometric surface temperature was measured by Apogee infrared thermometers. Su et al. [72] corrected the tower-based composite radiometric surface temperature and applied it to evaluate the SEBS model. In this study, the correction method proposed by Su was employed. In our revised model, vegetation height is a very important parameter. During the experiment, LAI, vegetation fraction, and vegetation height were measured at each site on 18 and 28 June and 2 and 5 July. In this study, the vegetation height was set as 1.5 m for the corn sites and 0.35 m for the soybean sites.
3.3. Remote Sensing Dataset
In this study, one scene from the Enhanced Thematic Mapper plus (ETM+) on Landsat 7 acquired at 10:40 local time on DOY 182 of 2002 was used. The remote sensing dataset is obtained from the National Snow and Ice Data Center (http://nsidc.org/index.html). Emissivity was derived with the fractional cover mixing model proposed by Sobrino et al. [75]. The land surface temperature was derived from the thermal band of the Landsat imagery based on the method proposed by Li et al. [76]. Albedo was derived from the visible and near-infrared bands of the Landsat imagery using algorithm in Liang [77] and Liang et al. [78]. Land cover classification for the SMEX02 area was obtained from Landsat ETM dataset, which is available from the National Snow and Ice Data Center. The vegetation height was parameterized using the land cover classification. The details of the meteorological data and remote sensing data used in this study are listed in Table 1.
Instantaneous estimation (satellite overpass time value) |
Daily ET estimation (daily mean value) |
|
|---|---|---|
| Meteorological variables | ||
| Incoming solar radiation (W/m2) | 958 | 344.72 |
| Air temperature (°C) | 29.35 | 27.31 |
| Water vapour pressure (kPa) | 2.2 | 2.22 |
| Wind speed (m/s) | 5.32 | 5.16 |
| Atmospheric pressure (kPa) | 98.2 | 98.5 |
| Remote sensing data | Landsat ETM+ | |
| Overpass time (Local time) | 11:40 | 11:40 |
| Model resolution | 60 m | 60 m |
| LST resolution | 60 m | 60 m |
| Albedo | 60 m | 60 m |
| Emissivity | 60 m | 60 m |
| Classification | Aggregated from Landsat based classification | |
4. Results
4.1. Sites Evaluation
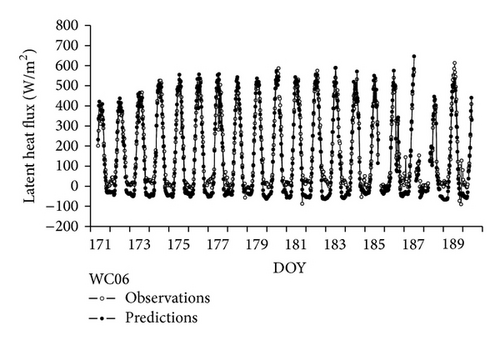
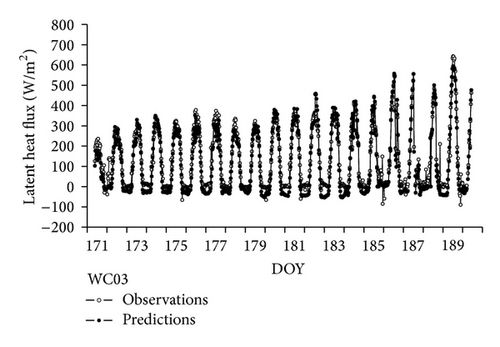
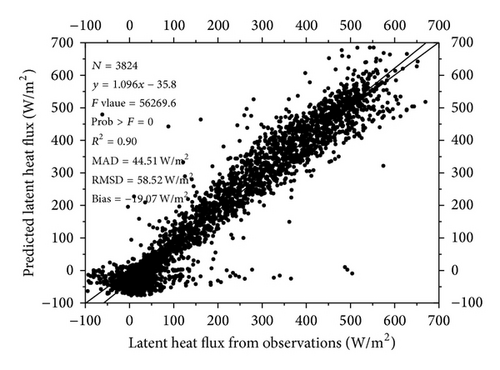
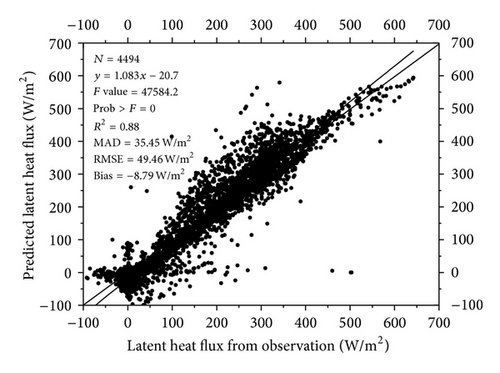
The ET model was applied to the site scale of SMACEX02 with a 30 min time step. Predicted ET from the proposed model was compared with the observation from the eddy covariance system. Two strategies were used to assess the performance of this new model. Firstly, time variations of modeled latent heat flux and the corrected eddy covariance measurements are compared through DOY 171–190. Figures 2 and 3 represent the modeled results compared with the observations for WC 06 (corn site) and WC03 (soybean site), respectively. The results indicate that the modeled ET is in good agreement with the observations except for a slight underestimation at night time at both sites. The mean absolute difference (MAD) and the root mean square difference (RMSD) are 41.90 W/m2 and 50.63 W/m2 for the WC06 site. The MAD and RMSD are 30.75 W/m2 and 38.22 W/m2 for the WC03 site. Quantitative measures of the model performance for other sites are listed in Table 2. Overall, the comparison reveals that this model can effectively describe the daily evapotranspiration variations. Secondly, scatter plots of modeled results against observations were applied to the sites with the same land cover. Figure 4 shows the evapotranspiration predictions against observations from all corn sites. For the corn sites, 3824 samples are used. Most of the points are evenly distributed along the 1 : 1 line, indicating a good fitness of the modeled results to the observations. The R2 (coefficient of determination) is 0.90; MAD and RMSD are 44.51 W/m2 and 58.52 W/m2. The slope and the intercept of the fitted line are 1.096 and −35.8 W/m2. For the soybean sites, 4494 samples are used. Figure 5 illustrates the evapotranspiration predictions against observations from all soybean sites. Most of the points are close to the 1 : 1 line. The slope and the intercept of the fitted line are 1.083 and −20.7 W/m2. The R2 is 0.88; MAD and RMSD are 35.45 W/m2 and 49.46 W/m2, respectively. The quantitative measures for the two categories of sites show that this model is robust to estimate latent heat flux.
| Site | N | MAD (W/m2) | RMSD (W/m2) | R2 | Bias (W/m2) |
|---|---|---|---|---|---|
| WC03 | 835 | 30.75 | 38.22 | 0.93 | −20.27 |
| WC06 | 840 | 41.9 | 50.63 | 0.92 | −26.26 |
| WC13 | 771 | 48.1 | 62.2 | 0.66 | 0.92 |
| WC14 | 827 | 32.91 | 55.09 | 0.87 | 5.36 |
| WC23 | 625 | 19.99 | 27.3 | 0.96 | 10.79 |
| WC24 | 538 | 52.17 | 76.26 | 0.86 | −14.87 |
| WC25 | 488 | 50.38 | 67.86 | 0.8 | 3.51 |
| WC33 | 801 | 38.27 | 48.25 | 0.92 | −21.51 |
| WC151 | 372 | 38.05 | 49.39 | 0.93 | −17.74 |
| WC152 | 789 | 47.81 | 59.67 | 0.89 | 18.725 |
| WC161 | 664 | 42.2 | 57.96 | 0.83 | 13.19 |
| WC162 | 772 | 37.33 | 45.32 | 0.91 | −27.04 |
4.2. ET Estimation with Remotely Sensed Data
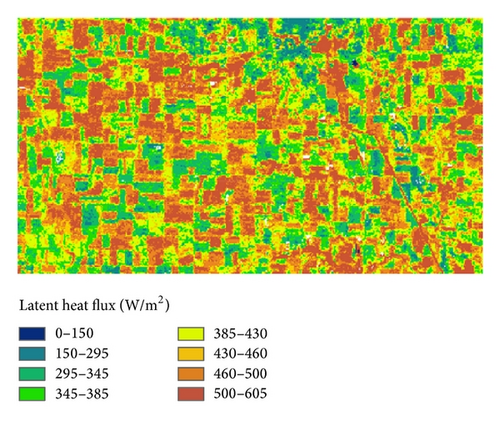
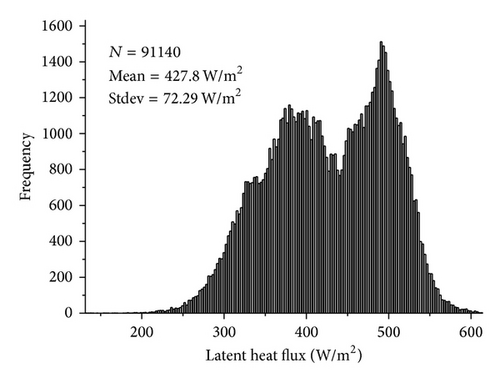
Land surface flux on July 1, 2002, was derived for the SMACEX02 regions with remote sensing data and meteorological observations. The latent heat flux estimated from the Landsat based (60 m) variables is shown in Figure 6. The spatial patterns produced by the contrast between soybean and corn fields can be clearly seen in the Landsat based evapotranspiration maps. The difference between soybean and corn is about 80–120 W/m2. A histogram was used to perform a further analysis of the retrieved result. Figure 7 presents the frequency of evapotranspiration across the study area with the Landsat based variables. The result indicates that bimodal histograms are found in the retrieval, which is in accordance with the soybean and corn fields. This may be associated with the LAI (leaf area index) values at different fields. The corn fields may have larger LAI values than the soybean fields, indicating larger transpiration rate in corn fields than the soybean fields. For the soybean and corn fields, two peaks of about 380 W/m2 and 510 W/m2 were found in the Figure 7. The mean latent heat flux and the standard deviation are 427.8 W/m2 and 72.29 W/m2, respectively, for the Landsat based estimates.
All the available tower observations were used to assess the estimated results. A comparison between the observed latent heat flux and the estimates derived from the Landsat based variables is listed in Table 3. For most sites, except WC03 and WC161, the comparison indicates that the derived results are acceptable at Landsat based scales and the difference is lower than 70 W/m2. However, a large deviation was found at WC03 and WC161. The discrepancies are 113.4 W/m2 and 157.6 W/m2. The WC03 is located at the junction of the different fields. The mixed pixel in the remote sensing data and the representation of the WC03 observations may be the explanation for the big disparity in the comparison. For WC161, Su et al. [72] also found a big difference in WC161 in their analysis. This can be attributed to the fact that the WC161 site is very close to the road and the corn field. Therefore, the observed results at WC161 represented the mixed underline covers, as the fetch of the eddy covariance system is about 100 meters [81]. Considering the representation of the observations and the mixed pixels in remote sensing imagery, the comparison indicates that the model is capable of computing reliable land surface heat flux over the study area.
| Site name | Tower Observations (W/m2) |
Landsat-bsed Estimates (W/m2) |
Difference* |
|---|---|---|---|
| WC03 | 354 | 467.4 | 113.4 |
| WC06 | 506 | 540.9 | 34.9 |
| WC13 | 304.1 | ||
| WC14 | 414.8 | ||
| WC151 | 488 | 524.1 | 36.1 |
| WC152 | 475 | 516.7 | 41.7 |
| WC161 | 299 | 456.6 | 157.6 |
| WC162 | 445.9 | ||
| WC23 | 392 | 329.3 | −62.7 |
| WC24 | 533 | 467.5 | −65.5 |
| WC25 | 392.1 | ||
| WC33 | 472 | 413.8 | −58.2 |
- *Difference referred as estimated value minus observed values.
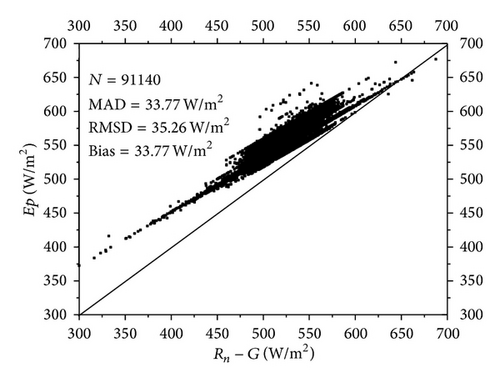
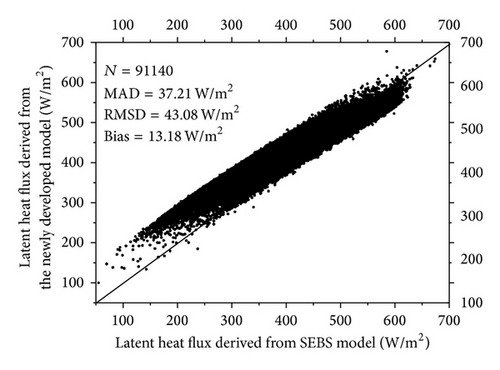
In order to demonstrate the improvements of this model, the SEBS model was compared with the newly developed model. Figure 8 shows the comparison between estimates from SEBS model and the newly developed model. The modeled results from the newly developed model are larger than the estimates from the SEBS model. There are 91140 samples in the comparison; the MAD and RMSD are 37.21 W/m2 and 43.08 W/m2. The bias (SEBS model is the reference model) is 13.18 W/m2. The disparity between these models may be attributed to three main reasons. Firstly, the forcing energy for ET is quite different in these two models. In the SEBS model, which is based on the surface energy balance, the net radiation minus soil heat flux (Rn − G) is assumed as the potential energy for ET. The advection effect is not considered in the SEBS model. However, in the newly developed model, advection is accounted for in the model development and the potential ET is determined as the potential energy for ET. Secondly, the parameterization of aerodynamic resistance is different in our model development. In the newly developed model, the empirical function for Zoh is applied in this study, while in SEBS model, a different parameterization for Zoh is developed. This may be another reason for the disparity of the comparison. Thirdly, the advection effect is not significant in the study area. Figure 8(a) presents the comparison between potential ET and Rn − G. Over the 91140 samples used in the comparison, the MAD and RMSD are 33.77 W/m2 and 35.77 W/m2, respectively. Potential ET is shown to be larger than Rn − G. The bias is 33.77 W/m2.Therefore, the estimates from the two models are comparable. Although the difference does not seem to be large in this comparison, the approaches used to derive the ET estimation are quite different.
4.3. Daily ET Estimation
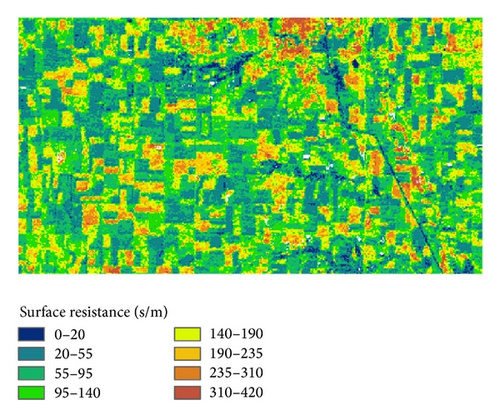
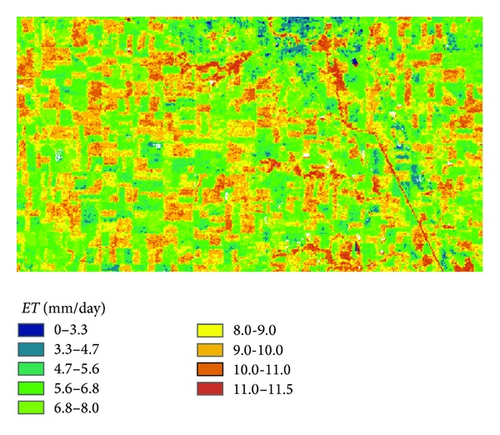
The evaporative fraction method is often applied to daily ET estimation. However, quite different conclusions were drawn by different researchers [44, 47]. Developing an accurate extrapolate method from instantaneous estimates is imperative in regional ET estimation based on remotely sensed data. Equation (11) clearly demonstrates the relationship between surface resistance and CWSI. Therefore, surface resistance can be derived from CWSI. In this study, the surface resistance is assumed to be constant on a daily basis and daily ET can be retrieved based on the Penman-Monteith equation. Figure 9 shows the spatial distribution of surface resistance estimated from Landsat based variables. The surface resistance ranges from 0 to 420 s/m. The urban area shows the maximum value of surface resistance (310–420 s/m), while the area along the river shows the lowest surface resistance (0–20 s/m). The surface resistance of soybean fields is shown to be higher than that of the corn fields and the difference is about 50–80 s/m. As soon as the surface resistance is available, it becomes operational to estimate daily ET based on the Penman-Monteith equation. Figure 9 presents the spatial distribution of daily ET over the study area. The spatial pattern of daily ET is quite opposite to the surface resistance. The urban area shows the smallest values of daily ET (0–3.3 mm), while the area along the river shows a maximum of daily ET values (10.0–11.5 mm). Daily ET for the soybean fields is about 5.0–8.0 mm, while daily ET for the corn fields is about 8–10.5 mm.
To evaluate the performance of this new extrapolate method, daily ET (mm) derived from sites observations was used. Table 4 lists the tower observations, adjusted tower observations, estimates from the model, and discrepancy (the difference between estimates and adjusted observations) for every site of the study area. The estimates are comparable with the adjusted tower observations at sites WC06, WC24, WC25, WC33, and WC23, while large differences were also found at WC151, WC152, WC03, and WC161. For site WC03, the land cover was classified as soybean in the field notes, but it was located in a corn field based on the provided coordinates [73]. Therefore, the large differences may be attributed to the parameterization of the vegetation height. For WC03 and WC161, the difference can be as large as 3.4 mm and 4.0 mm. Large differences are found in the instantaneous comparison in Section 4.2 (Table 2). The mixed pixels in remote sensing imagery may contribute to large disparity. In addition, the observations from the eddy covariance system are seldom validated. Many problems related to EC have not been fully solved. Firstly, many field observations of surface heat and vapor fluxes often fail to reach closure of the surface energy budget [55, 82, 83]. Secondly, the correction methods proposed by Twine et al. [74] are used frequently, but little is known about the accuracy of these correction methods. Advection is not accounted for in the forcing energy balance closure method and many field measurements indicate that ET can often exceed net incoming radiation due to advection from the surrounding landscape [42, 43]. Considering the above reasons, the comparison of the estimates and the observations from the towers listed in Table 3 may only provide a reference for the model’s performance.
| Tower name | Tower observations (mm) | Estimates (mm) | Difference* |
|---|---|---|---|
| WC06 | 7.1 | 8.3 | 1.2 |
| WC24 | 7.1 | 7.8 | 0.7 |
| WC25 | 4.9 | 6.3 | 1.3 |
| WC33 | 6.6 | 6.4 | −0.2 |
| WC151 | 7.0 | 9.3 | 2.2 |
| WC152 | 6.2 | 9.6 | 3.4 |
| WC03 | 5.9 | 9.2 | 3.3 |
| WC13 | — | 5.3 | — |
| WC23 | 5.9 | 6.1 | 0.2 |
| WC14 | — | 7.5 | — |
| WC161 | 4.6 | 8.6 | 4.0 |
| WC162 | — | 8.2 | — |
- *Difference refers to estimated value minus observed values.
5. Discussion
The impact of advection on local energy balance and ET has long been reported by different researchers. In some extreme conditions, ET can even be greater than the net incoming radiation [37, 42, 43]. However, many remote sensing models still define (Rn − G) as the only available energy used for ET and this may cause errors under advective environments. In this study, a new model accounting for advection was proposed to estimate ET. This newly developed model is based on the CWSI concept and takes the advection effect into consideration. For the local scale evaluation, it is found that the model can effectively characterize the daily variations of evapotranspiration and the modeled results show good agreement with the site observations. For the regional scale, this model can characterize the spatial variations of land surface heat flux at the Landsat based scales.
Vegetation height is a very important parameter in the model development. In this study, the land surface classification from Landsat is applied to derive the vegetation height. This simplified method may cause some errors in the ET retrievals. This may be one of the reasons for the large disparity at WC03 and WC161 in Tables 3 and 4. The soil heat flux is an important component in the energy balance equation. However, the importance of the soil heat flux is not sufficiently considered. The parameterization proposed by Choudhury et al. [79] was applied in this study. This may be another reason for the large disparity at WC03 and WC06. Further research is needed for the parameterization of vegetation height and the soil heat flux.
Many problems are related to the precise observation of the actual evapotranspiration at the site scale. Eddy covariance approach provides a direct way for observing the actual evapotranspiration. However, there are two problems related to this approach. Firstly, it is well recognized that field measurements of surface heat fluxes often fail to reach closure of the surface energy budget [74, 83, 84]. The correction methods proposed by Twine [74] are used frequently, but little is known about the accuracy of these correction methods. Secondly, the location of the site and spatial representation of the observation are another problem related to this approach. The disparity of spatial scale in the eddy covariance approach and in the model estimates is a difficult problem associated with the validation results in Tables 3 and 4. Therefore, eddy covariance approach needs more analysis before it can be used for validation of regional scale estimates. Although it has its limitations, observations from eddy covariance provide a good reference for the regional estimates based on remote sensing.
A reliable temporal extrapolation method is imperative for regional ET estimation based on remotely sensed data. The evaporative fraction and Kc method are a complicated combination of weather conditions, soil moisture, and biophysical conditions, as suggested by Crago [46]. In this study, the surface resistance was derived from CWSI, and then daily ET is estimated based on the Penman-Monteith equation.
The parameterization of aerodynamic resistance is very important in this newly developed model. In this study, the aerodynamic resistance was determined on the basis of the Monin-Obukhov surface layer similarity theory proposed by Brutsaert [63]. Liu et al. [62] evaluated eight parameterizations for aerodynamic resistance and pointed out that the roughness length for heat and vapor transfer is a crucial parameter. The empirical formula proposed by Kustas et al. [70] was used in this study. More research is needed to validate or observe aerodynamic resistance with high accuracy.
6. Conclusions
In this study, a new model was proposed to estimate ET. This model is based on the crop water stress index (CWSI) concept and clear relationship was found between CWSI and surface resistance. There are two attractive features of this model. Firstly, advection effects are accounted for in the model parameterization. Secondly, surface resistance can be derived from CWSI and can be used for extrapolating instantaneous estimates to daily values.
Both local scale evaluation with sites observations and regional scale evaluation with a remotely dataset from Landsat 7 ETM+ were carried out to assess the performance of this model. Local scale evaluation indicates that this newly developed model can effectively characterize the daily variations of evapotranspiration and the predicted results show good agreement with the site observations. Regional scale evaluation shows that the model can capture the spatial variations of the evapotranspiration at the Landsat based scale. Clear spatial patterns were observed at the Landsat based scale and are closely related to the dominant land covers, corn, and soybean. In addition, the surface resistance derived from instantaneous CWSI was applied to the Penman-Monteith equation to estimate daily ET. The evaluation indicates that the model is capable of estimating reliable surface heat fluxes. Several issues are unresolved, such as the energy balance closure problem related to observations from the eddy covariance system and the spatial heterogeneity in the mixed pixels. More research is needed to parameterize the aerodynamic resistance and to observe ET with a higher accuracy in order to minimize the uncertainties in the ET modeling and evaluation.
Acknowledgments
This work is supported jointly by the Project of National Natural Science Foundation of China (41171286), the National Basic Research Program of China (2010CB950904), and the International S&T Cooperation Program of China (2013DFG21010). Thanks is given to the organizers and participants in SMEX02 and the National Snow and Ice Data Center (http://nsidc.org/) for providing the datasets used in this study.


