Average Fracture Energy for Crack Propagation in Postfire Concrete
Abstract
Wedge-splitting tests of postfire concrete specimens were carried out in the present research to obtain the load-displacement curves. Ten temperatures varying from room temperature to 600°C were employed. In order to calculate the accurate fracture energy, the tails of load-displacement curves were best fitted using exponential and power functions. Three fracture energy quantities (fracture energy GF, stable fracture energy GFS, and unstable fracture energy GFU) with their variation tendency and their mutual relationship were determined to predict energy consumption for the complete fracture propagation. Additionally, the stable fracture work WFS was also calculated. All these fracture parameters sustain an increase-decrease tendency which means that the fracture property of postfire concrete shares the same tendency.
1. Introduction
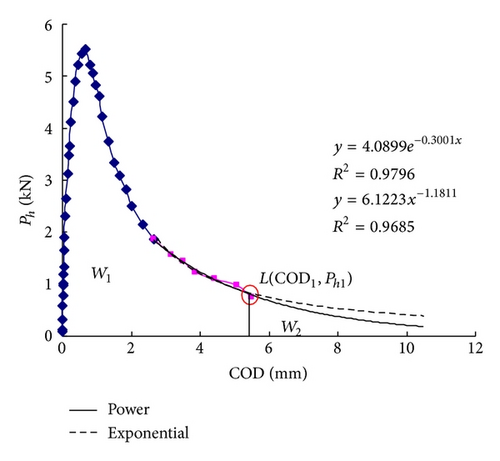
Since the application of fracture mechanics to concrete, the energy consumption for crack propagation in concrete has been a popular topic. For concrete, the specific fracture energy GF has been proven to be a useful parameter in the structure design and fracture behavior modeling. The specific fracture energy of concrete was defined based on a tensile test as the energy absorbed per unit crack area in widening the crack from zero to or beyond the critical value above which no stress can transmit [1]. Based on the work-of-fracture principle, three-point bending test [2], compact tension [3], and wedge-splitting method [4] were proposed as alternative methods to determine the specific fracture energy GF. It is computed as the area under the entire imposed load P and load-line displacement curve divided by the projected area of uncracked ligament, so the fracture energy GF represents the average or nominal energy consumption of concrete for an entire crack propagation process.
The existence of fracture process zone FPZ ahead of a crack is now well accepted. Since the 1970s, it has been known that the evolution of the FPZ undergoes two distinct periods—precritical stable crack growth and unstable fracture process [5]. There is no doubt that crack propagation is accompanied by energy dissipation, and the motive for crack propagation comes from either work provided by the imposed load or released strain energy. Fracture energy is one appropriate consideration to describe the amount of energy consumed during crack propagation process.
It is worth noting that the fracture energy can only represent the amount of average energy dissipation for entire crack propagation from crack initiation to complete failure without characterizing crack stable propagation and unstable fracture periods. So even with GF, it is still not clear how much energy is dissipated during those two crack extension periods. Xu et al. [6] proposed two new concepts the stable fracture energy GFS and unstable fracture energy GFU to describe fracture responses for different crack propagation periods. It is found that GFS kept constant for different ligament lengths, whereas GF and GFU showed the apparent size effect. But the accurate calculation of fracture surface remains unsolved. It is known that the true path of crack extension is tortuous, not straight as expected. The projected area underestimates the true fracture area. Hence, these parameters are actually nominal values.
The fracture energy of postfire concrete has been studied by several researchers [7–12]. It is found that the residual fracture energy sustained an increase-decrease tendency with the turning point at approximately 450°C. The increase tendency is due to the energy dissipation of microcracks distributing in the concrete, whereas the thermal damage induced by high temperatures reduces the residual fracture energy. However, in these researches, the influence of loading-displacement tail was unknown or not considered.
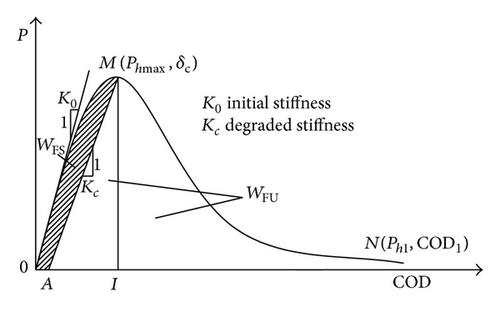
In present paper, wedge-splitting experiments of under ten temperatures levels varying from 20°C to 600°C and the specimens size of 230 mm × 200 mm × 200 mm with initial-notch depth ratios 0.4 are implemented [12]. Based on the work-of-fracture idea, the residual fracture energy GF is calculated considering the influence of load-displacement tail. Furthermore, the fracture energy consumption for crack stable extension and unstable extension, that is, GFS, GFU, is investigated. However, the true fracture surface remains undetermined and extremely difficult for specimens subjected to high temperatures, so these three fracture energy parameters are still nominal values. Hence, corresponding to GFS and GFU, the stable and unstable fracture work which neglect the fracture surface and their variation about temperatures are thus determined. From these parameters the fracture properties of postfire concrete could be described.
2. Fracture Energies for an Entire Crack Propagation Period
3. Experimental Program and Experimental Phenomena
In this test, concrete specimens were prepared using an ordinary silicate cement PO. 42.5 produced conforming to the Chinese standard. Coarse aggregate was calcareous crushed stone with a maximum size of 16 mm, and river sand was used as the fine aggregates and its maximum diameter was 5 mm. Details of the mix proportioning (by weight) used for concrete and some mechanical properties are Cement : Sand : Limestone Coarse aggregate : Water : fly ash = 1.00 : 3.44 : 4.39 : 0.80 : 0.26.
Fracture properties of concrete were determined by means of the wedge splitting test [4]. The test setup and geometry of the specimen are schematically represented in Figure 2. Compared to three-point bending notched beams, the wedge-splitting test has following advantages. For the three-point bending beams, inaccurate measurement of load-point displacement and the self-weight of the specimen could influence the real value of the fracture energy. During the test, beams should be carefully handled due to their heavy weight. However, using the WS specimens, the recorded COD in a horizontal plane is not affected by the crushing of the specimen at the supports or some other factors. Besides, the WS specimens are simple and easily prepared in laboratories or on site.
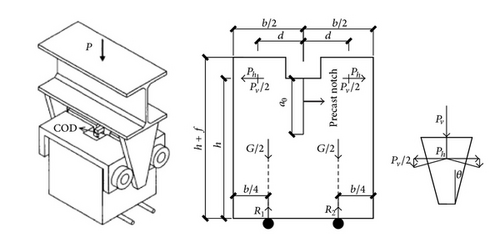
A total of 50 concrete specimens with the same dimensions 230 × 200 × 200 mm were prepared; the geometry of the specimens and the test setup are shown in Figure 2 (b = 200 mm, d = 65 mm, h = 200 mm, f = 30 mm, a0 = 80 mm, and θ = 15°). All the specimens had a precast notch of 80 mm height and 3 mm thickness, achieved by placing a piece of steel plate into the molds prior to casting. Each wedge splitting specimen was embedded with a thermal couple in the center of specimen for temperature control.
Nine heating temperatures, ranging from 65°C to 600°C (Tm = 65°C, 120°C, 200°C, 300°C, 350°C, 400°C, 450°C, 500°C, and 600°C), were adopted with the ambient temperature as a reference. Because it was recognized that the fracture behavior measurements were generally associated with significant scatter, five repetitions were performed for each temperature.
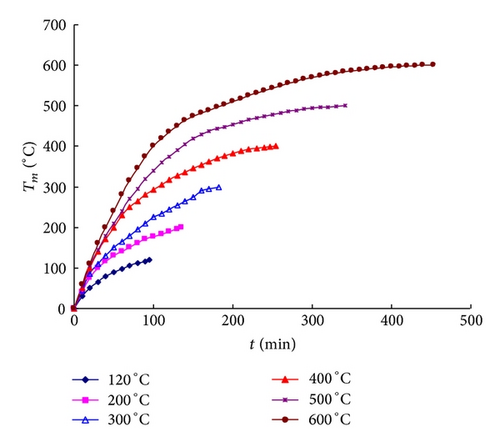
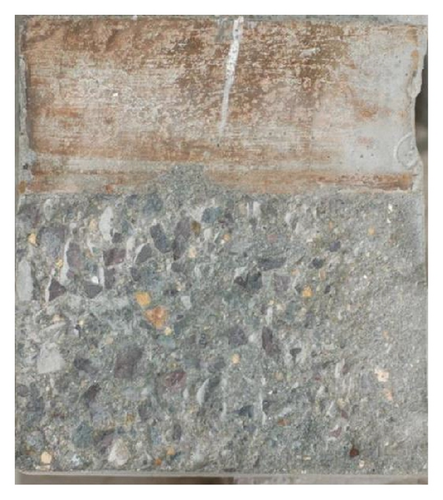
An electric furnace with net dimensions 300 × 300 × 900 mm was used for heating. When the designated Tm was reached, the furnace was shut down, and the specimens were naturally cooled for 7 days prior to the test. It averagely took 50, 95, 135, 182, 218, 254, 294, 342, and 453 minutes for the specimens to reach the final temperatures, respectively (from 65°C to 600°C). Figure 3 shows the typical temperature history for several cases with different maximum temperatures. After heating, microcracks disperse on the specimen surface, especially for temperatures higher than 200°C (see in Figure 4).
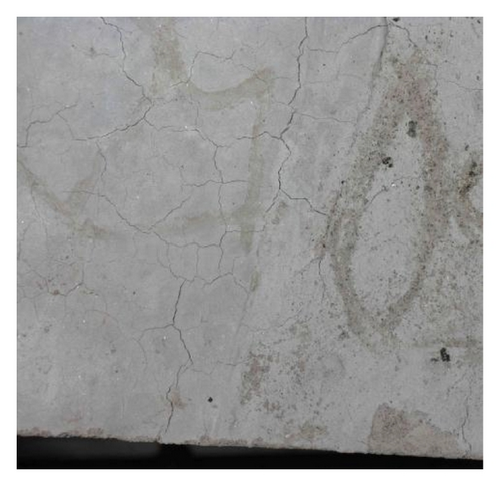
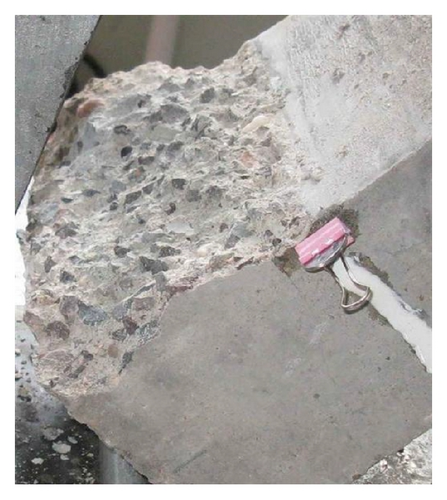
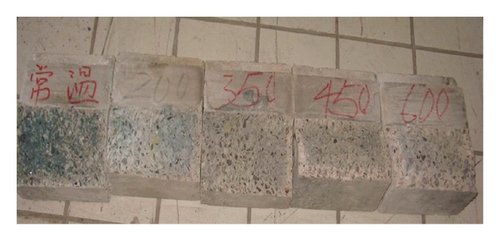
The fracture surfaces at different temperature intervals (20°C, 200°C, 350°C, 450°C, and 600°C) are shown in Figure 5, which became lighter but more tortuous with increasing temperatures.
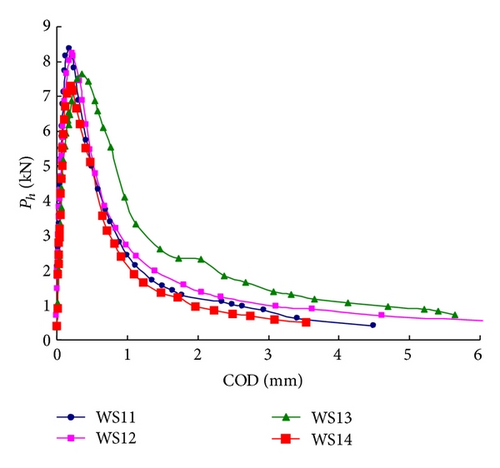
To obtain the complete P- COD curves (shown in Figure 6), the test rate was fixed at 0.4 mm/min, such that it took approximately 20 minutes to complete a single test of specimens subjected to less than 300°C and 30 minutes for beyond 300°C.

The fracture of specimen is essentially due to the bending moment caused by the horizontal splitting force Ph, vertical component 1/2Pv, and self-weight of the specimen. Two symmetrical supports are placed below the center of gravity of each half of the specimen. In doing so, the influence of the dead weight of the specimen and part of the vertical component force on the calculation of the fracture energies could be counteracted. Each roll axis is fixed at the same horizon as the lower plane of the groove and is very close to the center of gravity of each half of the specimen in the vertical position (shown in Figure 2). Due to the carefulness in the choice of the specimen geometry, the roll axis location, and the placement of the supports, the horizontal force Ph contributes most to fracturing the specimen. Therefore, Ph-COD curves were directly used in the calculation of the RILEM fracture energy GF, stable fracture energy GFS, and unstable fracture energy GFU.
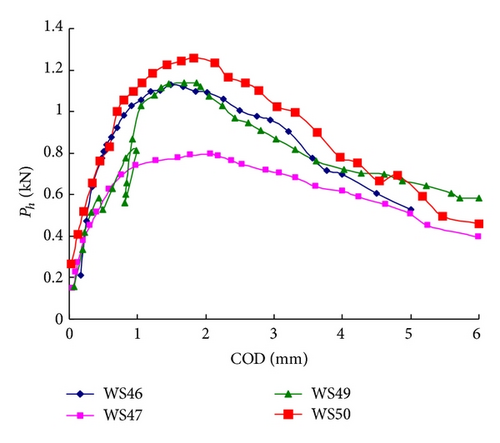
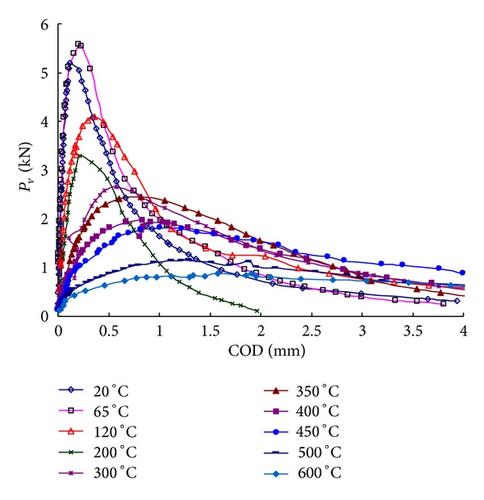
For our test results, the Ph-COD curves could be easily obtained from the monitored Pv-COD curves and (5). Figure 6 contains the plots of Ph-COD curves for several temperatures and typical Pv-COD curves for all temperatures.
From Figure 6(a) to 6(c), it is found that with the increasing of temperature (20°C–600°C), the divergence between the curves for the same temperature is more significant. In particular 600°C, the ultimate load Pu of specimen WS50 is one time higher than the one of specimen WS47. Additionally, the whole loading process is not stable for specimens WS49 (a sudden snap-back) due to the thermal damage induced by high temperature. Figure 6(d) shows the typical P-COD curves of all temperatures. The ultimate load Pu decreases significantly with increasing temperatures Tm, whereas the crack mouth opening displacement (COD) increases with Tm. The initial slope of ascending branches decreases with heating temperatures, and the curves become gradually shorter and more extended.
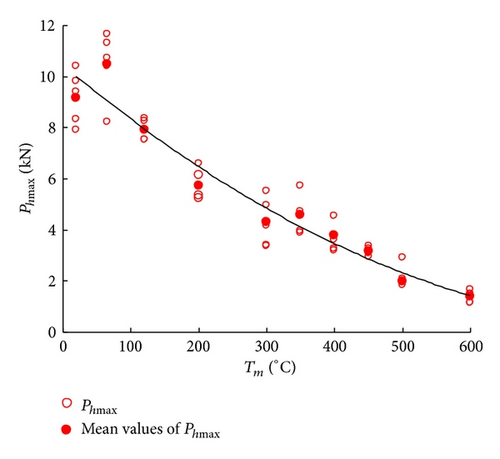
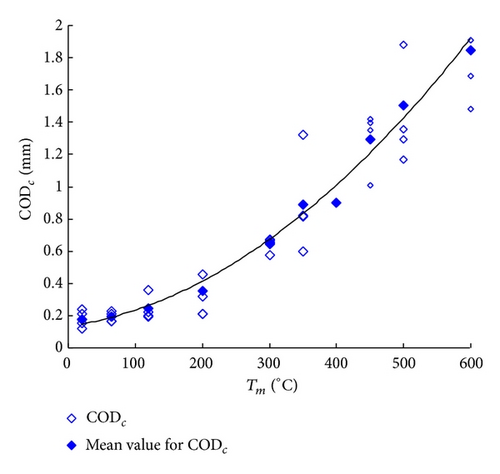
It is found that the ultimate load Phmax decreases with the increasing temperatures, whereas the CODc increases with Tm (Figure 8). The average value of Pu decreases from 9.17 kN at ambient temperature to 7.92 kN at 120°C, 4.29 kN at 300°C, 3.16 kN at 450°C, and finally 1.38 kN at 600°C, with a final drop of 85%. The value of CODc increases from 0.178 mm at ambient temperature to 0.352 mm at 200°C, 0.901 mm at 400°C, and 1.848 mm at 600°C, nearly 10 times as the ambient value.
4. Experimental Results and Analysis
4.1. Determination of Residual Fracture Energy GF
The parameters of β, λ for 20°C~120°C and m, n for 200°C~600°C, and the value of w1, w2 is listed in Table 1.
| Specimen | Temperature | Phmax (kN) | E (GPa) | ac (mm) | β/m | λ/n | R2 | W1 | W2 | CODc (mm) | COD1 (mm) | K0 (kN/mm) | Kc (kN/mm) |
|---|---|---|---|---|---|---|---|---|---|---|---|---|---|
| WS1 | 20°C | 8.304 | 15.30 | 0.107 | 1.484 | 2.273 | 0.970 | 5.231 | 0.389 | 0.174 | 1.926 | 87.081 | 79.219 |
| WS2 | 9.407 | 20.51 | 0.097 | 3.131 | 1.206 | 0.998 | 10.468 | 1.140 | 0.205 | 4.914 | 116.710 | 113.648 | |
| WS3 | 10.379 | 20.66 | 0.114 | 2.464 | 1.117 | 0.991 | 8.699 | 1.818 | 0.195 | 3.280 | 117.610 | 110.633 | |
| WS4 | 7.884 | 18.88 | 0.112 | 1.599 | 3.224 | 0.964 | 5.128 | 0.137 | 0.152 | 1.903 | 107.480 | 98.911 | |
| WS5 | 9.364 | 15.45 | 0.107 | 2.048 | 1.683 | 0.991 | 6.970 | 0.735 | 0.199 | 2.657 | 87.940 | 80.103 | |
| Average | 9.068 | 18.16 | 0.107 | — | — | 0.983 | 7.299 | 0.844 | 0.185 | 2.936 | 103.364 | 96.503 | |
| WS6 | 65°C | 11.282 | 21.73 | 0.113 | 2.781 | 1.506 | 0.996 | 9.238 | 0.984 | 0.195 | 3.205 | 123.690 | 116.172 |
| WS7 | 8.151 | 24.79 | 0.132 | 2.739 | 0.987 | 0.999 | 10.320 | 1.263 | 0.215 | 6.072 | 141.100 | 136.109 | |
| WS8 | 10.379 | 19.43 | 0.115 | 6.114 | 1.992 | 0.954 | 11.004 | 0.702 | 0.212 | 4.549 | 110.560 | 105.418 | |
| WS9 | 10.681 | 23.25 | 0.119 | 2.658 | 1.030 | 0.993 | 9.283 | 2.250 | 0.164 | 3.535 | 132.330 | 124.685 | |
| WS10 | 11.610 | 16.60 | 0.107 | 3.185 | 1.252 | 0.983 | 11.466 | 1.071 | 0.190 | 5.324 | 94.490 | 90.418 | |
| Average | 10.421 | 21.16 | 0.117 | — | — | 0.985 | 10.262 | 1.254 | 0.195 | 4.537 | 120.434 | 114.560 | |
| WS11 | 120°C | 8.353 | 10.65 | 0.095 | 2.477 | 1.085 | 0.990 | 8.423 | 1.094 | 0.191 | 3.418 | 60.638 | 57.254 |
| WS12 | 8.226 | 11.87 | 0.107 | 2.667 | 0.890 | 0.999 | 10.624 | 1.803 | 0.224 | 6.443 | 67.564 | 65.212 | |
| WS13 | 7.631 | 9.48 | 0.119 | 4.340 | 0.998 | 0.980 | 13.227 | 2.487 | 0.357 | 5.641 | 53.926 | 50.511 | |
| WS14 | 7.302 | 15.42 | 0.117 | 2.139 | 1.153 | 0.998 | 6.934 | 1.357 | 0.198 | 3.534 | 87.758 | 82.839 | |
| WS15 | — | — | — | — | — | — | — | — | — | — | — | — | |
| Average | 7.878 | 11.85 | 0.109 | — | — | 0.992 | 9.802 | 1.685 | 0.243 | 4.759 | 67.472 | 63.954 | |
| WS16 | 200°C | — | — | — | — | — | — | — | — | — | — | — | — |
| WS17 | 6.466 | 11.58 | 0.127 | 2.266 | 1.526 | 0.952 | 6.260 | 0.520 | 0.284 | 2.558 | 65.913 | 57.759 | |
| WS18 | 5.884 | 6.98 | 0.115 | 2.268 | 2.982 | 0.995 | 5.035 | 0.129 | 0.335 | 1.968 | 39.732 | 32.967 | |
| WS19 | 5.071 | 9.17 | 0.127 | 2.770 | 2.087 | 0.969 | 5.397 | 0.265 | 0.306 | 2.786 | 52.178 | 46.456 | |
| WS20 | 5.228 | 7.00 | 0.130 | 2.530 | 0.366 | 0.903 | 7.605 | 1.250 | 0.458 | 4.447 | 39.866 | 35.765 | |
| Average | 5.662 | 8.68 | 0.125 | — | — | 0.955 | 6.074 | 0.541 | 0.346 | 2.940 | 49.422 | 43.237 | |
| WS21 | 300°C | 3.341 | 2.45 | 0.121 | 4.023 | 0.361 | 0.981 | 10.019 | 0.491 | 0.792 | 3.101 | 13.939 | 11.004 |
| WS22 | 5.513 | 3.49 | 0.117 | 4.090 | 0.300 | 0.987 | 13.570 | 1.105 | 0.667 | 5.065 | 19.869 | 17.251 | |
| WS23 | 3.371 | 1.91 | 0.113 | 6.985 | 0.610 | 0.982 | 7.727 | 0.475 | 0.672 | 4.957 | 10.854 | 9.384 | |
| WS24 | 4.761 | 1.99 | 0.105 | 4.285 | 0.345 | 0.990 | 12.552 | 0.987 | 0.728 | 6.816 | 11.350 | 10.138 | |
| WS25 | 4.076 | 4.03 | 0.137 | 2.172 | 0.206 | 0.963 | 11.532 | 1.667 | 0.869 | 6.874 | 22.960 | 20.438 | |
| Average | 4.213 | 2.78 | 0.119 | — | — | 0.981 | 11.080 | 0.945 | 0.746 | 5.363 | 15.794 | 13.643 | |
| WS26 | 350°C | 5.701 | 6.05 | 0.131 | 5.702 | 0.447 | 0.995 | 12.290 | 1.475 | 0.599 | 4.549 | 34.409 | 29.878 |
| WS27 | 3.840 | 2.03 | 0.125 | 6.245 | 0.335 | 0.958 | 14.150 | 1.490 | 1.003 | 6.768 | 11.538 | 9.829 | |
| WS28 | 4.718 | 3.60 | 0.131 | 5.553 | 0.454 | 0.997 | 11.312 | 1.107 | 0.815 | 4.053 | 13.490 | 16.360 | |
| WS29 | 4.554 | 3.38 | 0.130 | 9.025 | 0.608 | 0.995 | 11.635 | 0.355 | 0.821 | 5.940 | 19.240 | 16.582 | |
| WS30 | 3.931 | 3.21 | 0.134 | 7.135 | 0.532 | 0.990 | 10.251 | 0.654 | 0.832 | 5.335 | 18.279 | 15.427 | |
| Average | 4.549 | 3.65 | 0.130 | — | — | 0.987 | 11.927 | 1.016 | 0.814 | 5.329 | 19.391 | 17.615 | |
| WS31 | 400°C | 3.584 | 2.56 | 0.136 | 3.934 | 0.307 | 0.999 | 11.737 | 1.033 | 0.921 | 6.937 | 14.557 | 12.391 |
| WS32 | 3.039 | 1.42 | 0.126 | 21.138 | 0.828 | 0.992 | 9.300 | 0.226 | 0.904 | 5.614 | 8.084 | 6.331 | |
| WS33 | 3.228 | 2.12 | 0.114 | 2.100 | 0.224 | 0.995 | 8.533 | 1.575 | 0.842 | 5.819 | 7.348 | 6.419 | |
| WS34 | 4.476 | 1.71 | 0.111 | 4.208 | 0.322 | 0.929 | 13.388 | 0.986 | 0.985 | 5.940 | 12.035 | 8.463 | |
| WS35 | — | — | — | — | — | — | — | — | — | — | — | — | |
| Average | 3.582 | 1.95 | 0.122 | — | — | 0.979 | 10.740 | 0.955 | 0.913 | 6.078 | 10.506 | 8.401 | |
| WS36 | 450°C | 3.336 | 1.41 | 0.125 | 5.280 | 0.299 | 0.977 | 13.124 | 1.553 | 1.224 | 5.625 | 8.037 | 6.289 |
| WS37 | — | — | — | — | — | — | — | — | — | — | — | — | |
| WS38 | 3.118 | 1.46 | 0.123 | 10.235 | 0.543 | 0.981 | 10.601 | 0.978 | 1.057 | 5.672 | 8.291 | 6.216 | |
| WS39 | 3.056 | 1.34 | 0.127 | 2.518 | 0.137 | 0.995 | 11.955 | 3.960 | 1.281 | 6.784 | 7.611 | 6.099 | |
| WS40 | 2.935 | 1.58 | 0.137 | 4.328 | 0.226 | 0.998 | 13.896 | 2.395 | 1.394 | 6.000 | 8.988 | 6.900 | |
| Average | 3.111 | 1.45 | 0.128 | — | — | 0.988 | 12.394 | 1.663 | 1.239 | 6.020 | 8.232 | 6.376 | |
| WS41 | 500°C | — | — | — | — | — | — | — | — | — | — | — | — |
| WS42 | 2.153 | 1.76 | 0.146 | 3.056 | 0.245 | 0.976 | 7.762 | 3.054 | 1.284 | 5.153 | 7.251 | 7.506 | |
| WS43 | 2.857 | 1.09 | 0.119 | 3.648 | 0.306 | 0.979 | 10.092 | 1.342 | 1.174 | 6.533 | 6.179 | 5.069 | |
| WS44 | 1.929 | 0.75 | 0.109 | 2.234 | 0.153 | 0.968 | 8.758 | 4.119 | 1.225 | 6.591 | 4.243 | 3.651 | |
| WS45 | 1.838 | 1.48 | 0.147 | 2.300 | 0.186 | 0.996 | 7.826 | 3.012 | 1.354 | 6.225 | 6.078 | 6.591 | |
| Average | 2.194 | 1.27 | 0.130 | — | — | 0.977 | 8.002 | 2.494 | 1.259 | 6.125 | 5.938 | 5.704 | |
| WS46 | 600°C | 1.129 | 0.47 | 0.130 | 2.102 | 0.278 | 0.931 | 4.197 | 1.280 | 1.482 | 7.000 | 2.656 | 2.094 |
| WS47 | 1.474 | 0.48 | 0.128 | 3.018 | 0.238 | 0.954 | 7.245 | 2.236 | 1.784 | 10.000 | 2.718 | 2.233 | |
| WS48 | 1.649 | 1.14 | 0.152 | 1.992 | 0.132 | 0.979 | 8.390 | 4.551 | 1.908 | 7.100 | 3.909 | 2.858 | |
| WS49 | 1.138 | 0.38 | 0.131 | 1.183 | 0.120 | 0.971 | 5.018 | 2.950 | 1.865 | 10.000 | 1.165 | 1.761 | |
| WS50 | 1.243 | 0.38 | 0.124 | 2.507 | 0.285 | 0.943 | 5.273 | 1.280 | 1.644 | 8.000 | 1.174 | 1.727 | |
| Average | 1.326 | 0.57 | 0.133 | — | — | 0.956 | 6.025 | 2.460 | 1.737 | 8.420 | 2.324 | 2.135 | |
Some necessary test results are tabulated in Table 1, including the maximum value of the horizontal load Phmax and its corresponding crack opening displacement CODc, the endpoint where Ph1 approaches zero and the crack opening displacement arrives at COD1, the initial slope of Ph-COD, that is, the initial stiffness K0, and the modulus of elasticity E.
Hence, the residual fracture energy described by (1) could be calculated. The values are listed in Table 2 and are shown in Figure 10.
| Specimen | Temperature | W0 (Nm) | Alig (m2) | GF (Nm−1) | WOIMA (Nm) | WAIMA (Nm) | WFS (Nm) | AFS (m2) | GFS (Nm−1) | WFU (Nm) | AFU (m2) | GFU (Nm−1) |
|---|---|---|---|---|---|---|---|---|---|---|---|---|
| WS1 | 20°C | 5.620 | 0.024 | 234.147 | 1.217 | 0.407 | 0.810 | 0.005 | 152.502 | 4.809 | 0.019 | 257.361 |
| WS2 | 11.608 | 483.664 | 1.575 | 0.388 | 1.187 | 0.003 | 350.795 | 10.421 | 0.021 | 504.972 | ||
| WS3 | 10.517 | 438.217 | 2.124 | 0.470 | 1.654 | 0.007 | 242.557 | 8.863 | 0.017 | 515.877 | ||
| WS4 | 5.265 | 219.394 | 0.994 | 0.314 | 0.680 | 0.006 | 107.537 | 4.586 | 0.018 | 259.384 | ||
| WS5 | 7.705 | 321.055 | 1.693 | 0.525 | 1.169 | 0.005 | 212.824 | 6.536 | 0.019 | 353.175 | ||
| Average | 8.143 | 339.295 | 1.521 | 0.421 | 1.100 | 0.005 | 213.243 | 7.043 | 0.019 | 378.154 | ||
| WS6 | 65°C | 7.666 | 0.024 | 425.907 | 1.791 | 0.535 | 1.255 | 0.007 | 281.835 | 6.411 | 0.017 | 480.239 |
| WS7 | 8.687 | 482.619 | 1.076 | 0.241 | 0.835 | 0.010 | 113.926 | 7.852 | 0.014 | 768.132 | ||
| WS8 | 8.779 | 487.745 | 1.475 | 0.509 | 0.966 | 0.007 | 208.612 | 7.813 | 0.017 | 602.385 | ||
| WS9 | 8.649 | 480.507 | 1.027 | 0.440 | 0.587 | 0.008 | 118.113 | 8.062 | 0.016 | 656.640 | ||
| WS10 | 9.402 | 522.360 | 1.419 | 0.733 | 0.686 | 0.005 | 210.596 | 8.716 | 0.019 | 614.693 | ||
| Average | 8.637 | 479.828 | 1.357 | 0.492 | 0.866 | 0.007 | 186.616 | 7.771 | 0.017 | 624.418 | ||
| WS11 | 120°C | 7.137 | 0.024 | 396.516 | 1.335 | 0.588 | 0.746 | 0.003 | 251.423 | 6.391 | 0.021 | 416.985 |
| WS12 | 9.321 | 517.822 | 1.475 | 0.511 | 0.964 | 0.005 | 178.684 | 8.357 | 0.019 | 616.201 | ||
| WS13 | 11.785 | 654.732 | 2.079 | 0.560 | 1.520 | 0.008 | 193.937 | 10.266 | 0.016 | 878.097 | ||
| WS14 | 6.218 | 345.463 | 1.044 | 0.312 | 0.732 | 0.007 | 98.944 | 5.486 | 0.017 | 455.357 | ||
| WS15 | — | — | — | — | — | — | — | — | — | — | ||
| Average | 8.615 | 478.633 | 1.483 | 0.493 | 0.991 | 0.006 | 180.747 | 7.625 | 0.018 | 591.660 | ||
| WS16 | 200°C | — | 0.024 | — | — | — | — | — | — | — | — | — |
| WS17 | 6.780 | 282.509 | 1.522 | 0.345 | 1.176 | 0.009 | 123.021 | 5.604 | 0.015 | 385.812 | ||
| WS18 | 5.163 | 215.135 | 1.556 | 0.525 | 1.031 | 0.007 | 146.955 | 4.132 | 0.017 | 243.300 | ||
| WS19 | 5.662 | 235.913 | 1.252 | 0.270 | 0.982 | 0.009 | 104.764 | 4.680 | 0.015 | 320.014 | ||
| WS20 | 8.854 | 368.937 | 1.828 | 0.365 | 1.463 | 0.010 | 145.364 | 7.391 | 0.014 | 530.467 | ||
| Average | 6.615 | 275.624 | 1.540 | 0.376 | 1.163 | 0.009 | 130.026 | 5.452 | 0.015 | 369.898 | ||
| WS21 | 300°C | 10.510 | 0.024 | 437.920 | 2.005 | 0.439 | 1.566 | 0.008 | 188.640 | 8.944 | 0.016 | 568.895 |
| WS22 | 14.675 | 611.467 | 3.546 | 0.820 | 2.726 | 0.007 | 364.621 | 11.949 | 0.017 | 723.160 | ||
| WS23 | 8.202 | 341.770 | 2.048 | 0.579 | 1.469 | 0.007 | 220.394 | 6.733 | 0.017 | 388.453 | ||
| WS24 | 13.539 | 564.120 | 3.065 | 1.081 | 1.984 | 0.005 | 404.514 | 11.555 | 0.019 | 605.107 | ||
| WS25 | 13.200 | 549.990 | 2.552 | 0.389 | 2.163 | 0.011 | 190.295 | 11.037 | 0.013 | 870.055 | ||
| Average | 12.025 | 501.053 | 2.643 | 0.662 | 1.982 | 0.008 | 273.693 | 10.044 | 0.016 | 631.134 | ||
| WS26 | 350°C | 13.765 | 0.024 | 573.540 | 2.689 | 0.511 | 2.179 | 0.010 | 211.652 | 11.586 | 0.014 | 845.346 |
| WS27 | 15.639 | 651.638 | 2.589 | 0.703 | 1.887 | 0.009 | 207.566 | 13.753 | 0.015 | 922.314 | ||
| WS28 | 12.420 | 517.489 | 3.827 | 0.919 | 2.908 | 0.010 | 317.145 | 9.512 | 0.014 | 664.527 | ||
| WS29 | 11.990 | 499.602 | 2.900 | 0.611 | 2.289 | 0.010 | 228.349 | 9.701 | 0.014 | 694.230 | ||
| WS30 | 10.905 | 454.375 | 2.796 | 0.475 | 2.320 | 0.011 | 216.312 | 8.585 | 0.013 | 646.739 | ||
| Average | 12.944 | 539.329 | 2.960 | 0.644 | 2.317 | 0.010 | 236.205 | 10.627 | 0.014 | 754.631 | ||
| WS31 | 400°C | 12.770 | 0.024 | 532.090 | 2.240 | 0.484 | 1.756 | 0.011 | 156.074 | 11.014 | 0.013 | 860.665 |
| WS32 | 9.526 | 396.932 | 2.678 | 0.656 | 2.022 | 0.009 | 207.133 | 7.504 | 0.015 | 516.314 | ||
| WS33 | 10.109 | 421.188 | 2.411 | 0.760 | 1.651 | 0.007 | 242.302 | 8.457 | 0.017 | 491.692 | ||
| WS34 | 14.374 | 598.926 | 3.638 | 0.918 | 2.720 | 0.006 | 401.879 | 11.654 | 0.018 | 668.062 | ||
| WS35 | — | — | — | — | — | — | — | — | — | — | ||
| Average | 11.695 | 487.284 | 2.742 | 0.705 | 2.037 | 0.008 | 251.847 | 9.658 | 0.016 | 634.184 | ||
| WS36 | 450°C | 14.677 | 0.024 | 611.530 | 3.255 | 0.779 | 2.477 | 0.009 | 277.088 | 12.200 | 0.015 | 809.983 |
| WS37 | — | — | — | — | — | — | — | — | — | — | ||
| WS38 | 11.579 | 482.451 | 3.284 | 0.669 | 2.615 | 0.009 | 303.750 | 8.964 | 0.015 | 582.382 | ||
| WS39 | 15.914 | 663.097 | 3.281 | 0.704 | 2.578 | 0.009 | 272.015 | 13.337 | 0.015 | 918.284 | ||
| WS40 | 16.291 | 678.790 | 3.847 | 0.532 | 3.315 | 0.011 | 292.743 | 12.976 | 0.013 | 1023.630 | ||
| Average | 14.057 | 608.967 | 3.417 | 0.671 | 2.746 | 0.010 | 286.399 | 11.869 | 0.014 | 833.570 | ||
| WS41 | 500°C | — | 0.024 | — | — | — | — | — | — | — | — | — |
| WS42 | 10.816 | 450.668 | 2.080 | 0.355 | 1.725 | 0.013 | 138.244 | 9.091 | 0.011 | 831.501 | ||
| WS43 | 11.434 | 476.413 | 2.890 | 0.743 | 2.146 | 0.008 | 272.496 | 9.288 | 0.016 | 576.031 | ||
| WS44 | 12.877 | 536.544 | 1.495 | 0.475 | 1.021 | 0.006 | 170.514 | 11.856 | 0.018 | 652.188 | ||
| WS45 | 10.838 | 451.571 | 2.720 | 0.308 | 2.412 | 0.013 | 186.562 | 8.426 | 0.011 | 785.892 | ||
| Average | 10.496 | 478.799 | 2.296 | 0.470 | 1.826 | 0.010 | 191.954 | 9.665 | 0.014 | 711.403 | ||
| WS46 | 600°C | 5.477 | 0.024 | 228.226 | 1.404 | 0.287 | 1.117 | 0.010 | 110.974 | 4.361 | 0.014 | 312.890 |
| WS47 | 9.481 | 395.057 | 2.526 | 0.460 | 2.066 | 0.010 | 213.423 | 7.415 | 0.014 | 517.849 | ||
| WS48 | 12.941 | 539.225 | 2.621 | 0.389 | 2.232 | 0.014 | 155.808 | 10.709 | 0.010 | 1107.140 | ||
| WS49 | 7.968 | 331.988 | 1.514 | 0.635 | 0.879 | 0.010 | 115.238 | 7.088 | 0.014 | 491.494 | ||
| WS50 | 6.554 | 273.074 | 1.749 | 0.773 | 0.976 | 0.009 | 151.878 | 5.578 | 0.015 | 342.831 | ||
| Average | 8.484 | 353.514 | 1.963 | 0.509 | 1.454 | 0.011 | 149.464 | 7.030 | 0.013 | 632.922 | ||
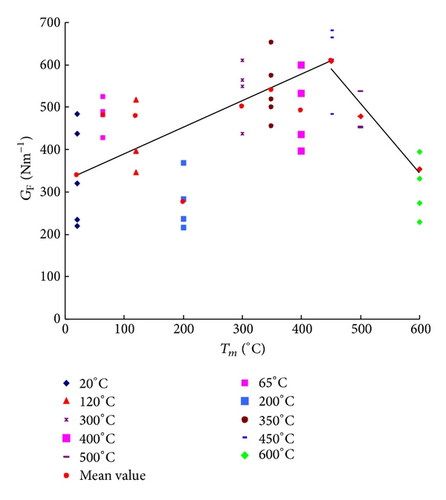
Though the residual fracture energy at each temperature has significant scatter, Figure 10 shows that the average values sustain an increase-decrease tendency with Tm. From 20°C to 450°C, average GF increases from 339.3 Nm−1 to 609 Nm−1, while the temperature reaches 600°C and the fracture energy falls back to 307.8 Nm−1. The detailed explanation would be seen elsewhere [12].
4.2. Determination of Stable Fracture Energy GFS and Unstable Fracture Energy GFU
As an extension of fracture energy GF, two other energy-based fracture characteristics, the stable fracture energy GFS and unstable fracture energy GFU, are proposed to describe fracture responses for different crack propagation periods. The analysis shows that fracture energy GF is actually the weighed average of GFS and GFU, and GFS and GFU could be regarded as two components of GF. This is very helpful in understanding the whole crack propagation process from the aspect of energy consumption.
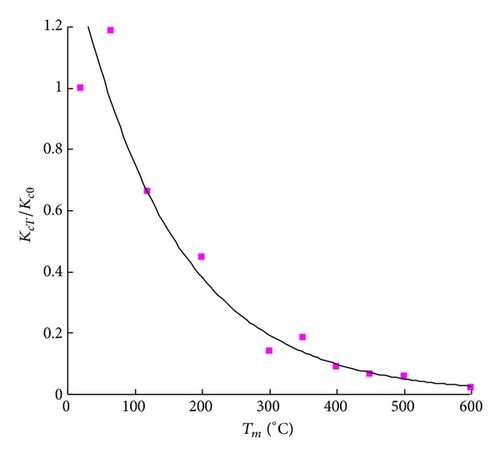
Figure 12 shows the variation of stable fracture energy GFS with temperatures. Similar to the residual fracture energy GF, it also keeps an increase-decrease tendency with temperatures. Temperatures less than 120°C appear not to induce much thermal damage to concrete, so the cracking resistance almost keeps constant. The values of stable fracture energy GFS at these temperatures are 213 Nm−1, 186 Nm−1, and 180 Nm−1, respectively. The fracture surfaces tend to be more tortuous between 200°C and 450°C than those observed at lower temperatures (see Figure 4) and there exist several cracks competing to form the final fracture, so more energy was dissipated in these specimens. Additionally, the opening of microcracks on the surface and inside the specimens also dissipates energy (see Figure 3). Finally, higher heating temperatures would cause more micro cracks, dehydration, and decomposition and would degrade the resistance. After 450°C, cracking resistance continuously decreases with Tm.
Table 2 shows that the unstable fracture GFU also sustains an increase-decrease tendency with Tm, and its value is much larger than stable fracture energy. Two reasons for larger values of GFU are provided [5]. First, energy consumption besides the main fracture zone takes places for the whole fracture process. During the unstable fracture process, the energy consumption for plasticity or other nonlinear deformation beyond the main FPZ would be much higher, especially for specimens subjected to high temperatures. The other possible reason lies in the calculation of true fracture area. It is known that the interface (transition zone) between cement and aggregate is the weak link in microstructure for normal concrete, and crack propagation would proceed in the path where the energy needs are least. So the true path of crack extension is tortuous and the higher the temperature is, the more tortuous the fracture surface is (see Figure 4), not straight as expected. The projected area is used in the calculation of fracturing surface AS or AU, which underestimates the true fracture area. Since the crack experiences much longer distance for the unstable extension, which leads to a greater underestimation of the calculation of the newly fractured area AU, the calculated GFU is overestimated.


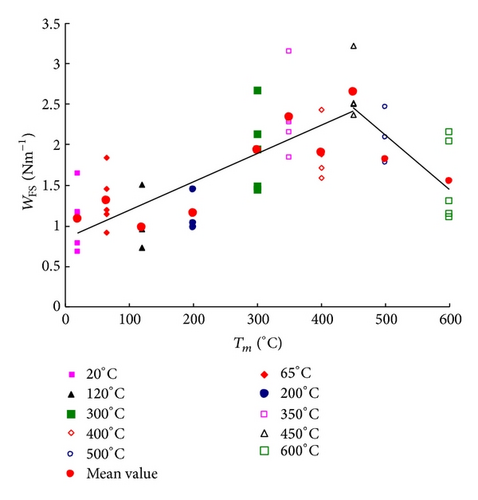
Furthermore, as mentioned above, the fracture surfaces of A, AS, AU are project areas, so GF, GFS, GFU are nominal fracture energies. To avoid the violence of fracture surface, the variation tendency of stable fracture work WFS is determined (see Figure 10). Similarly, WFS also keeps an increase-decrease tendency at the same turning temperature of 450°C.
5. Conclusions
- (1)
Wedge-splitting tests of ten temperatures levels varying from room temperature to 600°C and the specimen size of 230 mm × 200 mm × 200 mm with initial-notch depth ratios 0.4 have been presented. Complete P-COD curves and the curve tails are obtained using exponential and power functions. For specimens subject to no more than 120°C, the power function is more accurate; for higher temperatures, exponential function is more suitable.
- (2)
Three fracture energy quantities corresponding to different aspects of fracture are proposed. The fracture energy GF in a general case only represents the average energy dissipation for an entire crack propagation process. GFS, the stable fracture energy, denotes the average energy absorption during crack stable propagation, and GFU is used to characterize the average energy consumption for crack unstable propagation and a higher value of GFU than GFS is observed. GF is actually the weighed average of GFS and GFU.
- (3)
However, for engineering applications, the stable crack propagation is considered to be more important. From the wedge-splitting tests of different temperatures, it is concluded that GF, GFS sustain an increase-decrease tendency to 600°C, with a turning point at 450°C. Furthermore, the variation of stable fracture work WFS is determined and shares the same tendency with GF and GFS (Figure 13). All these three parameters mean that the fracture property of postfire concrete sustains an increase-decrease tendency.
Acknowledgments
The State Key Laboratory of Disaster Reduction in Civil Engineering (SLDRCE09-D-02) and Young Scientist Project of Natural Science Foundation of China (NSFC) have supported this research.


