Optical Waveguiding Organic Nanorods Coated with Reversibly Switchable Fe(II) Spin Transition Nanoparticles
Abstract
A dual functional nanohybrid object combining photonic and magnetic properties was successfully prepared through a “bottom-up” self-assembly approach. In this method, spin transition Fe(II) coordination nanoparticles and optical wave guiding organic nanorods were generated in situ and successfully integrated together in a single pot through self-assembly. The Fe(II) nanoparticles coated on organic nanorods (nanohybrids) display temperature dependent reversible spin transition (Paramagnetic; S = 2 ↔ diamagnetic; S = 0) behavior. The nano-hybrids show efficient optical wave guiding behavior, which demonstrates the future possibility to perform light induced excited spin state trapping (LIESST) experiments on a single spin transition nanoparticle level. These photonic and magnetic “nanohybrids” offer promising option to externally manipulate spin state of the spin transition nanoparticles using temperature as well as remote laser light.
1. Introduction
Bottom-up nanofabrication of self-assembled multifunctional nanoobjects and study of their uncharted physical properties at the nanoscale level are an active and sophisticated research area of nanoscience and technology [1–13]. Particularly programming the in situ growth of self-assembled organic and inorganic nanostructures from different molecular components and also their integration to form hybrid nanoscale objects in the same pot is a less explored area. A successful groundwork in this discipline might lead to new advanced functional hybrid nanomaterials capable of performing a sensing, electronic, photonic, and mechanical function [1–13]. For example integration of magnetically bistable inorganic nanoparticles (NPs) and optical wave guiding organic nanostructures could facilitate remote manipulation of the light sensitive spin states of individual NPs through guided laser light. Recently, we have reported for the first time on the passive wave guiding behavior of organic tubes and also demonstrated the remote electronic excitation of a mesotetratolylporphyrin nanosheet using a 20 μm long optical wave guiding organic tube [14–16]. Hence we intended to study the propensity of the 1D organic solids coated with spin transition NPs [17–37] (ST-NPs) to guide source laser light under laser confocal microscope setup. It was anticipated that the dielectric difference between the 1D nano-hybrid solid and the surrounding medium would guide the optical wave along the growth axis of the waveguide.
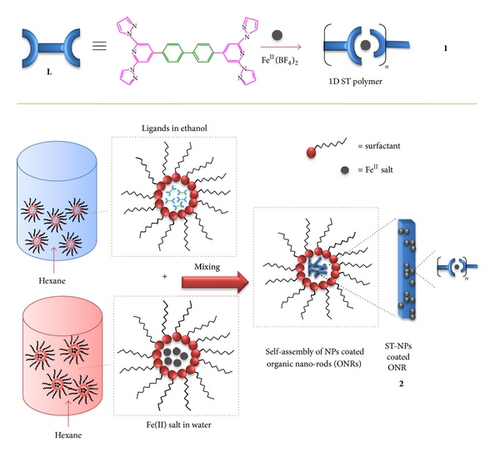
Among NPs, Fe(II) ST-NPs are of interest due to their switchable bistable magnetic spin states between paramagnetic high-spin state (S = 2; ) and diamagnetic low-spin state (S = 0; ) [17–37]. ST-NPs undergo reversible magnetic switching between low-spin (LS) and high-spin (HS) states due to the modulation of ligand field strengths depending on the temperature, light, and pressure. Till now there is no direct in situ method available on the integration of ST-NPs on other self-assembled organic nanoobjects. Recently our group reported an efficient solvent-assisted technique for the preparation of organic submicrotubes from a back-to-back coupled ditopic ligand, 4,4′-bis(2,6-di(1H-pyrazol-1-yl)pyridin-4-yl)biphenyl, L in dichloromethane [12]. We found that L also forms crystalline organic nanorods (ONRs) in hexane. Additionally, L is also a good candidate for the syntheses of 1D ST metallosupramolecular coordination polymers [38, 39] due to its readily available two tridentate metal chelating sites on either side of the molecule. The exposure and reactivity of the chelating molecules L available on the surface of the preorganized ONRs to reactants such as FeII ion and surfactant may also facilitate the surface selective growth of ST coordination NPs there by finally forming integrated functional ST nanohybrids.
To realize our idea, by following reverse micelle technique [40] we developed a singlestep method to fabricate ONRs from L, which are coated with ST-NPs (Scheme 1). Herein we report our nanohybrid preparation procedure: (i) self-assembly of L to form ONRs and (ii) self-assembly of ST-NPs from molecules L available on the surface of the ONRs in presence of FeII salt and surfactants. We also report the electron (SEM, FESEM, and TEM), atomic force microscopy (AFM), and Raman spectroscopy images of the nanoobjects and also the variable temperature magnetic properties of bulk 1D ST coordination polymer 1 and ST-NPs coated on ONRs 2. Finally we also present our preliminary results on the optical wave guiding tendency of the nano-hybrids.
2. Materials and Methods
2.1. Materials
The materials citrazinicacid, [Pd(PPh3)4], trifluoroacetic acid, sodium dioctyl sulphosuccinate (SDS), docosanic acid, Fe(BF4)2·6H2O, and pyrazole were purchased from Aldrich. Sodium azide, KI, K2CO3, NaNO2, sodium thiosulfate, and diethyl ether were purchased from Merck chemicals. Oxalyl chloride, POCl3, iodine, and NaHCO3 were purchased from Avra Synthesis, Hyderabad. The solvents were distilled and dried before reactions and for extracting purposes. IR spectra were recorded on JASCO FT/IR-5300. Elemental analysis was recorded on a Thermo Finnigan Flash EA 1112 analyzer. Size and morphology of the nanostructures were examined by using a Philips XL30 ESEM Scanning electron microscope (SEM) using a beam voltage of 20 kV and a Tecnai G2 FEI F12 transmission electron microscope (TEM) at an accelerating voltage of 120 kV. FESEM measurements were performed on a Hitachi S-4500 SE/N instrument operating at 20 kV. AFM imaging was carried out on NT-MDT Model Solver Pro M microscope using semicontact mode. Variable temperature magnetic susceptibility measurements of the solid samples (1 and 2) were recorded in the temperature range of 5 ↔ 375 K using a Quantum Design VSM-SQUID magnetometer with an applied DC magnetic field of 1000 G. Powder sample was packed in a nonmagnetic sample holder and mounted on a nonmagnetic straw.
2.2. Confocal Micro-Raman Spectroscopy/Waveguiding Studies
Raman spectra of the samples were recorded on a Wi-Tec alpha 300 confocal Raman spectrometer (back scattering geometry) equipped with a Peltier-cooled CCD detector. A 400 nm Ar+ laser was used for the experiments. Using a 600 grooves/mm grating BLZ = 500 nm, the integration time was typically 0.5000 s. Ten accumulations were performed for acquiring a single spectrum. All measurements were collected in air and room temperature. Optical waveguiding studies were also performed on this setup.
2.3. Experimental Methods
Preparation of coordination polymer is as following (1): 40 mg (0.069 mmol) of ligand 4,4′-bis(2,6-di(1H-pyrazol-1-yl)pyridin-4-yl)biphenyl L was dissolved in a deaerated dichloromethane (30 mL). To this a deaerated methanolic solution containing 35.5 mg (0.139 mmol) of Fe(BF4)2·6H2O was added and stirred for 2 days under N2 atmosphere. The solvents were evaporated from the turbid solution and the obtained yellow precipitate was collected and washed with dichloromethane and methanol and finally air-dried. Yield 53 mg; FTIR (KBr, ν/cm−1): 3524, 3435, 3128, 2924, 2854, 1631, 1572, 1523, 1460, 1406, 1253, 1219, 1053, 966, 819, 761. Elemental analysis (%) calculated for C34H24B2F8FeN10: C 50.91, H 3.02, N 17.46; found C 51.41, H 2.95, N 17.25.
Preparation of ST nanoparticles coated nanorod is as follows (2): Fe(BF4)2·6H2O (14.6 mg, 0.664 mmol) was dissolved in water (2 mL), and added to a mixture of sodium dioctyl sulphosuccinate (0.256 g) in 10 mL of hexane. After a few minutes of stirring, behenic acid (39.4 mg, 1.328) was added to this suspension. 4,4′-Bis(2,6-di(1H-pyrazol-1-yl)pyridin-4-yl)biphenyl (100 mg, 0.174 mmol) was suspended to ethanol (10 mL), added to the above mixture, and vigorously stirred for 36 h. Afterwards, the mixture was evaporated to get a sticky solid, which is contaminated by surfactants, which was removed by centrifuging with ethanol for several times. The powder obtained was finally dried under vacuum to afford a yellow powder of 2 (50 mg). FTIR (KBr, ν/cm−1): 3148, 2918, 2849, 1707, 1612, 1572, 1539, 1510, 1462, 1394, 1261, 1207, 1035, 952, 935, 914, 871, 823, 787, 767, 628, 605, 486.
3. Result and Discussion
In the bulk state, treatment of L with FeII (BF4)2 (1 : 1 stoichiometry) in acetonitrile immediately formed an insoluble yellow precipitate, which indicated the formation of a 1D linear coordination polymer [FeII(L2)(BF4)2]n 1. We have employed an in situ reverse micelle technique to grow self-assembled nano-hybrids, that is, ONRs coated with ST-NPs. Firstly, dispersion of an ethanol solution of L in hexane followed by treatment with sodium dioctyl sulfosuccinate surfactant formed micelle containing L stabilized by the surfactant. Secondly, dispersal of an aqueous solution of FeII salt in hexane followed by the treatment of surfactant produced a FeII carrying micelle stabilized by the surfactants. Mixing followed by stirring of the two solutions containing micelle carrying L and FeII salt formed a yellow precipitate of ST-NPs coated ONRs 2. Filtration of the resultant precipitate followed by drying gave a light yellow powder of 2.
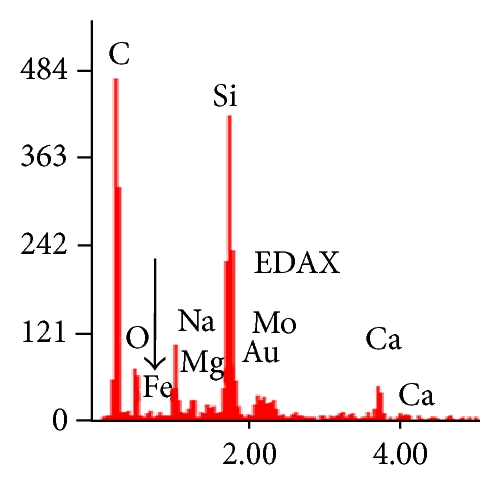
The electron microscopy (SEM, FESEM, and TEM) images of 2 clearly exhibited the formation of ST-NPs on ONRs. The SEM images of 2 showed the ONRs of different lengths varying from 5–30 μm lengths and widths in the range of ca. 1–4 μm (Figure 1(a)). FESEM measurements clearly showed the growth of spherical NPs on the surface of the ONRs (Figures 1(b)–1(d)). Furthermore the energy dispersive X-ray analysis (EDAX) measurement performed on NPs coated on ONRs clearly indicated the presence of iron ions in the spherical NPs (Figure 1(e)).

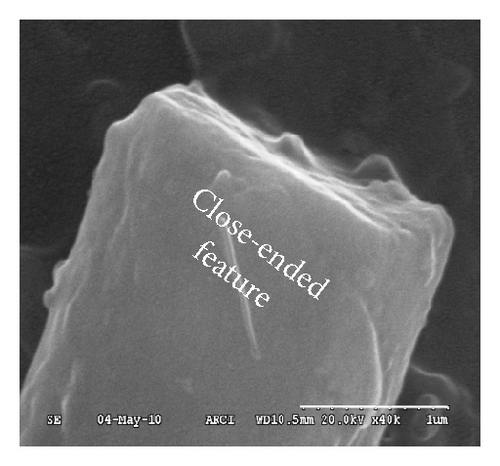
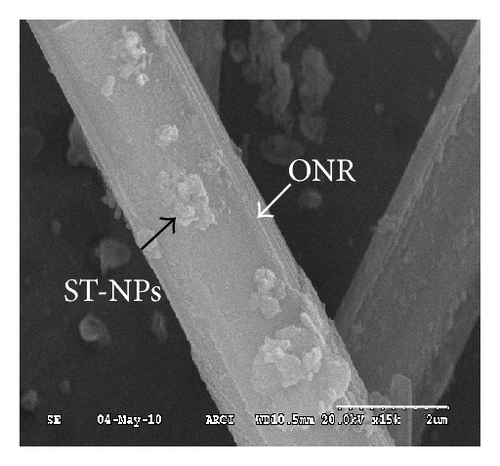
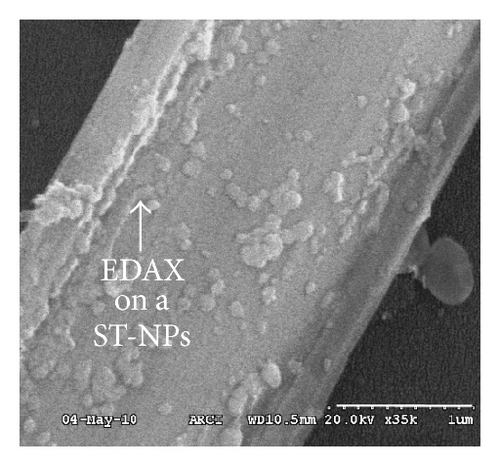
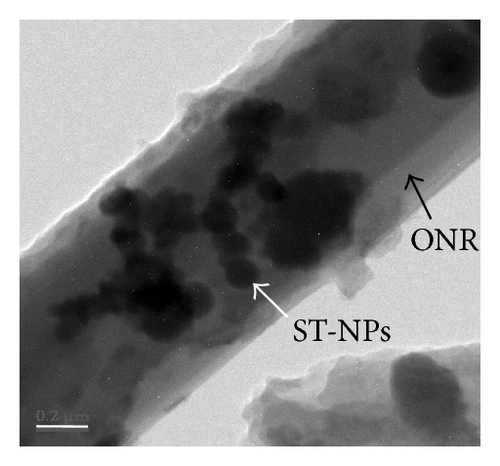
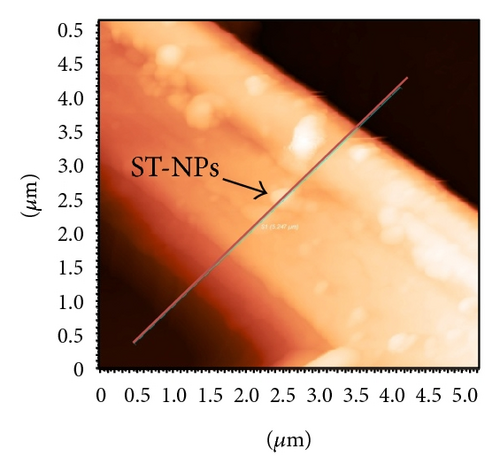
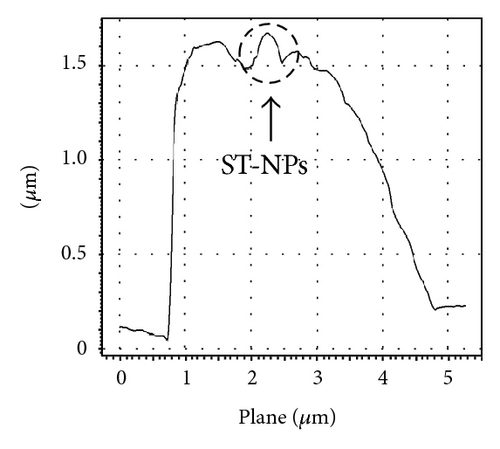
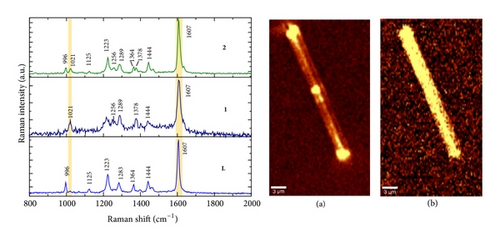
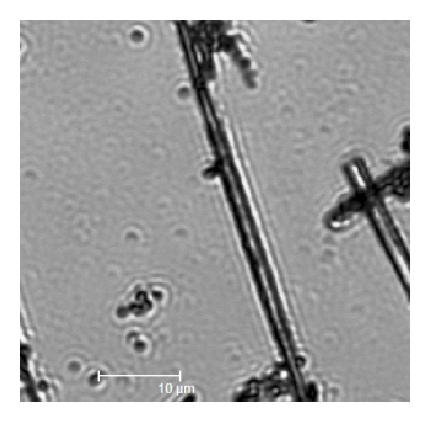
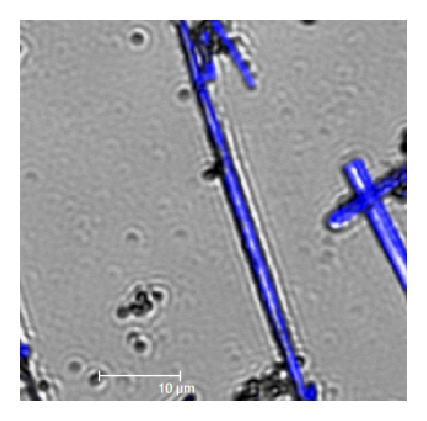
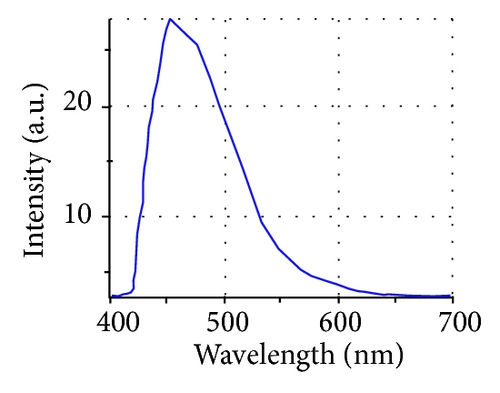
Additionally AFM measurements confirmed the coassembly of ST-NPs on ONRs (Figures 1(g) and 1(h)). A typical width × height range profile of selected ONRs is ca. 1–4 × 0.4–1.5 μm. Direct visualization of ST-NPs (black contrast) on the surface of the ONRs (grey contrast) was achieved by TEM measurements (Figure 1(f)). The NPs are spherical in shape and the sizes were in the range of ca. 70–200 nm. The spherical particles were aggregated together on the surface of the ONRs. Furthermore confocal Raman micro spectroscopic data (with 488 nm Ar+ laser; back scattering mode) confirmed the presence of ST-NPs on the surface of the ONR by exhibiting characteristic Raman shifts corresponding to L and 1 (Figure 2). Raman imaging of a selected ONR using the NPs marker modes 992 cm−1 to 1031 cm−1 showed that the particles are mostly concentrated at the centre and at the rod ends. The confocal fluorescence microscopy studies of the nanorods coated with ST-NPs 2 displayed a blue emission at 443 nm demonstrating the fluorescence property of the nano-rods and also possibility to utilize these rods as active waveguides (Figure 3).

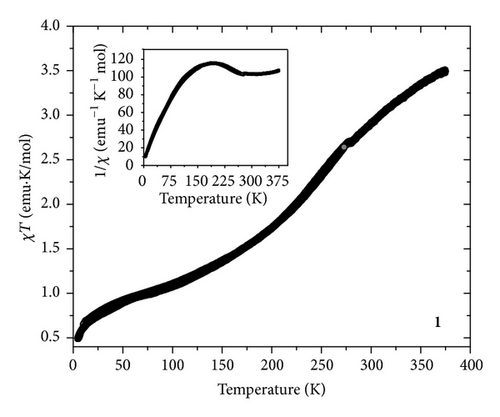
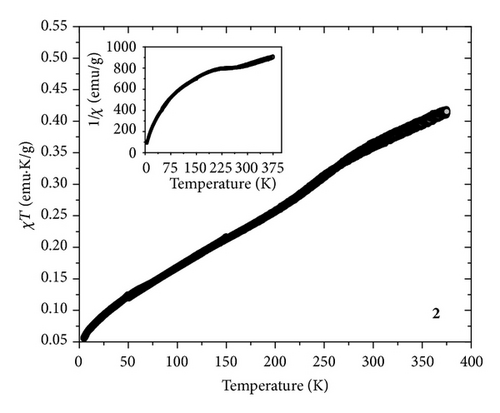
The temperature dependent magnetic measurements data of 1 and 2 in the range of 375 ↔ 5 K at 1000 Oe DC magnetic field are shown in Figure 4. For 1 the product of magnetic susceptibility and temperature (χT) versus T curve indicated the presence of a reversible ST behavior. The value of χT at 375 K is ca. 3.5 emu·K/mol, which indicated the HS state of 1. Upon cooling down to 293 K the χT value further decreased to 2.85 emu·K/mol. This demonstrated the presence of HS and LS fractions at room temperature. Further cooling showed a steep decrease of the χT value which reached a minimum value of ca. 0.5 emu·K/mol at 5 K. This specified the completion of the ST event. The χT curve showed a similar trend even in the heating mode performed up to 375 K. The ST temperature of 1 is ca. 201 K. Since the process of ST is very sensitive to environmental changes, to explore the ST tendency of the NPs coated on ONRs, the variable temperature magnetic properties of sample 2 were also investigated. Interestingly the reversible ST property was retained for 2 but with a change in the ST temperature (ca. 160 K) and its propensity compared to 1. The shifting of the ST to lower temperature side is perhaps due to the decrease of the long-range cooperatives in the NP state. Additionally, the origin of smooth ST compared to 1 is probably due to the presence of ST-NPs of various particle size ranges [25].
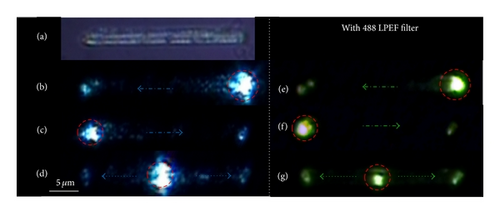
For the passive optical wave guiding studies, a visible light laser (488 nm; Ar+) was employed to circumvent the electronic absorption of a laser light by the molecular building blocks of the rods (Figure 5(a)). The laser beam was coupled to the ONR kept on a thin glass substrate through a 50x objective (NA = 0.90). Orthogonal illumination of a laser beam at any one of the ends of a rod (optical coupling point) showed propagation of guided laser light to the opposite end of the rod (Bright field images; Figures 5(b) and 5(c)) while irradiation of laser at the center of the rod showed guided light propagation to both ends of the rod (Figure 5(d)). The corresponding dark field images taken with a 488 long pass edge filter (LPEF) are shown in Figures 5(e)–5(g). Fe(II) ST-NPs are known to display light induced electron spin state trapping (LIESST) effect [41] that is, metastable high-spin state (S = 2) upon illumination with laser light at cryogenic temperature. In all of the reported literature works these LIESST experiments were performed on a bulk ST samples [41–44]. Our preliminary experimental results demonstrate that the LIESST studies can be done on single ST-NP level using a waveguiding organic nanorods coated with ST-NPs.
4. Conclusions
The presented results clearly demonstrate a successful in situ preparation of organic and inorganic nanostructures such as ST-NPs and ONRs in a single pot to create “nanohybrids.” The optical wave guiding nature of the ONRs can be exploited to control the spin state of the ST-NPs using guided laser light. This is an attempt towards the “bottom-up” fabrication of externally switchable “nanohybrids.”


