Effects of Surface Modification of TiO2 Nanotube Arrays on the Performance of CdS Quantum-Dot-Sensitized Solar Cells
Abstract
CdS-sensitized TiO2 nanotube arrays have been fabricated using the method of successive ionic layer adsorption and reaction and used as a photoanode for quantum-dot-sensitized solar cells. Before being coated with CdS, the surface of TiO2 nanotube arrays was treated with TiCl4, nitric acid (HNO3), potassium hydroxide (KOH), and methyltrimethoxysilane (MTMS), respectively, for the purpose of reducing the interface transfer resistance of quantum-dot-sensitized solar cells. The surfaces of the modified samples represented the characteristics of superhydrophilic and hydrophobic which directly affect the power conversion efficiency of the solar cells. The results showed that surface modification resulted in the reduction of the surface tension, which played a significant role in the connectivity of CdS and TiO2 nanotube arrays. In addition, the solar cells based on CdS/TiO2 electrode treated by HNO3 achieved a maximum power conversion efficiency of 0.17%, which was 42% higher than the reference sample without any modification.
1. Introduction
Since the new architecture for the dye-sensitized solar cell (DSSC) was first reported by O’Regan and Grätzel in 1991, it has attracted considerable attention throughout the world from both academic and industrial fields as one of promising candidates for the development of next generation solar cells [1–5]. DSSCs use dyes to sensitize wide band gap semiconductors to convert visible light into electricity, while quantum-dot-sensitized solar cells (QDSSCs) generally use quantum dots (QDs) as sensitized materials instead of conventional organic dyes [6, 7]. Accordingly, semiconductor QDs as light absorbing materials have many fascinating advantages, such as their high extinction coefficients and large intrinsic dipole moment that originated from bulk properties [8, 9]. Besides, the tunable band gap by size controlling and multiple excition generation by impact ionization are derived from the nanoscale dimension as a consequence of the quantum confinement effect [10–12]. However, the quantum-dot-sensitized solar cells have shown comparatively much lower efficiencies than expected and have not been fully systematically explored and evaluated.
To date, one-dimensional TiO2 nanostructures, particularly TiO2 nanotube arrays (TNAs), have received great attention in terms of quantum-dot-sensitized solar cells. A large surface area facilitates the creation of a large number of junctions and an increase in the amount of sensitizer material that can be loaded on the TiO2 surface, thereby leading to favorable light harvesting and collection of photogenerated charge carriers [13]. Additionally, the tubular architecture and vertical orientation of TNAs facilitate the separation of the photoexcited charges and accelerate electron transport [14]. However, at present, the record solar conversion efficiencies of QDSSCs based on TNAs are lower than 5%. QDSSCs based on the CdSe/CdS-sensitized TNAs/Ti photoanode and Cu2S counterelectrode just had a performance of 3% which was lower than 7% achieved from colloid quantum dot solar cells [14, 15]. Kamat et al. linked CdSe QDs to TiO2 with bifunctional organic molecules and successfully increased the power conversion efficiency of solar cell due to the acceleration of the electron injection rate from CdSe to TiO2 [16, 17]. Thus, interface properties greatly influence the interfacial electron transfer process. Surface modification via different approaches, such as surface modification with molecular dipoles and coating quantum-dot-sensitized TNAs with ZnS nanometric barriers, has been demonstrated to be a powerful tool to boost the power conversion efficiencies of the devices [18–20].
In our previous work, we reported the effects of geometric and crystal structures on the photoelectrical properties of TNAs and the enhanced photoelectrochemical property of nitrogen-doped TNAs [21, 22]. In this paper, we investigated the effects of interfacial properties on the QDSSCs performances through surface modification of TiO2 nanotube arrays. After the modification, the nanotube surfaces showed a superhydrophilic or superhydrophobic behavior, which resulted from various surface tensions. Despite the vast reports on QDSSCs, there is little research on the influence of the characteristics of surface superhydrophilic and superhydrophobic as well as surface tensions. Therefore, we modified the surface of TNAs by TiCl4, nitric acid (HNO3), and potassium hydroxide (KOH), respectively, to change the surface tension of the TNAs. Subsequently, CdS quantum dots were deposited by the method of successive ionic layer adsorption and reaction (SILAR). After modification, 0.17% power conversion efficiency was achieved by treatment of HNO3, which was 42% higher than the reference solar cell.
2. Experimental
2.1. Preparation and Modification of TiO2 Nanotube Arrays
Ti foil (0.5 mm thickness, 99.4% purity) was first cut into 1.5 cm × 3 cm. The foils were ultrasonically cleaned in acetone, ethanol, and deionized water for 30 min, respectively, and dried in ambient air. The Ti foil was anodized in ethylene glycol solution containing 0.3 wt% NH4F and 2 wt% H2O by applying a 60 V DC potential for 4 h. The anodization was performed in a two-electrode configuration with the Ti foil as the working electrode and a stainless steel foil as the counterelectrode. After anodization, the TNAs on Ti foil were ultrasonically treated in ethanol for 5 min to remove the electrolyte and debris on top, followed by thermal treatment at 450°C for 3 h. Then the samples were soaked in TiCl4 (0.04 M), HNO3 (pH = 3), and KOH (pH = 12), respectively, for 30 min at 70°C. And the sample soaked in TiCl4 subsequently re-annealed at 450°C for 30 min.
2.2. Deposition of CdS QDs
The CdS-sensitized TiO2 photoanodes were achieved by SILAR of CdS QDs on TNAs. The as-prepared photoanodes were firstly immersed into a solution of 0.05 M Cd(NO3)2 in ethanol for 2 min, then rinsed with ethanol, and then immersed into 0.05 M Na2S in methanol/water (1 : 1/v : v) for another 2 min, followed by another rinsing with deionized water and methanol. Such an immersion cycle was repeated 8 times until the desired deposition of CdS QDs was achieved. The sensitized photoanodes were passivated with ZnS by alternately dipping into 0.5 M Zn(NO3)2 ethanol solution and 0.5 M Na2S methanol/water solution three times for 2 min for each time.
2.3. Fabrication of Counterelectrodes and Solar Cells Assembly
To assemble the solar cell, a Pt-coated counterelectrode was prepared by dropping 5 mM H2PtCl6 in isopropanol onto FTO glass and then annealed at 385°C for 30 min. The cells were assembled in a sandwiched structure with a thermal adhesive film (Surlyn, 60 μm, DuPont). A methanol/water (7 : 3 by volume) solution containing 0.5 M Na2S, 2 M S, and 0.2 M KCl was used as the redox electrolyte. The electrolyte was injected by vacuum backfilling, and then the hole was sealed with a Surlyn film. The effective area of the cell is 0.3 cm2.
2.4. Characterization
The morphology and microstructure of the photoanodes were characterized by scanning electron microscopy (FESEM, Hitachi S-4800) and transmission electron microscopy (TEM, JOEL JEM2100), and the crystal structure was studied by X-ray diffraction measurements (XRD, Bruker AXS, D8 Advance). The absorption spectrum was obtained by a UV-vis spectrophotometer (Persee, TU-1901). The current and voltage measurements were recorded by Keithley 2400 sourcemeter when the cells were irradiated by a solar simulator (Aulight, CEL-S500) under AM 1.5 illumination of 100 mW/cm2. All the electrochemical impedance spectroscopy (EIS) measurements of QDSSCs were carried out in dark and under the open circuit potentials. The superimposed signal has the frequency ranging from 0.1 Hz to 100 KHz with AC amplitude of 10 mV (Zahner, Zennium).
3. Results and Discussion
3.1. Contact Angle Analysis
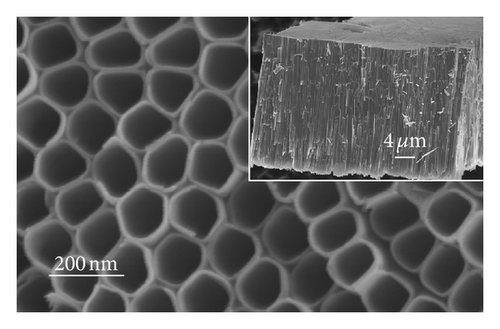
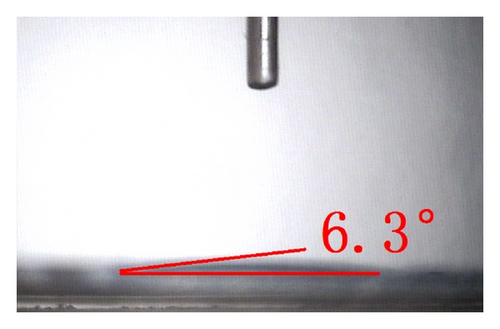
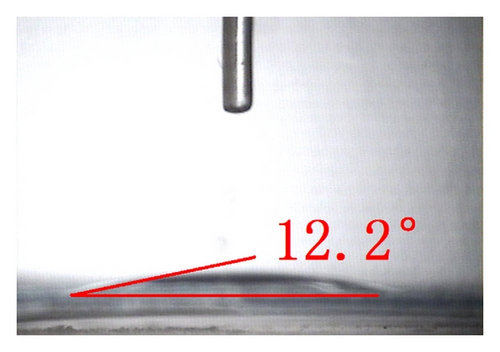
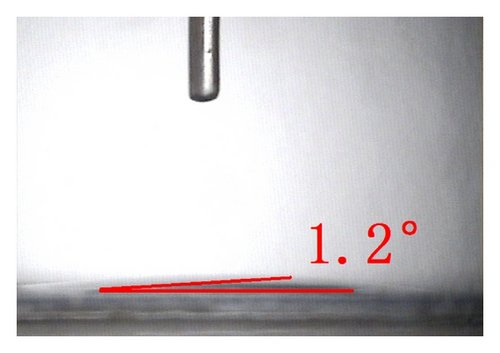
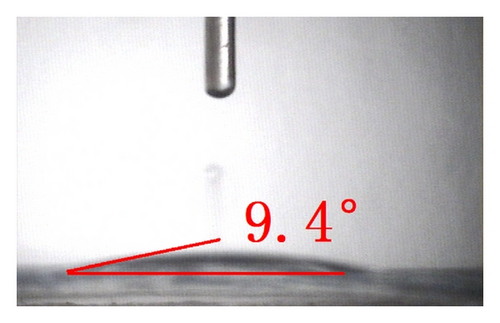
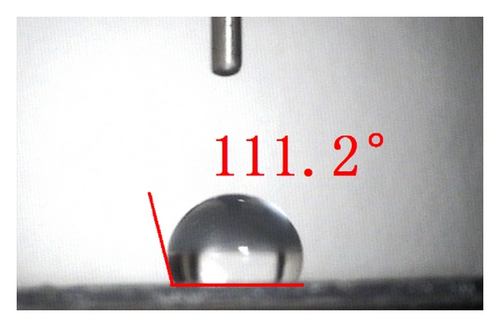
The top-view and side-view images of highly ordered TNAs prepared by anodic oxidation are shown in Figure 1(a). The tube length is measured to be 20 μm while the average inner diameter 150 nm. To observe the surface characteristics of the resulting surfaces, modified TNAs were investigated by equilibrium contact-angle measurements. The TNAs without any surface modification were used as a reference, and the corresponding contact angle is displayed in Figure 1(b). The water contact angle is 6.3 ± 2°, and the surface is practically wetting and represents a superhydrophilic behavior. We doubt that the reason for the phenomenon of the surface derives from the spreading water on the entire surface and into the pores [23]. Figures 1(c)–1(e) exhibit the contact angles of TNAs modified by TiCl4, HNO3, and KOH, respectively, and the resulting contact angles are 12.2 ± 2°, 1.2 ± 2°, and 9.4 ± 2°, respectively. It can be seen that the contact angles are different and the TNAs treated by HNO3 represent the best hydrophilicity. Besides the reason that water is spreading into the pores which is similar to the reference sample, the changes of active site and surface property play a key role in the surface wetting behavior of the TNAs modified with HNO3. Moreover, notice that the contact angles of modified samples are similar to that of the reference, all of which are smaller than 50° and show a superhydrophilic behavior. In order to study the effect of the superhydrophilic/superhydrophobic surface on the QDSSCs performance, a TNAs sample was modified with also methyltrimethoxysilane (MTMS) which is usually used for surface hydrophobic modification. The originally superhydrophilic surface becomes hydrophobic with a contact angle of about 111.2 ± 2° as shown in Figure 1(f).
3.2. Morphological Analysis
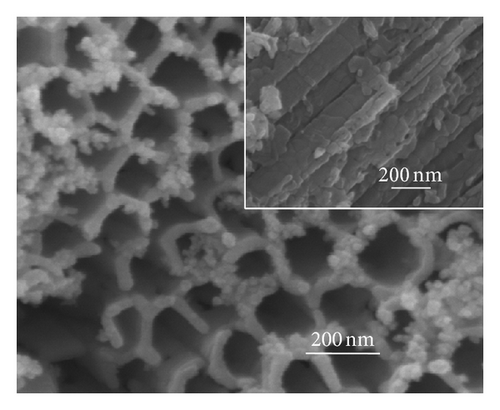
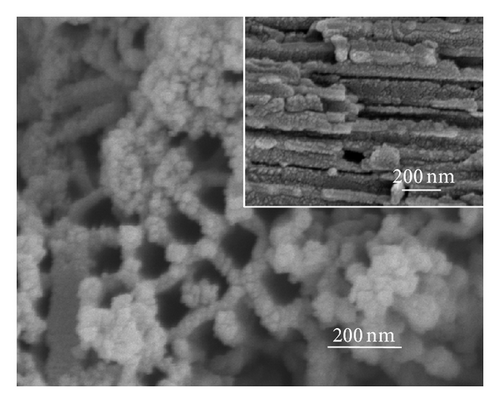
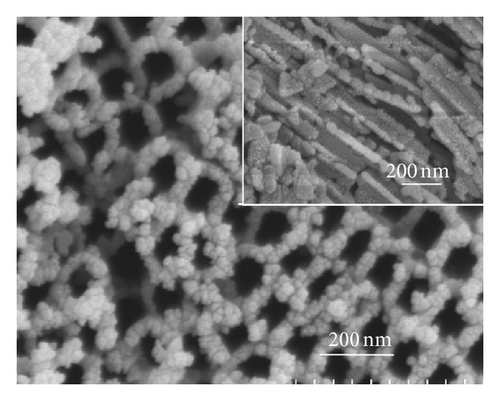
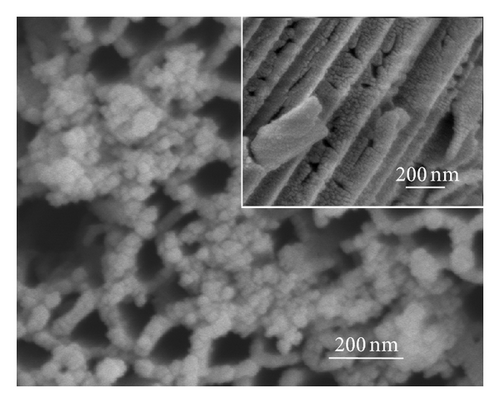
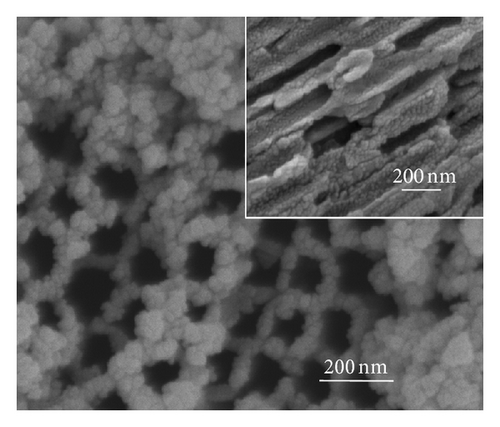
Figure 2 shows the top-view and side-view SEM images of CdS-sensitized TiO2 nanotube arrays. In Figure 2(a), CdS quantum dots are well distributed on the top surface of the TNAs without any modification, while some CdS quantum dots are found to aggregate on the openings of TNAs. The side-view SEM image in Figure 2(a) depicts that the vast majority of QDs are found to aggregate and attach to the external tube wall. The results indicate that because of the effect of surface tension, the CdS precursor solutions could not penetrate deeply into the nanotubes and cause large aggregation of CdS on the top surface and external tube wall [24]. Figure 2(b) represents the great majority of CdS quantum dots aggregated in the openings of TiO2 nanotubes treated by TiCl4. The side-view SEM image shows that CdS QDs are located on the inner tube wall of TNAs and distributed uniformly. As depicted in Figure 2(c), CdS QDs treated by HNO3 are homogeneous and rarely aggregate in the openings. Moreover, the distribution of CdS QDs in the inner spaces is also uniform and few aggregated as illustrated in the inset of Figure 2(c). In Figure 2(d), a great majority of CdS QDs aggregate in the openings of TNAs treated by KOH, while the side-view image shows a similar distribution of the sample treated by TiCl4. In the case of MTMS-treated TNAs shown in Figure 1(e), large quantity of CdS QDs blocked in the surface openings, and the side-view image in inset shows a uniform distribution in the inner spaces of TNAs. According to the surface characteristics in Figure 1, the results shown in Figure 2 suggest that superhydrophilic surface might have a uniform QDs distribution, while hydrophobic surface might be easy to cause QDs aggregation.
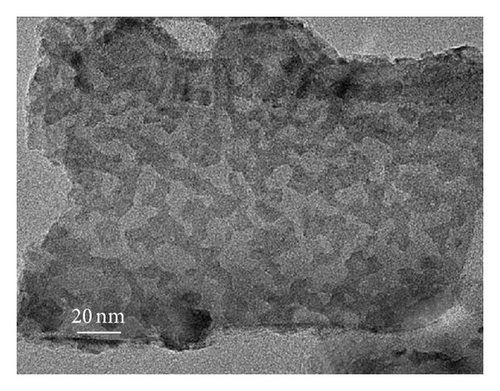
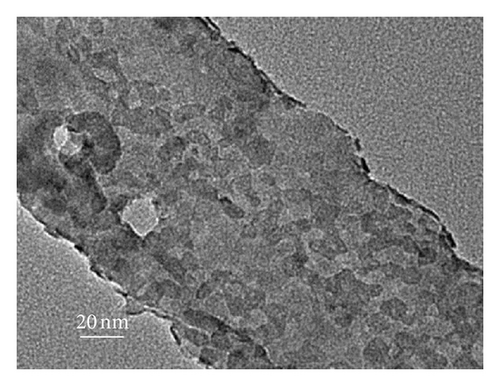
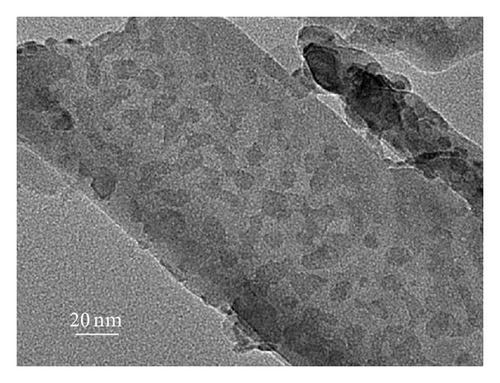
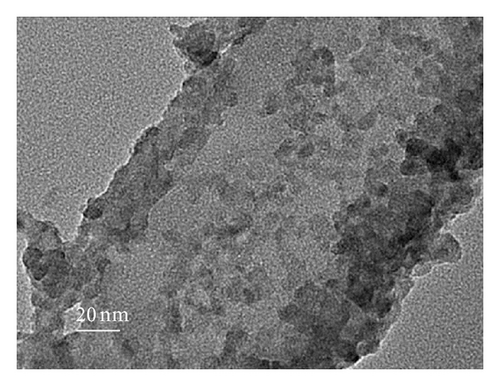
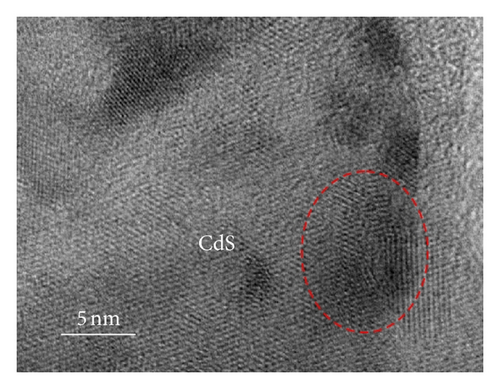
To further clarify whether or not the CdS QDs are introduced into the nanotubes wall under the influence of hydrophilic and hydrophobic modification of TNAs coated with CdS, the samples were investigated by TEM. Figure 3 shows TEM images of the reference sample and CdS/TNAs treated by TiCl4, HNO3, KOH, and MTMS, respectively. As shown in Figure 3(a), few CdS QDs are deposited in the nanotube wall of the reference sample without surface treatment. Compared with the reference sample, many CdS QDs have been attached to the nanotube wall of the sample treated by TiCl4 which is shown in Figure 3(b). And the CdS QDs are found to be aggregated in the tube wall. After being treated by HNO3, as depicted in Figure 3(c), a great majority of CdS QDs deposited in nanotube wall are better distributed. In addition, the sizes of QDs are more uniform. Similarly, the CdS QDs are also found to be aggregated for the HNO3-treated sample. As shown in Figure 3(d), CdS QDs apparently aggregate together for the CdS/TiO2 electrode treated by KOH. Besides, the CdS/TNAs electrode modified by MTMS represents the phenomenon of aggregation and the nonuniform distribution of CdS QDs in Figure 3(e). By combining Figures 2 and 3, we suggest that the CdS QDs are more uniformly distributed on the tube wall of TNAs after the treatment of HNO3 because of its superhydrophilic characteristic and smaller surface tension. Close observation by high-resolution TEM demonstrates that the size of CdS QDs is about 5–10 nm in diameter, as depicted in Figure 3(f).

3.3. XRD Analysis
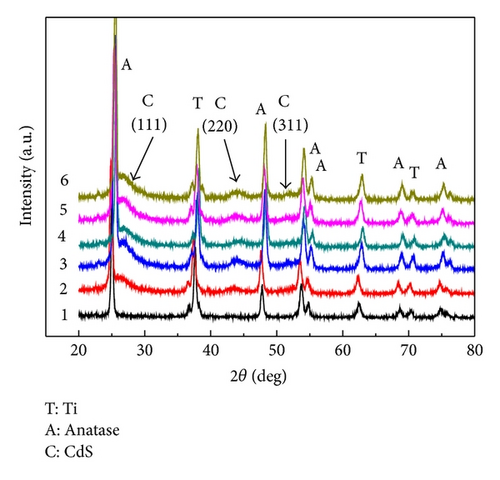
The crystal structure of the deposited CdS was examined by X-ray diffraction experiments. For comparison, the X-ray diffraction pattern from the TNAs sample is also given as curve 1 in Figure 4, where diffraction peaks are the anatase phase of TiO2 (JCPDS card no. 21-1272) and Ti metal phase. Curves 2–6 represent the diffraction peaks of CdS/TNAs treated without and with TiCl4, HNO3, KOH, and MTMS, respectively. Compared to the TiO2 nanotubes arrays, CdS/TNAs electrodes exhibited new peaks corresponding to (111), (220), (331) planes of CdS, indicating the presence of the cubic phase CdS (JCPDS card no. 80-0019). The XRD patterns of CdS/TNAs electrodes with different treatments are quite similar, which suggests that surface modification could not change the crystal structure of the photoanode.
3.4. UV-Vis Absorption Spectra Analysis
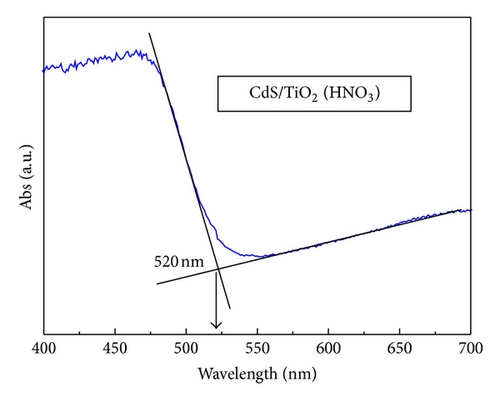
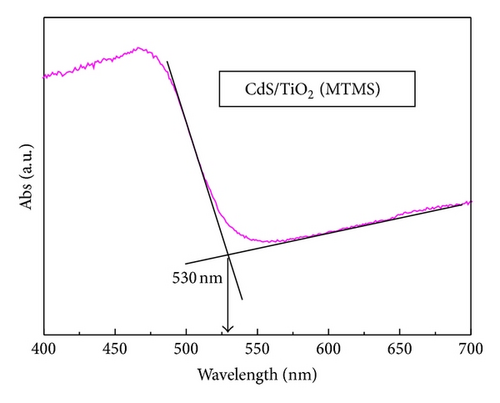
3.5. Photovoltaic Performance and Charge Transfer
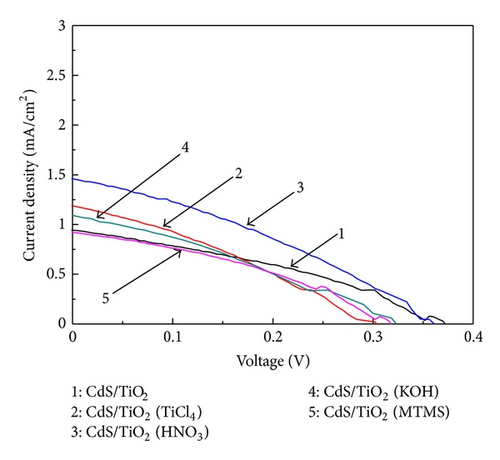
The J-V curves of QDSSCs treated without and with TiCl4, HNO3, KOH, and MTMS are shown in Figure 6. The open circuit potential (Voc), short circuit current density (Jsc), fill factor (FF), and conversion efficiency (η) of all cells are listed in Table 1. The Jsc and Voc of the reference electrode are 0.943 mA/cm2 and 0.37 V, respectively, resulting in a very low value of conversion efficiency of 0.12%. And the effect of the TiCl4 treatment TNAs is also evaluated using the same parameters. An increase in the Jsc of TiCl4-treated solar cell is observed in Table 1, while the efficiency of the cell represents a small decrease due to the reduction of the Voc and FF. The lower Voc is possibly ascribe to the decrease of the electrons transported from CdS QDs to TiO2 conduction band, leading to a decrease in the quasi-Fermi level of TiO2 [29], while lower FF may be attributed to the low driving force for the electron injection [29]. Moreover, these results clearly reflect that the TiCl4 treatment does not have a beneficial effect on QDSSCs. In the case of HNO3-treated solar cell, a systematic beneficial effect is observed. The Jsc, Voc, and η are 1.460 mA/cm2, 0.36 V, and 0.17%, respectively. The efficiency of 0.17% is 42% higher than that of the reference solar cell. Accordingly, the higher Jsc seems to be mostly owing to the better connectivity between TNAs and CdS QDs. This implies that the strong oxidizing property and high acidity of the HNO3 to some extent help make better contact between TNAs and CdS QDs [30]. Therefore, well-connected structures are able to promote electron transfer and improve Jsc. For the solar cell treated with KOH, the photovoltaic performance is similar to the TiCl4-treated solar cell. The Jsc is higher while Voc and FF are lower than those of the reference cell. In addition, the MTMS-treated solar cell shows lower Voc and efficiency than that of the reference cell. These results are in good agreement to that of Figures 2 and 3, and the lower efficiencies of the solar cells are due to the blocking QDs in the opening of nanotubes. Moreover, the Jsc of HNO3-treated solar cell increases to a maximum value of 1.460 mA/cm2, which is possibly because of the increase amount of CdS QDs deposited on TiO2 and the uniform distribution of the QDs.
| Sample | Jsc (mA/cm2) | Voc (V) | FF | η (%) |
|---|---|---|---|---|
| CdS/TiO2 | 0.943 | 0.37 | 0.35 | 0.12 |
| CdS/TiO2 (TiCl4) | 1.188 | 0.30 | 0.31 | 0.11 |
| CdS/TiO2 (HNO3) | 1.460 | 0.36 | 0.34 | 0.17 |
| CdS/TiO2 (KOH) | 1.169 | 0.32 | 0.31 | 0.12 |
| CdS/TiO2 (MTMS) | 0.923 | 0.32 | 0.36 | 0.11 |
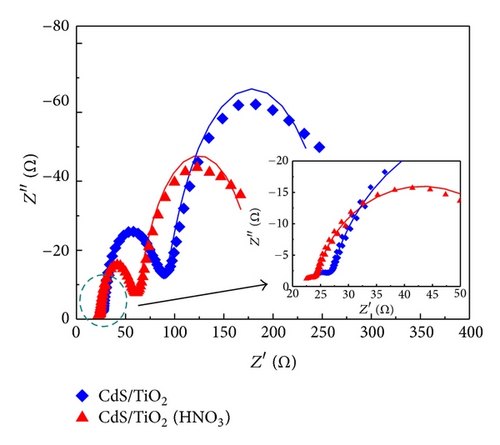
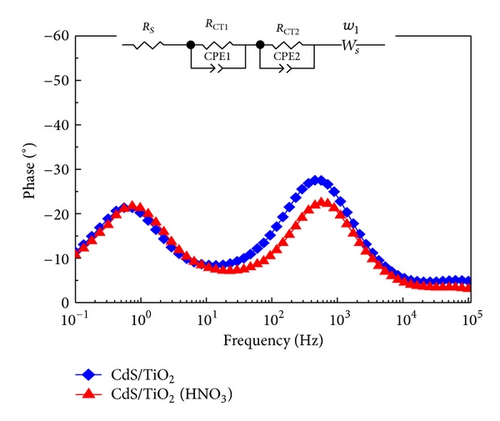
In order to find out the reasons why Jsc increases in the photoanode after HNO3 treatment, we further investigated the electron transport and charge recombination processes of the solar cells by applying EIS. Figure 7 shows the Nyquist plots and Bode plots of CdS-sensitized solar cells modified with and without HNO3, respectively, which are measured under dark conditions and open circuit potentials. EIS is a useful technique to detect kinetic processes in QDSSCs. Two distinct arcs of each plot could be seen from Figure 7(a), representing the electron transport processes at the interface of TNAs/CdS/electrolyte (frequency region 1–1000 Hz) and the feature of polysulfide solution diffusion in the electrolyte (<1 Hz). Generally, the plots of QDSSCs exhibit three arcs, while in our case the interface of the counterelectrode/electrolyte is not so obvious in the frequency region 1–100 kHz which is shown in the inset of Figure 7(a). The electrochemical parameters obtained from equivalent circuit analysis are presented in Table 2. The equivalent circuit of the solar cells is represented in the inset of Figure 7(b). For relatively low resistance, the transfer resistance of counterelectrode/electrolyte interface does not play a key role in the whole resistance of solar cell. Therefore, charge transfer is dominated by the transfer resistance at the interface of TNAs/CdS/electrolyte and the diffusion resistance of electrolyte. From Table 2, it can be seen that the values of RCT2 and RE for reference and HNO3-treated solar cells are 62.45 and 180.4 Ω, 37.04 and 127.1 Ω, respectively. It is inferred that HNO3-treated solar cell shows a lower charge transfer resistance which is responsible for the observed higher photocurrent density (Jsc = 1.460 mA/cm2) compared to reference sample. And the results are in good agreement with the photovoltaic performance of solar cells shown in Figure 6. This phenomenon may be due to the better hydrophilicity and lower surface tension of the solar cells treated by HNO3. Moreover, because of the decrease of excessive CdS hindering the access of electrolyte deep into the inner tube, Jsc of the HNO3 treatment solar cells is larger than other cells. Correspondingly, the characteristic frequency peaks in Bode phase plots are shown in Figure 7(b).
| Sample | Rs (Ω) | RCT1 (Ω) | RCT2 (Ω) | RE (Ω) |
|---|---|---|---|---|
| CdS/TiO2 | 22.98 | 3.596 | 62.45 | 180.4 |
| CdS/TiO2 (HNO3) | 21.85 | 2.09 | 37.04 | 127.1 |
4. Conclusions
In summary, CdS-sensitized TiO2 nanotube arrays have been fabricated by successive ionic layer adsorption and reaction and applied as the photoanode for quantum dots solar cells, in which the TNAs were modified using TiCl4, HNO3, KOH, and MTMS, respectively, The experimental results indicated that the conversion efficiency of HNO3-treated electrode was apparent higher than that of the solar cells without any modification, which resulted from the large surface coverage and the uniform distribution of the CdS quantum dots. Furthermore, reducing surface tension leads to a better adsorption and combination and the obvious decrease of interface transfer impedance. As a consequence, the HNO3-treated solar cells achieve a maximum short current density of 1.460 mA/cm2 and a power conversion efficiency of 0.17%, which is 42% higher than the reference sample without any surface modification.
Acknowledgments
This work was supported by Program for New Century Excellent Talents in University (NCET-09-0110), National Nature Science Foundation of China (51162007), Hainan Natural Science Foundation (511110), and Hainan Provincial Program for International S&T Cooperation (KJHZ2013-13). The authors acknowledge Mr. Guizhen Wang for the analysis of transmission electron microscopy in the Analytical and Testing Center of Hainan University. They also acknowledge Professor Hong Lin at Tsinghua University for the help of fabrication and characterization of the solar cells.


