Theoretical Studies of Dynamic Interactions in Excited States of Hydrogen-Bonded Systems
Abstract
Theoretical model for vibrational interactions in the hydrogen-bonded benzoic acid dimer is presented. The model takes into account anharmonic-type couplings between the high-frequency O–H and the low-frequency O⋯O stretching vibrations in two hydrogen bonds, resonance interactions between two hydrogen bonds in the dimer, and Fermi resonance between the O–H stretching fundamental and the first overtone of the O–H in-plane bending vibrations. The model is used for theoretical simulation of the O–H stretching IR absorption bands of benzoic acid dimers in the gas phase in the first excited singlet state. Ab initio CIS and CIS(D)/CIS/6-311++G(d,p) calculations have been carried out in the à state of tropolone. The grids of potential energy surfaces along the coordinates of the tunneling vibration and the low-frequency coupled vibration have been calculated. Two-dimensional model potentials have been fitted to the calculated potential energy surfaces. The tunneling splittings for vibrationally excited states have been calculated and compared with the available experimental data. The model potential energy surfaces give good estimation of the tunneling splittings in the vibrationally ground and excited states of tropolone, and explain monotonic decrease in tunneling splittings with the excitation of low-frequency out-of-plane modes and increase of the tunneling splittings with the excitation of low-frequency planar modes.
1. Introduction
There is recently a considerable interest in studies of hydrogen-bonded carboxylic acid dimers. The main reason comes from the fact that they constitute good models to study systems with two interacting intermolecular hydrogen bonds. Of special interest is the process of double proton tunneling along hydrogen bonds in both the ground and excited electronic states.
Electronic spectroscopy of hydrogen-bonded dimers has recently received considerable attention due to significant development and the widespread use of supersonic free jet techniques. Many investigators still use classical spectroscopic techniques, such as the vibrational spectroscopy, to study hydrogen-bonded complexes in their ground electronic states.
It is well known that vibrational spectra provide physical information on the dynamics of hydrogen bonds. The most prominent spectral changes resulting from H bond formation occur in the IR spectra, especially in the region of the X–H stretching bands (νs): decrease in the frequency of the νs stretching mode, increase of its intensity, broadening of the bands and appearance of a complex fine structure. These spectacular features of the infrared absorption band of the νs mode have been a subject of several theoretical studies [1–11].
An anharmonic-type coupling between the high-frequency X–H stretching and the low-frequency X⋯Y hydrogen bond stretching vibration, described in a quantum mechanical way by Maréchal and Witkowski [1] is an important mechanism responsible for the unique structure of νs bands of hydrogen-bonded systems. Another important mechanism influencing the fine structure of νs band is Fermi resonance. Theoretical quantum mechanical model treating this mechanism was proposed by Witkowski and Wójcik [3] for a single hydrogen bond and by Wójcik [4] for hydrogen-bonded dimers.
Benzoic acid is the simplest aromatic carboxylic acid and is also one of the most important acids in chemistry. The electronic spectra of benzoic acid have been a subject of extensive studies for a long time. Ito et al. [12] investigated the effect of dimerization on the UV absorption spectrum. Baba and Kitamura [13] examined the emission properties of the monomer and the dimer in glass solution. Baum and McClure, in series of papers, examined the absorption and emission spectra of benzoic acid dimers in single crystals of benzene [14, 15] as well as in hydrocarbon glasses [16, 17]. Later, Poeltl and McVey have reported for the first time the laser induced fluorescence excitation spectrum [18] and next the fluorescence emission spectra [19] of jet-cooled benzoic acid dimers. Tomioka et al. [20] studied the correlation between the frequencies of intermolecular hydrogen bond vibrations between the fluorescence excitation and dispersed fluorescence spectra and concluded that potentials for such vibrations are affected very little upon electronic excitation. Significant discovery was made by Remmers and et al. [21]. On the basis of their high resolution ultraviolet rotationally resolved excitation spectrum of benzoic acid dimer, they have demonstrated convincingly that the linear and planar (C2h symmetry) ground state geometry of the dimer is slightly in-plane bent (Cs symmetry) upon electronic excitation. Recently Nandi and Chakraborty [22] have reinvestigated the laser-induced dispersed fluorescence spectra and analyzed vibronic mode mixing in benzoic acid dimer with aid of DFT calculations. Among jet spectroscopic techniques there is increasing use of double resonance methods, which allow measure, for example, IR absorption of electronically excited species.
In recent years, infrared spectra of the O–H stretch region of benzoic acid dimer have been studied in both the ground and excited electronic state by Florio and et al. [23] using the FDIR (fluorescence-dip infrared) IR-UV double resonance method in supersonic jet. The authors have also computed theoretical IR spectrum of benzoic acid dimer using anharmonic constants [23, 24]. Benzoic acid has been also studied in the ground state by traditional spectroscopic techniques. Infrared spectra of hydrogen-bonded benzoic acid crystals have been recorded and interpreted theoretically by Flakus et al. [25–29] and more recently by Boczar et al. [30] The present work constitutes a development of this study and is also a continuation of our recent spectroscopic and theoretical studies of vibrational spectra of hydrogen-bonded 1-methylthymine [31], acetic acid [32], and salicylic acid [33]. Theoretical studies on different hydrogen-bonded chemical and biochemical systems in excited electronic states have been performed in recent years [34–37].
The motion of protons in hydrogen bonds causes great number of interesting physical effects. Quantum effects, such as the proton tunneling phenomenon, and strong interactions with vibrating surrounding atoms in hydrogen bonds are of special interest. The importance of proton tunneling in chemical and biological systems is well known, for example, for the DNA base pairing, as discussed by Löwdin [38]. The phenomenon of potential barrier penetration plays an important role in many branches of physics: quantum field theory, fission of atomic nuclei, scanning tunneling microscopy, and solid state physics [39]. In recent decade appeared several theoretical studies of proton tunneling in different systems [40–49].
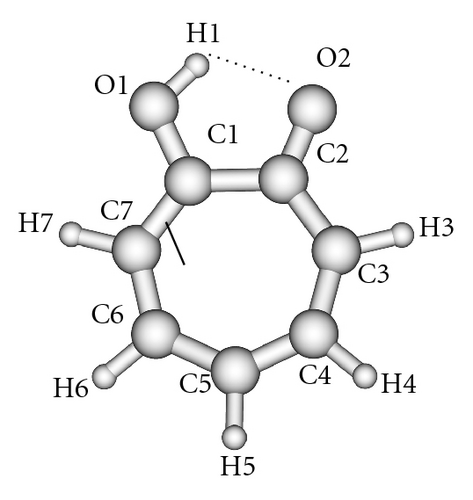
Theoretical studies of proton tunneling require the knowledge of multidimensional potential energy surfaces which are difficult to obtain from ab initio calculations, especially for electronically excited states. Tropolone with its intramolecular hydrogen bond is a model substance for studying tunneling process in the ground as well as in the excited electronic state [50–59]. The geometry of tropolone is presented in Figure 4. Multidimensional proton tunneling in tropolone has been theoretically studied by Vener et al. [56] using adiabatic separation of variables. Smedarchina et al. [57] used instanton approach to account for tunneling splittings. Takada and Nakamura [58] studied model potentials. On the base of ab initio calculations they proposed model potential energy surfaces (PES) for electronically ground state of tropolone and employed it to analyze dynamics of proton tunneling. They were however unable to perform similar calculations for the excited à state. In this paper we report results of high accuracy ab initio calculations of the potential energy surface in the excited à state of tropolone. We fit two-dimensional analytical model potentials to these surfaces and by solving the two-dimensional vibrational problems, we interpret observed splittings and their dependence on vibrational excitations in the laser fluorescence excitation spectra of jet-cooled tropolone [53, 54]. This work constitutes improvement of previous approach of Wójcik et al. [59] to multidimensional proton tunneling in the excited state of tropolone.
This review presents results published in [60, 61]. In Section 2 we present theoretical interpretation of vibrational interactions in hydrogen bonds in benzoic acid dimer in the first excited electronic state and interpret its experimental FDIR spectrum recorded by Florio et al. [23]. The theoretical model describing these interactions is proposed and used to simulate the fine structure of the O–H stretching IR absorption band in the S1 electronic state. In addition quantum mechanical ab initio calculations have been made in order to obtain the excited state structure of benzoic acid dimer and its vibrational frequencies. In Section 3 we present the results of quantum chemical calculations for the à state of tropolone. We discuss two-dimensional potential models of the tunneling and interpret experimentally observed tunneling splittings [53, 54]. Concluding remarks are given at the end of each section.
2. Theoretical Interpretation of Vibrational Interactions in Hydrogen Bonds in Benzoic Acid Dimer in the First Excited Singlet State S1
2.1. Quantum Chemical Calculations
All calculations have been carried out using the Gaussian 03 package [62]. The vertical singlet state energies were obtained by the ab initio single excitation configuration-interaction calculations at the CIS [63] and CIS(D) [64, 65] levels with the 6-311++G(d,p) basis set. The calculations were performed for the five lowest singlet excited states of benzoic acid dimer starting from the C2h ground state geometry optimized at B3LYP/6-311++G(d,p) level. The RHF/6-311++G(d,p) population analysis was also performed for the ground state geometry in order to examine the orbitals involved in proper electronic excitations.
In the first excited singlet state (S1) the geometry of benzoic acid dimer was optimized and the vibrational frequencies were computed at the CIS/6-311++G(d,p) level. To ensure reliable frequencies of low-frequency vibrational modes (with very small force constants), especially intermolecular, in the present calculations we used the tight convergence criteria.
2.2. Theoretical Model
- (1)
In our model the basic physical mechanism responsible for the energy and intensity distributions within the IR O–H stretching absorption band is an anharmonic-type coupling between the high-frequency O–H stretching vibration and the low-frequency hydrogen bond O⋯O stretching vibration (νσ) in each hydrogen bond. Since the νs oscillatory motion is at least an order of magnitude faster than the oscillatory motion νσ, the vibrational wavefunction for these modes is represented in crude adiabatic approximation. This approximation is true only for weak and medium strong hydrogen bonds. The high-frequency νs vibration determines potential for the low-frequency νσ vibration in each hydrogen bond. The νs and νσ vibrations are assumed to be harmonic.
- (2)
When νs vibration is excited, there is shift of equilibrium position of the potential energy for νσ vibration (linear distortion). We do not consider change of force constant after excitation.
- (3)
In the ground electronic state (S0) the benzoic acid dimer has C2h symmetry, therefore in the case of two equivalent intermolecular hydrogen bonds, present in the dimer, a nonadiabatic resonance interaction (Davydov coupling) is considered in the degenerate excited vibrational state of the νs vibrations. This effect is a vibrational analogue of the vibronic coupling, such as the pseudo-Jahn-Teller effect, occurring in the electronic spectra of symmetric dimers [64]. From the experimental data it has been concluded that in the first excited electronic state benzoic acid dimer is in-plane bent as an effect of localised electronic excitation on one moiety of the dimer [14, 18, 19, 21].
- (4)
In our model we also consider Fermi resonance between the O–H stretching fundamental and the first overtone of the O–H in-plane bending (νb) in each hydrogen bond in the dimer.
2.2.1. Vibrational Hamiltonians for The Dimer
Let us consider a planar cyclic dimer of benzoic acid, presented in Figure 1. In the ground electronic state it has C2h symmetry with two hydrogen bonds, linking two moieties of the dimer, related by the symmetry operator corresponding to twofold symmetry axis. Theoretical model of such dimer with Fermi resonance, presented below, has been developed by Wójcik [4].
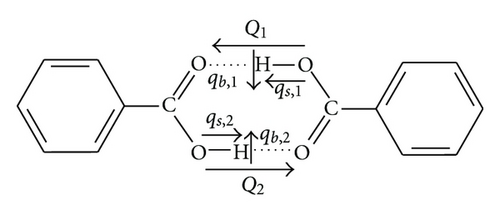
We denote by qs,i, qb,i, and Qi (i = 1,2) the coordinates of the O–H stretching, O–H in-plane bending, and O⋯O hydrogen bond stretching vibrations in the first or second hydrogen bond (Figure 1). The corresponding frequencies are denoted by ωs, ωb, Ω.
2.2.2. Intensities
For simplicity we assumed in the formula (16) that transition moments (15) are the same for both hydrogen bonds in the dimer in the S1 state.
2.3. Results and Discussion
The UV absorption spectrum of benzoic acid consists of three bands: A (190 nm), B (230 nm), and C (280 nm) [16, 18], which result from single photon transitions to three lowest electronic states. All three bands are associated with the π* ← π transitions and there is general agreement that the C band is an effect of transition analogous to the transition in benzene. Table 1 presents the calculated excitation energies for benzoic acid dimer for the first three allowed excited states obtained by the CIS and CIS(D) methods, which are compared with the experimental data. The comparison was made on the basis of the analysis of orbitals involved in electronic excitations, calculated oscillator strengths, and symmetry of the states.
Figure 2 presents the geometry of benzoic acid dimer in excited electronic state optimized at the CIS/6-311++G(d,p) and numbering the atoms. Calculated bond lengths and bond angles are summarized in Table 2. The calculated values confirm the experimental predictions that electronic excitation leads to the shortening of one of the hydrogen bonds, whereas the other is lengthened. Also one can observe the asymmetry in calculated corresponding geometrical parameters within the aromatic rings.
| Bond lengths (Å) | Angles (deg) | ||
|---|---|---|---|
| O1⋯O2′ | 2.739 | O1–H1⋯O2′ | 176.7 |
| O2⋯O1′ | 2.800 | O1′–H1′⋯O2 | 175.3 |
| O1–H1 | 0.963 | C1–O1–H1 | 110.8 |
| O1′–H1′ | 0.958 | C1′–O1′–H1′ | 110.5 |
| O2′⋯H1 | 1.776 | C1–O2⋯H1′ | 129.8 |
| O2⋯H1′ | 1.844 | C1′–O2′⋯H1 | 131.1 |
| C1–O1 | 1.304 | O1–C1–O2 | 123.2 |
| C1′–O1′ | 1.315 | O1′–C1′–O2′ | 122.6 |
| C1=O2 | 1.200 | O1–C1–C2 | 114.2 |
| C1′=O2′ | 1.213 | O1′–C1′–C2′ | 114.6 |
| C1–C2 | 1.489 | O2–C1–C2 | 122.6 |
| C1′–C2′ | 1.447 | O2′–C1′–C2′ | 122.8 |
| C2–C3 | 1.389 | C1–C2–C3 | 121.4 |
| C2′–C3′ | 1.402 | C1′–C2′–C3′ | 123.5 |
| C3–C4 | 1.384 | C2–C3–C4 | 119.9 |
| C3′–C4′ | 1.414 | C2′–C3′–C4′ | 120.4 |
| C4–C5 | 1.386 | C3–C4–C5 | 120.0 |
| C4′–C5′ | 1.417 | C3′–C4′–C5′ | 121.9 |
| C5–C6 | 1.387 | C4–C5–C6 | 120.3 |
| C5′–C6′ | 1.397 | C4′–C5′–C6′ | 118.1 |
| C6–C7 | 1.383 | C5–C6–C7 | 119.9 |
| C6′–C7′ | 1.412 | C5′–C6′–C7′ | 120.7 |
| C7–C2 | 1.390 | C6–C7–C2 | 120.0 |
| C7′–C2′ | 1.436 | C6′–C7′–C2′ | 121.3 |
| C3–H3 | 1.073 | C7–C2–C3 | 120.0 |
| C3′–H3′ | 1.072 | C7′–C2′–C3′ | 117.7 |
| C4–H4 | 1.075 | C7–C2–C1 | 118.6 |
| C4′–H4′ | 1.074 | C7′–C2′–C1′ | 118.8 |
| C5–H5 | 1.076 | C2–C3–H3 | 119.7 |
| C5′–H5′ | 1.072 | C2′–C3′–H3′ | 120.1 |
| C6–H6 | 1.075 | C3–C4–H4 | 119.9 |
| C6′–H6′ | 1.074 | C3′–C4′–H4′ | 118.7 |
| C7–H7 | 1.073 | C4–C5–H5 | 119.9 |
| C7′–H7′ | 1.073 | C4′–C5′–H5′ | 120.6 |
| C5–C6–H6 | 120.2 | ||
| C5′–C6′–H6′ | 120.6 | ||
| C6–C7–H7 | 120.9 | ||
| C6′–C7′–H7′ | 120.3 |
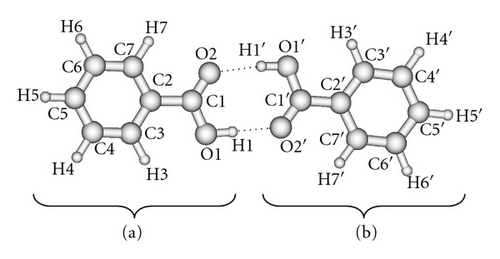
The predicted dipole moment of benzoic acid dimer in the S1 state is 0.55 D with 0.54 D component along axis of the dimer and 0.12 D component perpendicular to the axis of the dimer. The calculated rotational constants for the electronically excited dimer are A = 1949.2 MHz, B = 124.6 MHz, and C = 117.1 MHz.
In Table 3 we present the calculated vibrational frequencies of benzoic acid dimer in the S1 state. This table contains also symmetry and description of the normal modes. All frequencies have been uniformly scaled by a factor of 0.9 as recommended to compensate for the neglect of mechanical anharmonicity and lack of electron correlation in the CIS method [68]. We used the MOLDEN program [69] to visualize the amplitudes of the normal modes.
| No. | Sym. | Freq. ν (cm−1) | Approximate description |
|---|---|---|---|
| 1 | A′′ | 16 | “Butterfly” monomers twisting |
| 2 | A′′ | 30 | Oop. monomers twisting |
| 3 | A′ | 45 | Ip. monomers twisting (“cogwheel”) |
| 4 | A′′ | 52 | Oop. monomers rocking |
| 5 | A′′ | 71 | τ(COOH) |
| 6 | A′′ | 80 | τ(COOH) |
| 7 | A′ | 87 | Ip monomers rocking (H-bond shearing) |
| 8 | A′ | 96 | H-Bonds stretching |
| 9 | A′′ | 103 | τ(COOH) |
| 10 | A′′ | 172 | γ(–COOH) (A) |
| 11 | A′ | 214 | δ(–COOH) (B) |
| 12 | A′′ | 215 | γ(–COOH) (B) |
| 13 | A′ | 249 | δ(–COOH) (A) |
| 14 | A′′ | 306 | Oop. ring deform. (B) |
| 15 | A′ | 307 | Ip. ring deform. (B) |
| 16 | A′′ | 327 | Oop. asym. rings deform. |
| 17 | A′ | 380 | Ip. ring deform. (A) |
| 18 | A′ | 402 | Ip. ring deform. (B) |
| 19 | A′′ | 409 | Oop. ring deform. (A) |
| 20 | A′′ | 437 | Oop. ring deform. (A) |
| 21 | A′ | 497 | δ(C–COOH) (A) |
| 22 | A′ | 525 | δ(C–COOH) (B) |
| 23 | A′ | 592 | δ(COOH) sciss. + ip. ring deform. (B) |
| 24 | A′ | 606 | Ip. ring deform. (A) |
| 25 | A′′ | 624 | γ(CH) (B) |
| 26 | A′ | 646 | δ(COOH) sciss. + ip. ring deform. (A) |
| 27 | A′′ | 673 | Oop. ring deform. (A) |
| 28 | A′′ | 700 | γ(COOH) + γ(CH) (B) |
| 29 | A′′ | 718 | γ(CH) (A) |
| 30 | A′ | 740 | δ(COOH) sciss. + ring breath. (B) |
| 31 | A′′ | 746 | γ(OH) + γ(CH) (B) |
| 32 | A′′ | 755 | γ(OH) + γ(CH) (B) |
| 33 | A′ | 777 | δ(COOH) sciss. + ring breath. (A) |
| 34 | A′′ | 780 | γ(C–COOH) + γ(OH) + γ(CH) (B) |
| 35 | A′′ | 816 | γ(C–COOH) + γ(OH) + γ(CH) (A) |
| 36 | A′′ | 836 | γ(CC) + γ(CH) (B) |
| 37 | A′′ | 860 | γ(CC) + γ(CH) (A) |
| 38 | A′′ | 877 | γ(OH) (A) |
| 39 | A′′ | 901 | γ(OH) (B) |
| 40 | A′ | 903 | ν(CC)ring (B) |
| 41 | A′ | 944 | Ring breath. (B) |
| 42 | A′ | 965 | ν(CC)ring (B) |
| 43 | A′′ | 965 | γ(CH) |
| 44 | A′ | 976 | Ring breath. (A) |
| 45 | A′ | 1003 | Ring breath. (A) |
| 46 | A′′ | 1004 | γ A(CH) (A) |
| 47 | A′′ | 1009 | γ A(CH) (A) |
| 48 | A′ | 1021 | ν(CC)ring (B) |
| 49 | A′ | 1050 | ν(CC)ring (A) |
| 50 | A′ | 1089 | ν(CC)ring + δ(CH) (A) |
| 51 | A′ | 1099 | δ(CC)ring + δ(CH) (B) |
| 52 | A′ | 1111 | ν(CC)ring + δ(CH) (A) |
| 53 | A′ | 1133 | δ(CH) (B) |
| 54 | A′ | 1155 | δ(CH) (A) |
| 55 | A′ | 1201 | ν(CC)ring + δ(CH) (A) |
| 56 | A′ | 1205 | ν(CC)ring + δ(CH) (B) |
| 57 | A′ | 1254 | δ(OH) (B) |
| 58 | A′ | 1282 | δ(OH) (A) |
| 59 | A′ | 1309 | δ(CH) (B) |
| 60 | A′ | 1312 | δ(CH) (A) |
| 61 | A′ | 1385 | δ(CH) (B) |
| 62 | A′ | 1392 | δ(CH) (A+B) |
| 63 | A′ | 1417 | δ(CH) (A+B) |
| 64 | A′ | 1437 | ν(CC)ring + δ(CH) (A) |
| 65 | A′ | 1445 | ν(CC)ring + δ(CH) (B) |
| 66 | A′ | 1485 | ν(CC)ring + δ(CH) (A) |
| 67 | A′ | 1533 | ν(CC)ring + δ(CH) (B) |
| 68 | A′ | 1586 | ν(CC)ring (B) |
| 69 | A′ | 1587 | ν(CC)ring (A) |
| 70 | A′ | 1609 | ν(CC)ring (A) |
| 71 | A′ | 1653 | ν(C=O) (B) |
| 72 | A′ | 1723 | ν(C=O) (A) |
| 73 | A′ | 2990 | ν(CH) (A) |
| 74 | A′ | 3004 | ν(CH) (A) |
| 75 | A′ | 3013 | ν(CH) (A) |
| 76 | A′ | 3015 | ν(CH) (B) |
| 77 | A′ | 3020 | ν(CH) (B) |
| 78 | A′ | 3034 | ν(CH) (A) |
| 79 | A′ | 3038 | ν(CH) (A) |
| 80 | A′ | 3039 | ν(CH) (B) |
| 81 | A′ | 3047 | ν(CH) (B) |
| 82 | A′ | 3051 | ν(CH) (B) |
| 83 | A′ | 3367 | ν(OH) (A) |
| 84 | A′ | 3473 | ν(OH) (B) |
- The calculated frequencies were uniformly scaled by a factor of 0.9. (A) and (B) label the molecule of the dimer, which is necessary for proper mode description.
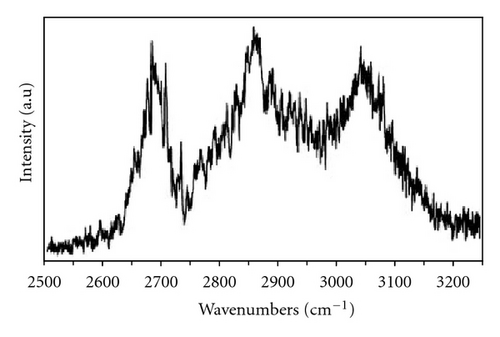
The experimental FDIR (fluorescence-dip infrared) spectra of benzoic acid dimers in the excited state, taken from [23], are presented in Figure 3(a) for the O–H stretch region. Both bands exhibit fine structures. The νs bands are composed of three main branches, which suggest presence of Fermi resonances. To reproduce the fine structure of experimental O–H stretching absorption bands of benzoic acid dimer, we used theoretical model presented in Section 2.2.1. The model describes complex interplay of three different vibrational couplings in a network of hydrogen bonds in benzoic acid dimer—an anharmonic coupling between the high-frequency O–H stretching and the low-frequency intermolecular O⋯O stretching modes, resonance (Davydov) interaction between two intermolecular hydrogen bonds in a cyclic system, and Fermi resonance between the O–H stretching and the overtone of the O–H in-plane bending vibrations. For the dimers in the S1 state lowering of their symmetry upon electronic excitation was taken into account.
The experimental frequencies of the O⋯O hydrogen bonds stretching modes, observed in the jet-dispersed fluorescence and laser induced fluorescence spectra of benzoic acid, have been reported to be 118 cm−1 for both the S0 and S1 states of the dimer [18, 22]. This frequency was taken into account in our model calculations.
To calculate energies and intensities of transitions between the ground and first excited vibrational states of the O–H stretching vibrations, we solved the Schrödinger equations for both states. In the ground state the energies and eigenfunctions are the solutions of equations for harmonic oscillator. In the excited state they are solutions of the Schrödinger equation with the Hamiltonian (11) for S1. The energies and eigenfunctions in the excited vibrational O–H state were calculated variationally by approximating two components of the spinor (10) in the ground electronic state or four components of the spinor (17) in the excited electronic state by finite linear combinations of fourfold products of harmonic oscillator wavefunctions. We assumed the temperature 10 K as close to typical temperature of cold environment of free-jet expansion.
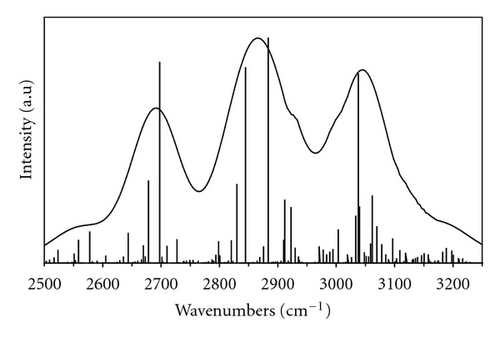
We have fitted the calculated spectra to the position of the peak with maximum intensity. In calculations of the S1 IR spectra we took the frequencies 3367 and 3473 cm−1 from ab initio CIS calculations for two O–H groups forming hydrogen bonds. We also assumed exact Fermi resonances (, ).
In order to determine optimum parameters we performed series of calculations of the νs stretching bands to minimize the square root deviation between experimental and theoretical spectra. All parameters were determined with the accuracy of 0.01.
Theoretical spectrum of benzoic acid in the S1 state is shown and compared with the experimental spectrum in Figure 3. The optimized parameters are listed in Table 4. The theoretical spectra are shown as the Dirac delta functions and as bandshapes calculated with Gaussian functions of the optimal half width.
| S1-state | |
|---|---|
| Ω (exp.) | 118 cm−1 |
| b1 | 0.89 |
| b2 | 0.82 |
| Vres | −0.09 |
| 0.66 | |
| 0.72 | |
| δ2 (fixed) | 0.01 |
| Half-width | 60 cm−1 |
The reproduction of the experimental band is good. Presented results of model calculation correctly reproduce main features of the experimental spectrum. Discrepancies between theory and experiment are related to assumptions of the present model. Our model assumes that low-frequency O⋯O motion is harmonic and does not consider electrical anharmonicity. Further improvements of the model should improve agreement between theoretical and experimental bands.
2.4. Conclusions
We developed a theoretical model for an isolated hydrogen-bonded dimer of benzoic acid, in the excited electronic state, describing vibrational couplings between high- and low-frequency stretching modes in the hydrogen bonds, resonance interactions between two hydrogen bonds, and Fermi resonances between the fundamental O–H stretching and the overtone of the O–H in plane bending vibrations. This model was successfully used for reproduction of experimental spectrum in the excited electronic state of benzoic acid dimer. The experimental frequencies assigned to intermolecular O⋯O hydrogen bond stretching vibrations by ab initio calculations were used in our model calculations. The calculated bandshapes and fine structures are in good agreement with the experimental ones. Our results show that considered mechanisms are the most important for hydrogen dynamics in hydrogen-bonded dimers. Infrared spectroscopy is the leading method for studying hydrogen bond properties. Quantitative theory of the IR spectra of hydrogen-bonded dimer, presented in this paper, allows for systematic study of the relation between the properties of the hydrogen bonds in the ground and excited electronic states, which is a problem of major scientific interest.
3. Theoretical Simulation of Proton Tunneling in the Excited Electronic State of Tropolone
3.1. Quantum Chemical Calculations
We performed ab initio CIS calculations of the à state of tropolone using the GAUSSIAN 03 program package [62]. The geometry was optimized and the vibrational frequencies were calculated by the ab initio single-excitation configuration interaction [70] (CIS) with the 6-311++G(d,p). Optimized geometries are summarized in Table 5. Previous calculations of Wójcik et al. [59] performed at the CIS/6-31++G(d,p) gave slightly nonplanar geometry (in the 6-31G(d,p) basis it was planar). Our calculations confirm nonplanar structure. Increased basis set diminishes the C=O bond length by 0.007 Å. The O⋯O distance becomes larger by 0.002 Å and the O–H distance is shorter by 0.002 Å.
| Bond lengths | CIS/6-31++G(d,p) [59] (Å) | CIS/6-311++G(d,p) (Å) | Bond angles | CIS/6-31++G(d,p) [59] (°) | CIS/6-311++G(d,p) (°) | Dihedral angles | CIS/6-311++G(d,p) (°) |
|---|---|---|---|---|---|---|---|
| O1⋯O2 | 2.534 | 2.536 | O1–H1···O2 | — | 115.6 | C1–C2–C3–C4 | −2.2 |
| O1–H1 | 0.954 | 0.952 | C1–O1–H1 | 108.4 | 108.3 | C2–C3–C4–C5 | 8.8 |
| C2=O2 | 1.218 | 1.211 | O2–O1–H1 | 44.5 | 44.5 | C3–C4–C5–C6 | −0.1 |
| C1–O1 | 1.320 | 1.320 | C1–C2–O2 | 113.3 | 113.5 | C4–C5–C6–C7 | −10.0 |
| C1–C2 | 1.512 | 1.510 | C1–C2–C3 | 125.3 | 125.3 | C5–C6–C7–C1 | 4.6 |
| C2–C3 | 1.432 | 1.435 | C2–C3–C4 | 128.3 | 128.5 | C6–C7–C1–C2 | 8.6 |
| C3–C4 | 1.398 | 1.395 | C3–C4–C5 | 129.7 | 129.9 | C7–C1–C2–C3 | −9.8 |
| C4–C5 | 1.387 | 1.386 | C4–C5–C6 | 129.4 | 129.4 | O1–C1–C2–O2 | −5.9 |
| C5–C6 | 1.425 | 1.424 | C5–C6–C7 | 128.3 | 128.4 | ||
| C6–C7 | 1.387 | 1.385 | C6–C7–C1 | 128.8 | 129.0 | ||
| C7–C1 | 1.388 | 1.388 | C7–C1–C2 | 128.7 | 128.8 | ||
| C3–H3 | 1.074 | 1.074 | C2–C3–H3 | — | 113.0 | ||
| C4–H4 | 1.076 | 1.076 | C3–C4–H4 | — | 115.0 | ||
| C5–H5 | 1.076 | 1.076 | C4–C5–H5 | — | 115.7 | ||
| C6–H6 | 1.075 | 1.074 | C5–C6–H6 | — | 115.7 | ||
| C7–H7 | 1.076 | 1.076 | C6–C7–H7 | — | 117.0 |
The calculated frequencies of the normal modes of the tropolone molecule are summarized in Table 6. The modes used in model calculations are pictured in Figure 5. All frequencies have been scaled by a factor of 0.9 as recommended to compensate for the neglect of electron correlation [68]. The lowest-frequency ν39 mode strikingly changes its frequency from 109 cm−1 in the ground state to 39 cm−1 in the excited à state [54]. These experimental frequencies are reproduced by calculations of Takada and Nakamura [58] and the present one (105 cm−1 and 29 cm−1, resp.). This frequency is especially important for the interpretation of the long sequence of the tunneling energy splittings suppressed by the excitation of this mode [53, 54].
| No. | Sym. | CIS/6-31++G(d,p)[59] | CIS/6-311++G(d,p) |
|---|---|---|---|
| Freq. (cm−1) | Freq. (cm−1) | ||
| 1 | A | 3591 | 3594 |
| 2 | A | 3041 | 3021 |
| 3 | A | 3035 | 3015 |
| 4 | A | 3021 | 3001 |
| 5 | A | 3015 | 2994 |
| 6 | A | 3003 | 2983 |
| 7 | A | 1615 | 1611 |
| 8 | A | 1548 | 1538 |
| 9 | A | 1517 | 1506 |
| 10 | A | 1478 | 1470 |
| 11 | A | 1431 | 1423 |
| 12 | A | 1395 | 1391 |
| 13 | A | 1353 | 1347 |
| 14 | A | 1281 | 1273 |
| 15 | A | 1231 | 1227 |
| 16 | A | 1183 | 1178 |
| 17 | A | 1145 | 1139 |
| 18 | A | 1059 | 1033 |
| 19 | A | 945 | 998 |
| 20 | A | 899 | 938 |
| 21 | A | 842 | 910 |
| 22 | A | 899 | 894 |
| 23 | A | 842 | 832 |
| 24 | A | 827 | 821 |
| 25 | A | 760 | 752 |
| 26 | A | 703 | 701 |
| 27 | A | 675 | 673 |
| 28 | A | 631 | 617 |
| 29 | A | 616 | 606 |
| 30 | A | 575 | 564 |
| 31 | A | 516 | 515 |
| 32 | A | 477 | 466 |
| 33 | A | 417 | 414 |
| 34 | A | 350 | 348 |
| 35 | A | 347 | 344 |
| 36 | A | 317 | 314 |
| 37 | A | 259 | 262 |
| 38 | A | 132 | 130 |
| 39 | A | 37 | 29 |
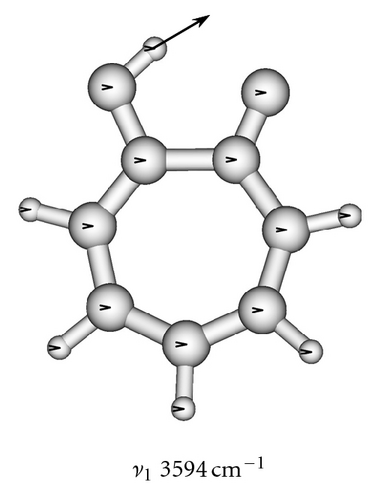
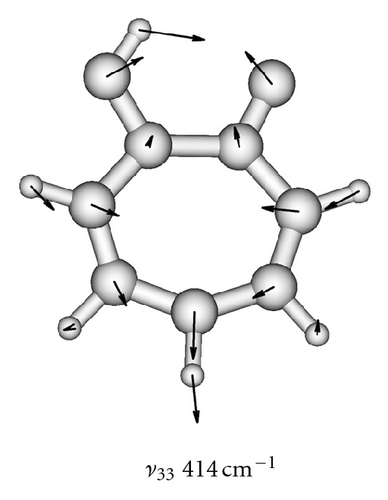
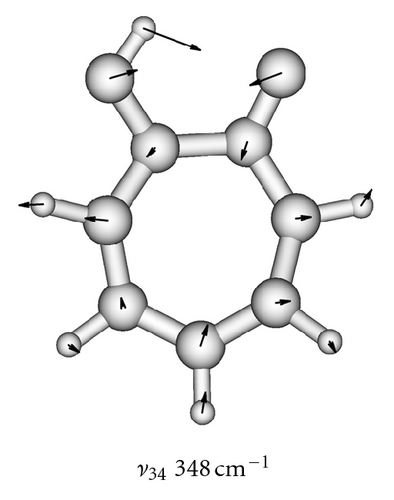
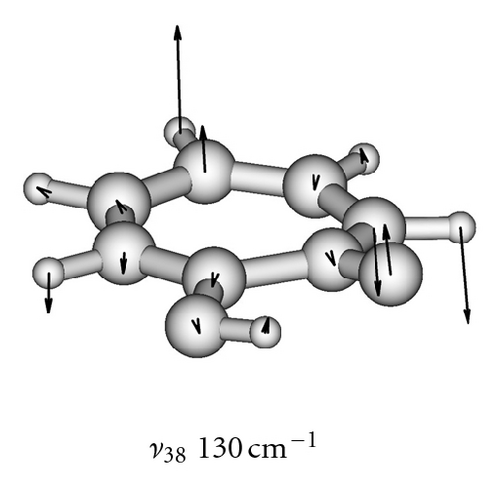
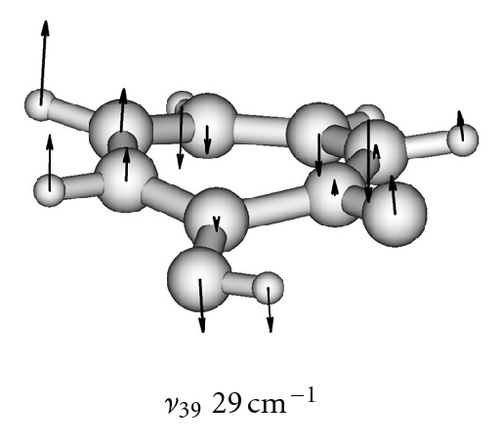
To obtain two-dimensional potential energy surfaces for the high-frequency tunneling mode and one of selected low-frequency modes, nearly planar modes ν33 and ν34 and out-of-plane modes ν38 and ν39 we performed ab initio calculations of the normal modes of tropolone in the à state in high precision format. We applied the keyword “HPModes” in GAUSSIAN in order to obtain the high precision format (to five digits) for vibrational frequency eigenvectors in the frequency output in addition to the normal three-digit output. In the next step, beginning from the optimized equilibrium geometry of the tropolone molecule in the à state, the series of geometries were generated. We varied the amplitudes of atomic movements for a given vibrational mode, independently for each of two coupling modes, high frequency O–H stretching tunneling mode and one of the low-frequency modes. For each geometry mass-weighed normal coordinates have been calculated for the tunneling mode and for the low-frequency mode. The amplitudes of atomic movements were varied in the range comprising structures where distances between hydrogen atom and two oxygen atoms are equal. Such points correspond to the barrier in the double well potential surface and the corresponding structures are planar. The number of generated structures for four low-frequency modes coupled with the tunneling mode varied between 620–670 including points corresponding the barrier. For each point the single point energy was calculated at the CIS/6-311++G(d,p) level in the à state of tropolone. In this way the one half (including barrier) of double well potential surface was obtained for each pair of coupled modes. The second half was obtained using the symmetry of the potential.
3.2. Model Calculations
On the basis of the ab initio calculations we constructed two-dimensional model PES’s for the proton tunneling mode ν1 coupled to low-frequency modes of tropolone which largely affect the tunneling. These are nearly planar hydrogen-bond streching modes ν33 and ν34 and the lowest-frequency out-of-plane modes ν38 and ν39. They are shown in Figure 5 and their calculated and experimental vibrational frequencies are compared in Table 7.
| Mode | CIS/6-311++G(d,p) | Exp. [54] |
|---|---|---|
| (cm−1) | (cm−1) | |
| 33 | 414 | 414 |
| 34 | 348 | 296 |
| 38 | 130 | 171 |
| 39 | 29 | 39 |
- (a)
the symmetric mode coupling potential (SMC) describing couplings of the proton tunneling mode ν1 with the nearly planar modes ν33 and ν34:
()and - (b)
the squeezed double well potential (SQZ) describing couplings of the proton tunneling mode ν1 with the out-of-plane modes ν38 and ν39:
()
| Mode | X0 | α | γ |
|---|---|---|---|
| 33 | 3.15 | 0.301 | |
| 34 | 3.15 | 0.323 | |
| 38 | 3.15 | 0.006640 | |
| 39 | 3.15 | 0.000911 |
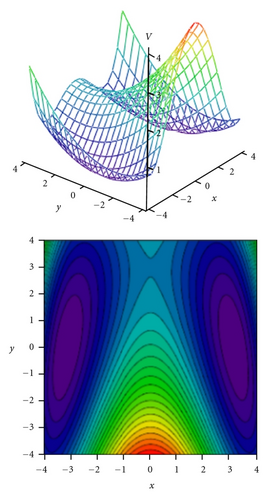
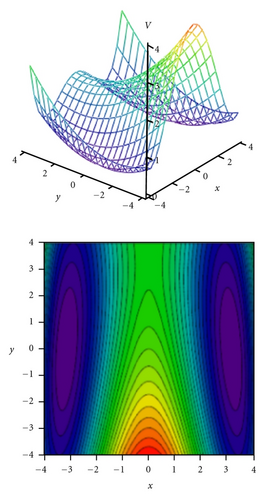
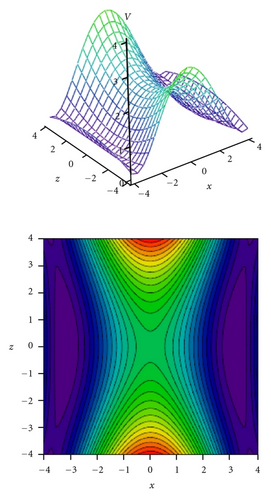
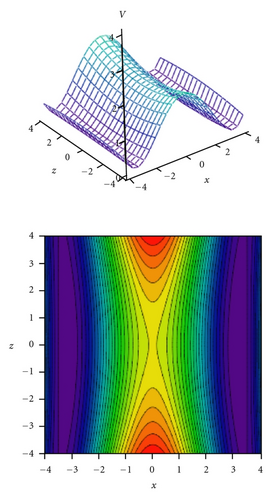
Tunneling energy splittings have been calculated variationally by the DVR method [74, 75]. The results are presented in Table 9. Comparison between calculated and experimental splittings shows that two-dimensional model potentials fitted to the grids of energies calculated by the CIS/6-311++G(d,p) method very well reproduce experimentally observed tunneling splittings and their dependence on vibrational excitations in tropolone. The calculated potential energy surfaces quantitatively explain increase of the tunneling splittings with excitations of the nearly planar ν33 and ν34 modes and decrease of the splittings with excitation of the out-of-plane ν38 and ν39 modes. Especially striking is long sequence of monotonic decrease of the energy splittings accompanying excitations of the out-of-plane ν39 mode quantitatively reproduced by our calculations. Our calculations predict monotonic increase of tunneling splitting with vibrational excitations for the nearly planar ν34 mode. The experimental results show an oscillatory behavior of the energy splitting as a function of the vibrational quantum number for this mode. Our model cannot explain such behavior. According to Takada and Nakamura [58], the energy splitting oscillates with respect to quantum number in the case of antisymmetric mode coupling potential in so-called mixed tunneling region which can be an explanation of the observed effect.
| Band | CIS/6-31++G** (cm−1) [59] | CIS/6-311++G** (cm−1) | Exp. [53, 54] (cm−1) |
|---|---|---|---|
| 330 | 22.9 | 20.3 | 20 |
| 331 | 25.1 | 30.2 | 33 |
| 332 | 27.4 | 41.2 | |
| 333 | 29.7 | 53.2 | |
| 340 | 20.7 | 20.0 | 20 |
| 341 | 24.7 | 28.0 | 31 |
| 342 | 28.8 | 36.7 | 29 |
| 343 | 33.2 | 46.1 | |
| 380 | 24.5 | 24.4 | 20 |
| 381 | 24.0 | 18.2 | |
| 382 | 23.5 | 9.4 | 5 |
| 383 | 23.0 | 5.5 | |
| 390 | 24.7 | 22.9 | 20 |
| 391 | 24.5 | 20.1 | |
| 392 | 24.3 | 16.8 | 8 |
| 393 | 24.1 | 12.9 | |
| 394 | 23.9 | 10.5 | 6 |
| 395 | 23.7 | 7.9 | |
| 396 | 23.5 | 5.3 | 5 |
| 397 | 23.3 | 3.5 | |
| 398 | 23.1 | 1.6 | 2 |
Present approach constitutes improvement of the previous work [59] which used the same model potentials, given by (18) and (19); however the method to obtain parameters was different. The coupling parameters α and γ were obtained from approximate formulas taking into account only two structures in the à state, stable structure and saddle point structure (transition state). Parameters obtained in such way were different, especially values of γ were by one order of magnitude lower than values obtained in this work. Previous model calculations reproduced quantitatively experimental tunneling energy splitting in the vibrationally ground state of tropolone but only qualitatively changes of the tunneling splittings with excitations of low-frequency modes.
Previously there have been other attempts to interpret tunneling splittings in the à state of tropolone, by Vener et al. [56] and Smedarchina et al. [57] Vener et al. used an adiabatic description in a model three-dimensional potential based on the ab initio CIS/6-31G calculations. Their approach was not successful in describing the dynamics of the excited state. Smedarchina et al. employed an instanton method combined with the PES obtained by the ab initio CIS/6-31G** calculations. They were able to obtain satisfactory agreement between theory and experiment for linearly coupled modes, however they had to adjust the adiabatic barrier height. Our present results do not require such adjustment and present pure quantum mechanical approach to the problem of tunneling splittings in the excited state of tropolone. Burns et al. have also provided detailed quantum mechanical computations for the vibrations and potential energy surface properties of tropolone in its lowest pi*-pi electronic excited state [76].
In this approach we do not deal with the other low-frequency modes. The modes we took are typical ones to explain the effects of vibrational excitation on tunneling. The other modes are either higher-frequency modes or not hydrogen-bond stretching modes (e.g., ν35, ν36, ν37). The model potentials used in this paper are not adequate to describe the influence of these modes on proton tunneling.
3.3. Conclusions
The proton tunneling dynamics of tropolone in the excited à state have been studied by performing the high accuracy quantum mechanical calculations of the potential energy surfaces and fitting them by two-dimensional model potentials. The tunneling energy splittings for different vibrationally excited states of low-frequency modes have been calculated and compared with the available experimental data. The experimentally observed promotion of the tunneling by the excitation of the planar ν33 and ν34 modes and suppression by the excitation of the out-of-plane ν38 and ν39 modes have been reproduced quantitatively by our calculations. They reproduce the long sequence of monotonic decrease of the tunneling splittings accompanying excitations of the out-of-plane ν39 mode.
Acknowledgments
Figures 1–3 and Tables 1–4 are reprinted with permission from M. Boczar, Ł. Boda and M.J. Wójcik, J. Chem. Phys. 127, 084307 (2007). Copyright 2007, American Institute of Physics. Figures 4–7 and Tables 5–9 are reprinted with permission from M.J. Wójcik, Ł. Boda and M. Boczar, J. Chem. Phys. 130, 164306 (2009). Copyright 2009, American Institute of Physics.


