Influence of Electrolyte Refreshing on the Photoelectrochemical Performance of Fiber-Shaped Dye-Sensitized Solar Cells
Abstract
Given the convenient sealing of fiber-shaped dye-sensitized solar cells (FDSSCs), the electrolyte refreshing effect on the photo-electrochemical performance of FDSSCs was studied. The electron transport and interfacial recombination kinetics were also systematically investigated by electrochemical impedance spectroscopy. With increased electrolyte refreshing times from 0 to 10, the open-circuit voltage (Voc) and fill factor (FF) increased, whereas the photocurrent density (Jsc) and power conversion efficiency (PCE) significantly decreased. The increased Voc was mainly ascribed to the electron recombination resistance (Rct, WE) at the TiO2/electrolyte interface and electron lifetime. The decreased Jsc and PCE were due to dye desorption and the increase of series resistance. Further investigation proved that Li+ played a vital role in increasing Voc as electrolyte refreshing and Li+ had more significant impact than TBP (tert-butyl pyridine) on maintaining high Voc.
1. Introduction
Given their high-energy conversion efficiency and simple fabrication process, dye-sensitized solar cells (DSSCs) have been attracting worldwide scientific and technological interest for decades [1–3]. Research on the optimization of materials and fabrication procedures is progressive.
Consequently, current planar DSSCs using I3−/I− electrolytes, have achieved up to 11%-12% conversion efficiency [4–6], and the efficiency of large-scale modules has also reached 8% with aperture areas of more than 20 cm2 [7]. DSSCs are considered as promising alternatives to conventional silicon-based photovoltaic devices for sustainable, low-cost, and environment-friendly energy supply. However, there are still obstacles to overcome, such as cost, limited efficiency in the large-scale module, electrolyte leakage, cell sealing, and stability.
Fiber solar cells have received great attention in recent years [8–22]. Their advantages over DSSCs having traditional sandwiched planar structure include the following. (1) Nonflat structured solar cells get rid of the dependence on transparent conductive oxides (TCOs) [8]. Traditional solar cells and the reported tubular solar cells still use TCOs, which usually account for 30%–50% of total cell costs [23]. (2) The fiber cell is a macro-one-dimensional structure, and has a smaller package area ratio than the two-dimensional structure. Making a larger cell only requires increasing the length of the cell. When the cell is increased to a certain size, the package area of the cell remains basically unchanged [20]. (3) The flexible fiber cell can directly adopt the traditional preparation technology. In contrast, special technologies must be adopted to create all kinds of traditional flexible flat cells (like OPVs and planar DSSCs) to ensure that the flexible substrate will not be damaged during the preparation process, such as low temperatures. (4) Existing textile techniques can be directly used in weaving for the mass production of fiber cells. This method is another further improvement of the traditional roll-to-roll technology for producing flexible electronic devices [18, 24].
The advancements in fiber solar cells, including fiber-shaped organic solar cells and fiber-shaped DSSCs (FDSSCs), have thus far been impressive [8, 9, 11]. The highest power efficiency of FDSSCs ever reported is above 7% [18]. FDSSCs not only address the problems of traditional flat cells, but also provide some new features to elucidate the factors that affect their performances. For example, Fu et al. [18] have studied the three-dimensional light collecting ability of FDSSCs. FDSSCs are found to be able to harvest surrounding light efficiently to double their power output. Under high light intensity, FDSSCs combined with a condenser also still has a relatively high output power and fill factor, with little performance decline. O’Connor et al. [14] have proposed a new type of solar cell that combines a series of fiber cell units with narrow-band spectrum absorption. A proper arrangement in space is adopted to realize full-spectrum absorption of the sun spectra, resulting in 17% theoretical power convention efficiency. All these above results are difficult to achieve when using planar DSSCs.
FDSSCs act as units, and they are easily encapsulated because only one end or both ends of the capillary need to be sealed during the sealing process [20]. This fact enables the possibility of more conveniently renewing the electrolyte, in contrast to planar DSSCs whose electrolytes cannot be refreshed once they are sealed tightly. In the present paper, the effect of electrolyte refreshing on the photovoltaic performance of FDSSCs was studied. The electron transport and interfacial recombination kinetics were also systematically investigated using electron impedance spectroscopy (EIS).
2. Experimental
2.1. Materials
All chemicals and solvents used were of pure quality. The Ti filament (99.7% pure, diameter = 0.25 mm) was purchased from Alfa Aesar. LiI, I2, and 4-tetrabutylpyridine (TBP) were purchased from Aldrich. Acetonitrile (CH3CN, GR: guaranteed reagent) was purchased from Siyou Inc., Tianjin, China. N719 dye ([(C4H9)4N]2 [Ru(II)L2(NCS)2], where L = 2,2-bipyridyl-4,4 dicarboxylic acid; ruthenium TBA535) and 1-butyl-3-methylimidazolium iodide (BMII) were from the Dalian Rainbow Light Solar Technology Development Co., Ltd. The TiO2 colloid was prepared as follows. About 12.0 mL of tetra-butyl titanate (Aldrich) and 2.0 mL of acetic acid were mixed with vigorous stirring. The mixture was slowly dropped into 60.0 mL of water, and 0.5 mL of 65% nitric acid was added to the system. After stirring for 2 h in an oil bath at 80°C, 35 mL of the mixture was transferred into the autoclave and left undisturbed at 220°C for 12 h. After removing part of the solvent, 0.6 g of polyethylene oxide (Mw = 4000; Aldrich) was added and the TiO2 colloid was ready.
2.2. Fabrication of FDSSCs
The Ti wires were cleaned using acetone, isopropanol, and then ethanol. The Ti wires were immersed into the prepared TiO2 colloid and dipped in and out several times. Sintering at 400°C for 5 min followed. A thin layer of TiO2 film was formed on the Ti wire. The above step was repeated until the required thickness of the TiO2 film was obtained. The TiO2-coated electrode was sintered at 450°C for 30 min. The electrode was sensitized in a 10−4 M N719 ethanol solution for 24 h to obtain the sensitized working electrode. The counterelectrode was a Pt wire 40 μm in diameter. The Pt wire was uniformly and spirally wound onto the photoanode and then inserted into the sealing capillary (0.5 mm inner diameter and 0.85 mm outer diameter) filled with the electrolyte. This electrolyte contained 0.04 M iodine, 0.6 M BMII, 0.05 M LiI, and 0.30 M TBP in acetonitrile. The capillary was sealed with wax to prevent the electrolyte leakage. Each time refreshing the electrolyte, the wax was melted to decapsulate the FDSSC. The used electrolyte was removed, and the unsealed FDSSCs were allowed to suck the fresh electrolyte by capillarity. Finally, the cells were sealed again using wax.
2.3. Measurement and Methods
All device tests and short circuit current responses were conducted on a Keithley Model 2000, with sunlight simulator (YS-55, Japan). The illumination intensity is 100 mW/cm2. The aperture area of the cell was obtained from the project area Apron, which was equal to twice the sum of the Ti wire diameter and TiO2 film thickness, multiplied by the length of the device. The short circuit current density Jsc was I/Aproj (I is the short circuit current). The power conversion efficiency PCE was Jsc × Voc × FF/Pin, where Voc is the open-circuit voltage, FF is the fill factor, and Pin is the intensity of incident light. The electrochemical impedance spectrum was obtained using PGSTAT302N (Autolab Corp., Switzerland) within the frequency range of 0.05 Hz to 300 kHz at room temperature and was fitted using Nova 1.7 software.
3. Results and Discussion
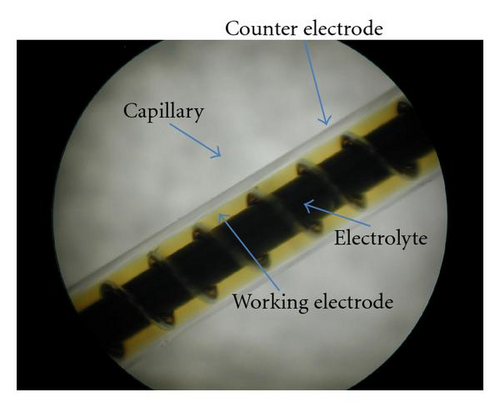
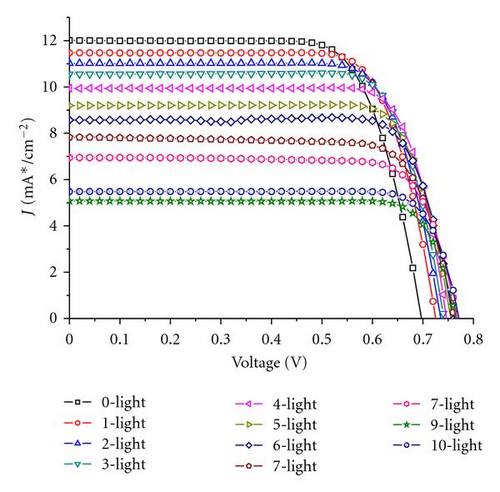
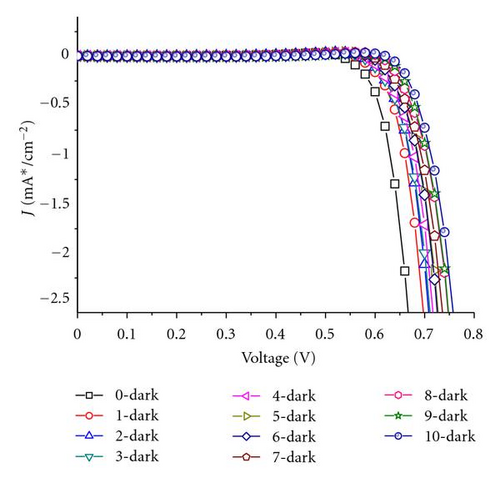
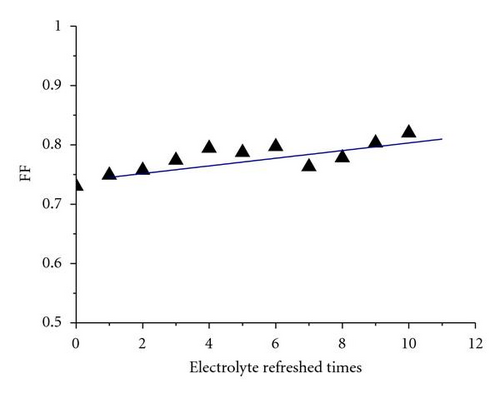
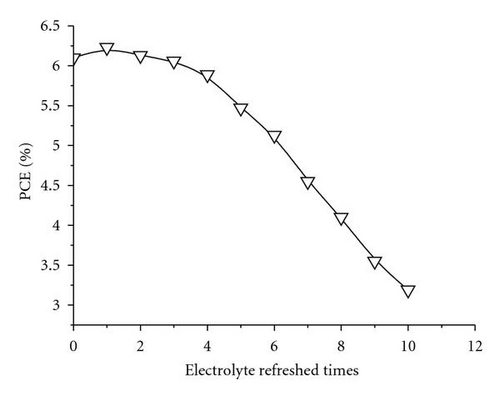
Generally, the electrolytes of FTO-glass-based planar DSSCs could not be or difficultly refreshed once there is already an electrolyte leakage. FDSSCs overcome this problem because of their simple and detachable sealing methods [20]. The new issue is whether the electrolyte refreshing times affect the performance of FDSSCs. Figure 1 is an optical photo of FDSSC, in which the details of FDSSC are demonstrated. The FDSSC consists a counterelectrode wrapped around the working electrode, which then encapsulated in a capillary filled with electrolytes. Figure 2 shows the photocurrent density-voltage (J-V) characteristics of devices with electrolyte refreshing times under air mass (AM) 1.5 illumination (100 mW/cm2) (Figure 2(a)) and under dark conditions (Figure 2(b)). The dependency of the photovoltaic performance parameters (Jsc, Voc, FF, and PCE) on the electrolyte refreshing times is shown in Figure 3. With increased electrolyte refreshing times from 0 to 10, Voc gradually increased from 0.697 to 0.760 V. FF also increased from 0.730 to 0.820, whereas Jsc decreased from 12.01 to 5.07 mA/cm2. The PCE was at the apex when the electrolyte was refreshed for the first time. At this point, Voc, Jsc, FF, and PCE of the FDSSCs were 0.725 V, 11.47 mA/cm2, 0.749, and 6.23%, respectively. During the second electrolyte refreshing, the PCE began to drop. All these results indicated that certain phenomena occurred inside the FDSSCs when the electrolytes were frequently refreshed.

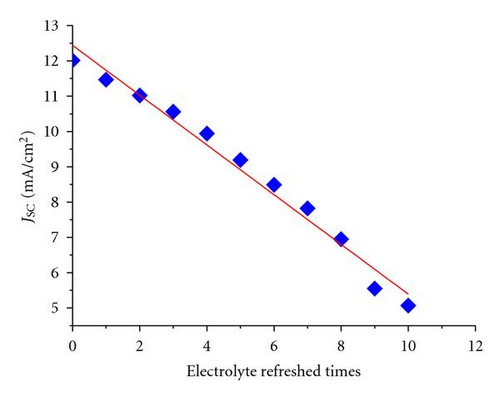
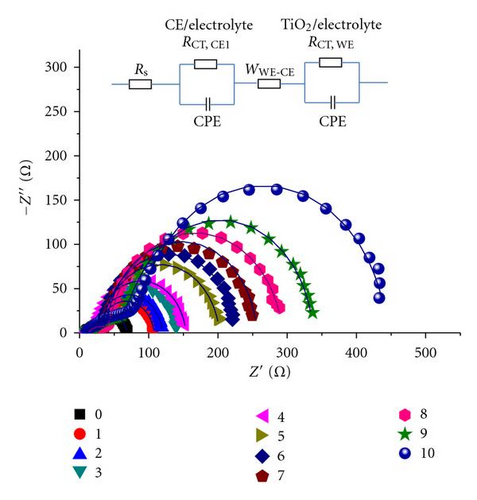
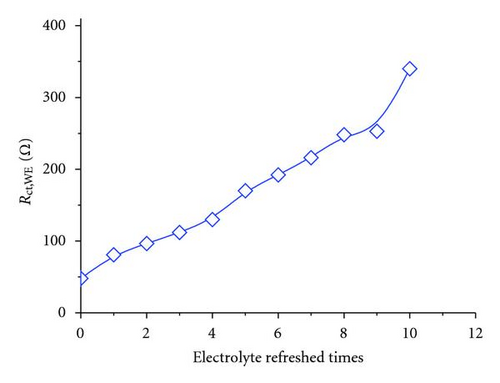
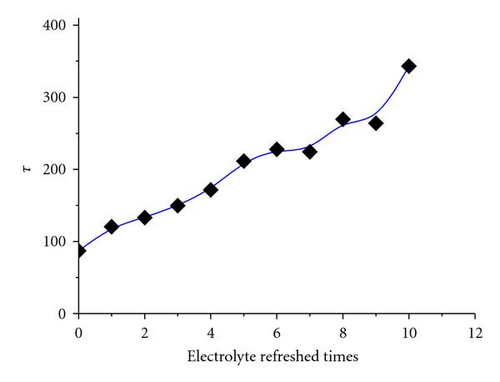
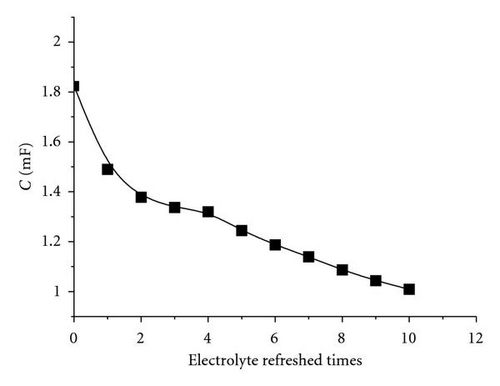
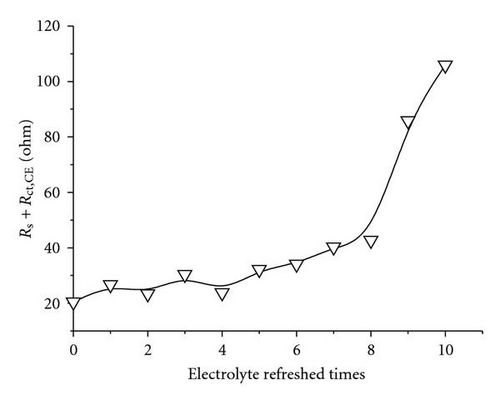
As aforementioned, Jsc declined with electrolyte refreshing. This finding may be ascribed to several aspects. On one hand, it was due to dye desorption. Figure 5(c) shows that the TiO2/electrolyte interface capacitance Cμ decreased with electrolyte refreshing. According to (6), decreases with electrolyte refreshing. This tendency indicates less photocurrent injected into the TiO2 from the excited dye, which may be due to dye desorption. On the other hand, the increased Rs + Rct,CE with electrolyte refreshing (Figure 5(d)) decreased the Jsc [31], which was likely to the electrolyte corrosion of the counter electrolyte [34].
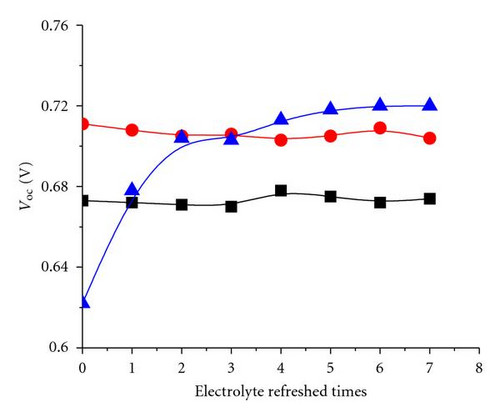
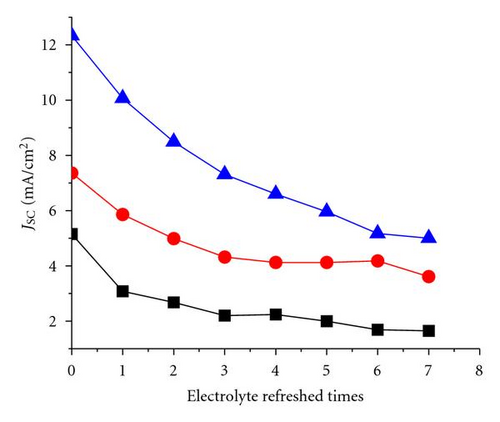
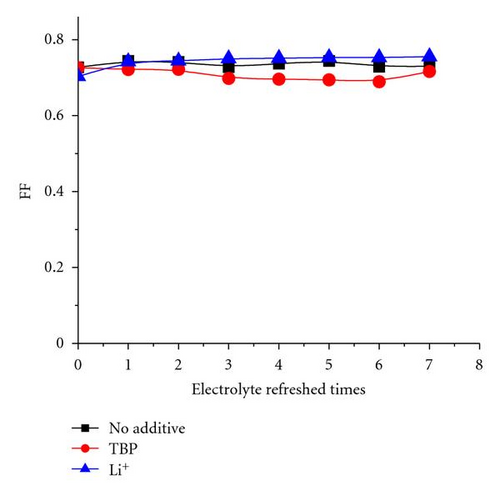
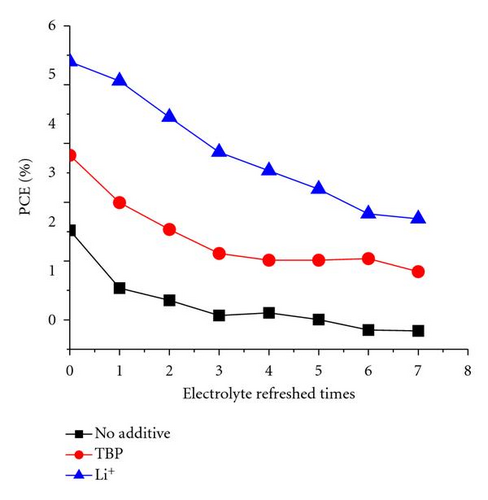
The additive TBP and Li+ play important roles in maintaining a high Voc [35, 36]. The tendency shown in Figure 3 may be attributed to the remaining additive in the solar cell with electrolyte refreshing. To prove this assumption, the electrolyte refreshing effects on devices based on different electrolytes A, B, and C were investigated. The contents of electrolytes A, B, and C were detailed as follows: A: 0.04 M I2 and 0.6 M BMII; B: 0.04 M I2, 0.6 M BMII, and 0.03 M TBP; C: 0.04 M I2, 0.6 M BMII, and 0.05 M LiI. All the I-V parameters of the devices based on A, B, and C are shown in Figure 6. In Figure 5(a), Voc of the devices based on A and B changed little, whereas that of the devices based on C obviously increased with electrolyte refreshing. FF of all the devices only slightly changed with electrolyte refreshing. Jsc and PCE of all the devices decline in a similar tendency, which can be ascribed to the interface charge transport and recombination analyzed in the previous parts. Therefore, we could conclude from Figure 6 that the remaining Li+ significantly influenced Voc with electrolyte refreshing, the remaining TBP little influenced Voc with electrolyte refreshing and the factors that decreased Jsc were mainly related to the decreased PCE. Comparing Figures 3 and 6, we could find that Voc of devices based on electrolyte with both TBP and Li+ was larger than that of A, B, C, which were based on electrolyte with no additive, with TBP only and with Li+ only, respectively. It is confirmed that TBP and Li+ were in synergism to increase Voc.
4. Conclusions
The effect of electrolyte refreshing on the photovoltaic performance of FDSSCs was studied. The electron transport and interfacial recombination kinetics were also systematically investigated by EIS. With increased electrolyte refreshing times from 0 to 10 times, FF and especially Voc increased, whereas Jsc and PCE significantly decreased. The increase in Voc was mainly ascribed to less electron recombination with the I3− ions as the electrolytes were refreshed according to EIS. Li+ also played a critical role in Voc, increase and it worked with TBP synergistically to improve Voc. The decline in Jsc and PCE was primarily brought about by dye desorption and the increase of series resistance.
Acknowledgments
This work was jointly supported by the NSFC (50833001), MOST (2011CB933300), and MOE (309001) of China.


