Aerosol Monitoring over Athens Using Satellite and Ground-Based Measurements
Abstract
Satellite data of moderate spatial resolution (MODIS and MERIS) were used to retrieve the aerosol optical depth (AOD) over the urban area of Athens. MODIS products were obtained at a horizontal resolution of 10 by 10 km2 centered over Athens, while the differential textural analysis (DTA) code was applied to MERIS images to retrieve relative-to-reference AOD with a resolution of 260 m by 290 m. The possibility of exploiting the full resolution of MERIS data in retrieving AOD over a grid of a few hundreds metres was thereby investigated for the first time. MERIS-based AOD, centred at 560 nm, showed strong positive correlation to ground-based PM10 data (R2 = 0.85), while MODIS AOD products were in agreement with both MERIS and PM10. Back trajectories were used to study the impact of atmospheric conditions prevailing during the examined days. Days associated with Saharan air masses corresponded to enhanced AOD and predominance of coarse-mode particles. The results suggest that, at least for the case of Athens, AOD retrieved by MERIS images using the DTA code over cloud-free areas can be related to PM10. The accuracy of retrieval mainly depends on the successful selection of the reference satellite data, namely, an image being least contaminated by tropospheric aerosols.
1. Introduction
Various types of aerosol can be found in the Mediterranean, namely, desert dust, originated from the Saharan desert, pollution particles, emittedmainly by urban and industrial activities, marine aerosol, formed continuously over the Mediterranean, and biomass-burning smoke, produced by seasonal forest fires during summer. PM10 and PM2.5 have been accounted for health impairment of citizens in urban areas [1, 2], and high levels of such particulate pollutants, along with gaseous pollutants (nitrogen oxides, carbon monoxide, and ozone) have been reported in Athens (Greece) over the last two decades [3]. Therefore, air quality improvement and monitoring in the capital of Greece is of great concern to the government since reduction of air pollutant exposures will have both short- and long-term public health benefits. Furthermore, Greece has to comply with the related directives of the European Union.
Aerosol parameters can be measured in-situ or remotely sensed from ground, aircraft, or satellite. In particular, satellite remote sensing has been increasingly used to map aerosols in the atmosphere [4]. It constitutes a recent but powerful tool for assessing aerosol spatial distribution and properties due to its major benefit of providing complete and synoptic views of large areas in single snapshots. The data from satellite sensors can be used to improve current understanding and to give a boost to the effort in future climate predictions caused by aerosols. A variety of techniques have been applied to different datasets with spatial resolutions varying from moderate and low (using Meteosat, AVHRR, or SeaWiFS data) [5–9] to high (using SPOT and Landsat data) [10–12]. Because satellite-based information on tropospheric aerosols is relatively recent, its reliability must still be checked against ground-based measurements [13].
The derivation of aerosol parameters from the Moderate Resolution Imaging Spectroradiometer (MODIS) ushers in a new era in aerosol remote sensing from space [14] since their launch in 1999 and 2002 onboard the Terra and Aqua polar-orbiting satellites, respectively. MODIS aerosol data have demonstrated their utility in studies at regional and at global level as well as in radiative forcing calculations [14–17]. Moreover, Hutchison [18] has shown that MODIS data and products can detect and track the migration of pollutants; he analyzed some cases to show the usefulness of remote sensing in monitoring air quality in urban areas. The Medium Resolution Imaging Spectrometer (MERIS) is also a moderate-to-high spatial resolution Earth observing system on-board ENVISAT, launched in 2002.
The present study attempts to retrieve the aerosol load in terms of aerosol optical depth (AOD) related to air quality in the Athens urban area. For the purpose of this study, both satellite remote sensing and ground-based measurements were used in conjunction with model applications. The goal of this research is to investigate whether MERIS can provide information on the spatial distribution of aerosols over urban areas, with horizontal resolution as high as its inherent ground sampling distance, that is, of the order of a few hundreds of metres. MERIS 5th band, centred at 560 nm, has a spatial advantage over the spectrally equivalent MODIS 4th band (555 nm); less than 300 metres versus 500 metres. Such information could be best associated to urban aerosol distribution and could also be used to link local pollution emissions to their regional and global effects in climatology.
2. Description of the Area
Athens is located in an oblong basin that is characterized by a complex topography and covers an area of approximately 450 km2 with a population of about 3.5 million inhabitants (census 2001). The basin is surrounded by mountains at the three sides and by the sea (Saronikos Gulf) in the south. This complex topography gives a result of poor air-mass mixing within the basin [19]. The main sources of pollution are industrial activities, concentrated in the southwest edge, and the increasing number of vehicles.
During summer there are two opposite wind regimes; calms or sea-breeze circulation that appear when the synoptic flow is weak, and are frequently associated with high levels of airpollution [20], and the strong northeasterly winds called “Etesian”. Different aerosol loading and properties have been monitored in the basin proportionally to the wind pattern [20]. The sea breeze andcalms favor the accumulation of pollutants in the Athens atmosphere and the formation of a yellowish-brown cloud of optically effective particles over Athens due to photochemical reactions (e.g., [19]).
3. Datasets
3.1. MERIS Data
MERIS data are currently available in 15 spectral bands, in the nominal spectral range 400–900 nm, in two modes; at full spatial resolution (260 m by 290 m), and at reduced resolution (1200 m), with a swath of 1150 km around nadir. MERIS provides a global coverage of the Earth every 3 days [21]. A series of MERIS Level 2 Full Resolution images acquired over the Prefecture of Attica including the Greater Athens Area (GAA), were pre-selected. Their selection was based on the criterion of identical orbit over the study area in order to avoid geometrical distortions that would affect the radiometry of the images. The images selected corresponded to six dates (Table 1) with minimum cloud cover and high acquisition quality. MERIS Level 2 images had already been corrected for gaseous absorption and Rayleigh contributions and represented “top-of-atmosphere reflectance values”. All images were acquired at approximately 11:30 a.m. local time. The pre-selected images were visually inspected in order to detect, and eventually delineate, thin clouds or dense dust cloud transportation (e.g., from Sahara). MERIS images were classified with respect to pollution levels on the basis of ground-based pollutant concentration measurements in order to designate a “reference image” that is, the image with the lowest pollution load, that was required to apply the DTA method.
| Aristotelous | Zografou | |||||||||
|---|---|---|---|---|---|---|---|---|---|---|
| NO2 | NO | SO2 | O3 | PM10 | NO2 | NO | SO2 | O3 | PM10 | |
| [μg/m3] | ||||||||||
| 22/6/03 | 59.85 | 13.55 | 4.45 | 37.71 | 11.46 | 1.12 | 27.83 | |||
| 25/6/03 | 103.12 | 54.91 | 8.32 | 71.45 | 31.13 | 3.22 | 45.46 | |||
| 4/7/03 | 97.36 | 47.54 | 9.5 | 98.37 | 29.75 | 1.75 | 54.12 | |||
| 14/7/03 | 80.31 | 44.35 | 4.08 | 68.58 | 24.96 | 2.62 | 41.08 | |||
| 15/8/03 | 72.15 | 34.15 | 3.8 | 48.25 | 33.71 | |||||
| 31/8/03 | 87.5 | 65.25 | 5.75 | 96.17 | 62.46 | |||||
| Agia Paraskevi | Likovrisi | |||||||||
| NO2 | NO | SO2 | O3 | PM10 | NO2 | NO | SO2 | O3 | PM10 | |
| 22/6/03 | 10.37 | 1.00 | 4.41 | 125.2 | 29.12 | 17.62 | 4.51 | 82.37 | ||
| 25/6/03 | 19.82 | 1.41 | 9.57 | 141.5 | 54.79 | 52.51 | 19.54 | 74.71 | ||
| 4/7/03 | 29.62 | 1.37 | 9.12 | 158.8 | 53.86 | 63.42 | 24.92 | 74.08 | ||
| 14/7/03 | 24.33 | 2.33 | 10.71 | 121.1 | 48.25 | 50.83 | 14.62 | 60.12 | ||
| 15/8/03 | 5.50 | 1.00 | 15.02 | 153.0 | 37.71 | 25.58 | 5.83 | 69.46 | 54.75 | |
| 31/8/03 | 29.75 | 2.1 | 18.83 | 130.8 | 71.17 | 66.67 | 19 | 54.83 | 85.37 | |
3.2. MODIS Data
MODIS acquires daily imagery in 36 spectral bands from the visible to the thermal infrared (29 spectral bands with 1-km resolution, 5 spectral bands with 500 m resolution, and 2 with 250 m resolution, nadir pixel dimensions). The data used in this study are MODIS aerosol retrieval products based on distinguished algorithms over land and ocean to obtain AOD at 550 nm (AOD550) and the proportion of AOD contributed by fine-mode aerosols (fine-mode fraction: FM), which are only created over cloud-free regions. Both AOD550 and FM data correspond to Collection 5 (c005) data, where much of the high bias is removed [22]. However, in dust-aerosol regimes, retrieved AOD550 will have greater error due to their non-spherical effects [23, 24]. The FM fractionwas initially given over ocean but it can now be obtained also over coastal areas. The retrieval algorithms are fully described by Remer et al. [25] and Levy et al. [22].
The MODIS study area included GAA centered at 37.5°N latitude and 23.4°E longitude with 10 km × 10 km (Level 2) spatial resolution. Since Athens is a coastal urban area the previous pixel is probably affected by the differences between land and sea. An additional uncertainty in both AOD and FM retrievals over coastal areas is caused by the land-ocean sub-pixel contamination. Even with improved formulation of FM, retrievals of both parameters still have large uncertainties because the assumption of the empirical surface reflectance ratios seems too simple to account for complexities of land-surface reflectance [17].
3.3. PM10 and Gaseous Pollutant Measurements
The Ministry of Environment (MINENV) provided the necessary air-pollutant concentration data. MINENV operates an organized monitoring network covering GAA with eighteen stations on hourly basis. The examined data refer to hourly concentration measurements of NO2, NO, SO2, O3, and PM10 (Table 1). PM10 concentrations were monitored at four air-pollution monitoring stations within GAA representative of different environments. “Aristotelous” station is established in the city center near a road with heavy traffic. High levels of primary air pollutants (e.g., NO2, SO2) are still measured at this station. “Zografou” station is located in the University of Athens campus in a suburban region with low traffic and far from inhabited areas. This location is at the east edge of the basin, at the foothills of mountain Hymettos. It should be noted that these two stations were used by Chaloulakou et al. [3] as representing urban and suburban environments from the PM monitoring point of view. “Agia Paraskevi” is a suburb of Athens located in the northeast edge of the basin. Last, “Likovrisi” station is situated in a north suburb with low population density and close to open areas near the Parnitha mountain. It should be noted that, despite the distance from the city center, air-pollution and PM concentrations at this station are significant due to the city circulation patterns, which carry the pollutants to the north.
PM10 filter samples were collected using low-volume samplers. The sampling flow rate was 16.71 l min −1. The particles were collected on 47-mm Pallflex TX40 lm−1 filters (Teflon-coated glass fiber filters), which were mounted in plastic filter holders. Each filter was inspected for its integrity prior to its use. Particle concentrations were determined gravimetrically using an electronic microbalance (Metter Toledo AT201), with 0.01-mg resolution. Air pollutants, such as nitrogen dioxide (NO2), nitrogen oxide (NO), sulfur dioxide (SO2), and tropospheric ozone (O3), are concurrently measured by the MINENV network. NO2 and NO, O3, and SO2 concentrations are determined using chemiluminescence, UV, and fluorescence techniques, respectively.
Analysis of PM10 and gaseous pollutant data was initially performed for classifying the available images into highly, moderately, slightly polluted and pollution-free. According to the examined ground-based pollution information, the selected images acquired on 25/6/2003, 4/7/2003, 14/7/2003, 15/8/2003 and 31/8/2003 were considered as “pollution images” compared to that of 22/6/2003. In particular, among these dates the 4/7/2003 and the 31/8/2003 indicated rather high levels of pollution and AOD (i.e., PM10 exceeded the upper limit of the mean daily value of 50 μgm−3), the 15/8/2003 shows light pollution, and the other two days present moderate pollution levels. Finally, the 22/6/2003 was identified as “reference image” (pollution-free) according to its low PM10 values.
4. Methodology
The method used for AOD retrieval from MERIS data is the differential textural analysis (DTA) based on the “contrast reduction” principle. The DTA code is part of the SMA code developed by Sifakis et al. [11], and has already been tested on high-spatial resolution data, such as SPOT [10] and Landsat [12], and moderate-spatial resolution data, such as AVHRR [8]. The code quantifies contrast-reduction as the local “textural degradation” on geometrically and radiometrically corrected satellite datasets composed by a “pollution” image and a “reference” image (pollution-free). Contrast reduction is then attributed to the presence of aerosols assuming that the surface reflectance is invariable between the two images, which requires their proximity in acquisition time. Retrieved AOD values are then relative to the reference image. More specifically, the following stages were implemented for the application of the DTA code.
The first step was the selection of appropriate reference and polluted images. This stage was critical because the accuracy in the AOD retrieval depends on the quality of the reference image. More specifically, the reference image should present minimum AOD values with a homogeneous spatial distribution. The selection of a reference image can be arduous requiring the examination of long time-series of satellite data. The reference image was selected on the basis of the following criteria:
- (i)
low PM and other pollutant concentrations as measured by ground-based stations,
- (ii)
available meteorological information, and
- (iii)
availability of cloud-free image.
In case of lack of actual pollution data (e.g., PM10, NO2) the selection of the reference image could be based on a statistical comparison applied to the available images: lower pollution levels on an image would be revealed by higher values of standard deviation (expressing the apparent texture or local contrast). In our case study, PM10 concentration data measured at ground level by the organized network of MINENV (see Section 3.3) were used for the selection of “pollution” images so that significant tropospheric aerosol concentrations be captured.
In the second step, the selected images underwent geometric correction (georeferencing). At this stage re-sampling was carried out according to the “nearest neighborhood” code in order to avoid altering the initial radiometric values of the pixels.
In the third step the DTA code was applied. The code calculates the local textural degradation in order to derive the spatial distribution of AOD values. This calculation was carried out inside an adjustable moving window. The size of the window was optimized according to the resolution of the sensor as a compromise between
- (a)
a large window including sufficient apparent ground texture, directly linked to the local contrast, and
- (b)
a small window allowing to consider a homogeneous atmospheric correction.
The structure-function performance suggested by Paronis and Sifakis [26] allowed to determine the window size. The application of the structure-function performance showed that the optimal window size was 13 pixels by 13 pixels. The use of this moving window allowed the final results to maintain the spatial resolution of MERIS pixel, namely 260 m × 290 m, thus perceiving aerosol inhomogeneities at this scale. For the case of GAA, covering approximately 450 km2, AOD information was derived at 3000 points versus only four ground air-pollution monitoring stations. The DTA code was applied to the selected series of MERIS images over GAA, considering, in total, five “polluted” and one “reference” images. All images underwent geo-referencing according to the UTM WGS 84 (zone 34N) projection system using Ground Control Points (GCPs) included in the header file of each of the images with the use of BEAM software (BEAM 2004). Subsequently, the images were reported to the ERDAS imaging software (ERDAS 2003) in order to be processed for AOD retrieval over land in the vicinity of GAA by applying the DTA code, which has been developed in the MODELLER module of ERDAS Imaging software.
Using the previous methodology we obtained the AOD values at the fourteen MERIS spectral channels with 260 m × 290 m spatial resolution, centered over each ground-based monitoring station. AOD values were subsequently averaged to cover the entire GAA for the five days considered. In all cases a reduction of the retrieved spectral AOD values with wavelength according to a power low was observed as foreseen by Mie theory.
The knowledge of spectral dependence of AOD is important for the modeling of the radiative effects of aerosols on the land-atmosphere system, as well as for the retrieval of the aerosol optical parameters from satellite-remote sensors [27]. The wavelength dependence of AOD depends on the aerosol type, that is, the physical and chemical characteristics of the particles. Wavelength dependence is expressed by the Ångström exponent (α), which is the slope of the logarithm of AOD versus the logarithm of wavelength (ln λ), and is commonly used to characterize the spectral dependence of AOD and to provide information on the aerosol-size distribution. For the whole dataset the α-Ångström was derived using the least-squares method, which is the least imprecise and wavelength dependent [28], covering the spectral region 412.5–885 nm of the MERIS-based AOD. Errors and uncertainties in its derivation are attributed to the dispersion of AOD values from the linear fit and are more biased than those produced using ground-based radiometers [29]. The DTA method assumes the proximity of the pollution and reference dates. We have not assessed the impact of extended surface changes to the AOD, since such changes do not exist in a two-month period. Usually, areas suspected for major surface-reflective changes are avoided (masked). Therefore, the error in the estimated AOD due to changes in the surface reflectivity is negligible. Typical errors in α derivation applying the least-squares method on MERIS AODs were found to range from 0.05 to 0.24, which is much higher than those obtained via radiometers 0.032 ± 0.001 [29]. Kaskaoutis et al. [29] also found that a 0.03 error in AOD can introduce a 7–10% error in the Ångström exponent.
5. Results and Discussion
5.1. Satellite Images
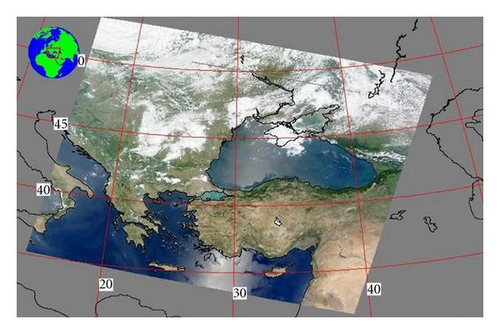
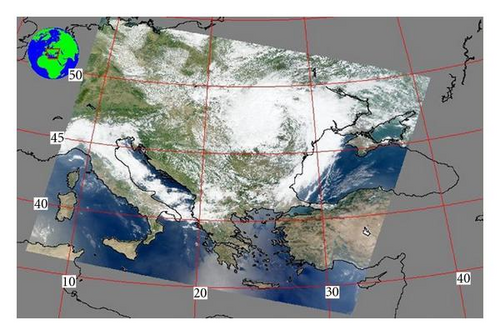
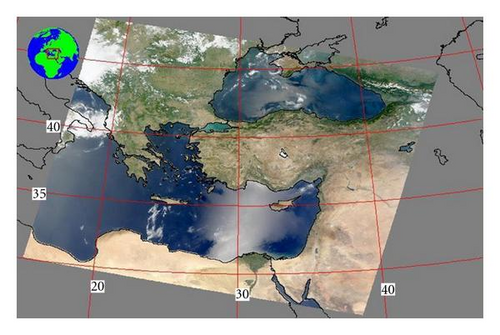
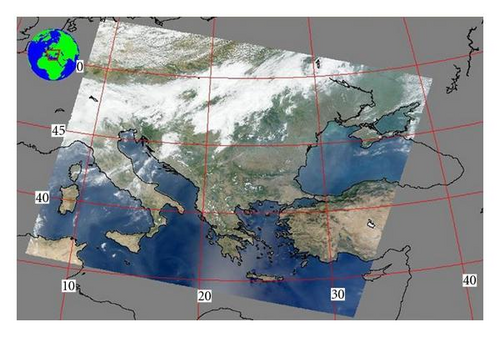
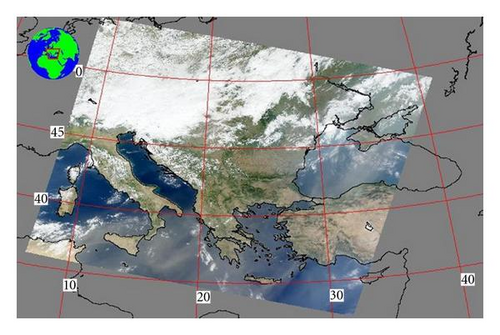
Figures 1(a)–1(e) show true color Terra-MODIS images covering the whole Eastern Mediterranean and corresponding to thefive examined days. These images, due to their largerspatial coverage, are capable of detecting Saharan dust outbreaks above the Eastern Mediterranean basin. The MODIS pictures referring to 25/6/2003 (Figure 1(a)), 14/7/2003 (Figure 1(c)) and 15/8/2003 (Figure 1(d)) seem to be rather clear over the whole Greek territory, while the sea glint effect is quite intense. A clearly different pattern was obvious on 4/7/2003 (Figure 1(b)) when a thin dust plume was blown north of Libya affecting the Aegean Sea and continental Greece intensifying the aerosol load above Athens. However, even on this day the sea glint is obvious above the seas adjoining the Greek subcontinent. Figure 1(d), referring to 15/8/2003, represents the clearest day over Athens in accordance to the minimum air-pollutant and PM10 concentrations (Table 1). In contrast, 31/8/2003 is a dusty day with a dust plume blowing northeastward of the Tunisian/Libyan coasts. The MODIS image clearly reveals the geographical extension of this dust plume moving northeast through the Central Mediterranean, Aegean Sea and continental Greece.
5.2. Back Trajectories
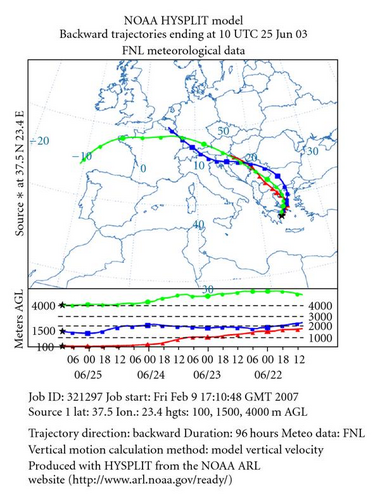
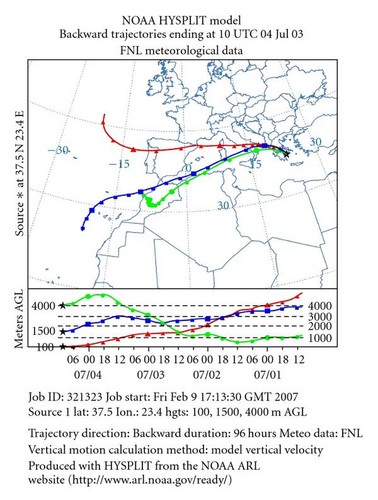
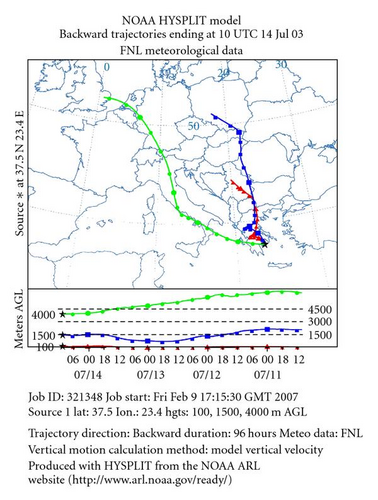
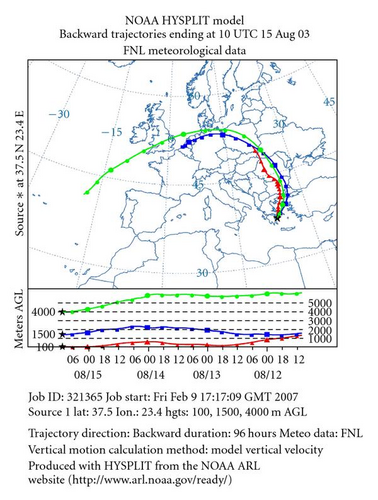
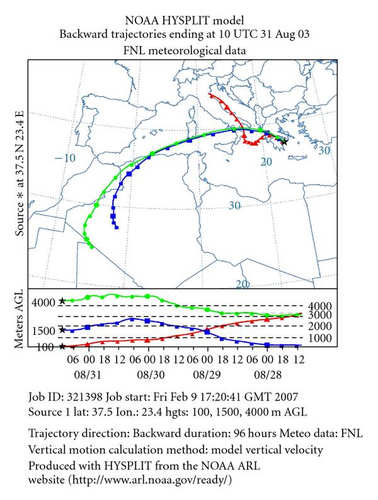
Analytical air-mass back trajectories for the five dates, obtained by the Hybrid Single-Particle Langrangian Integrated Trajectory (HYSPLIT) Model [30], were used to identify the pathway of air masses over Athens. The back trajectories were computed for 3 distinct arrival levels, namely 100 m, to give representative origin of air masses near the surface, 1500 m, which could serve as a representative height for the boundary layer, in which the majority of the aerosol particles was present, and 4000 m for the presence of Sahara dust layers to be captured. The 4-day back trajectory analysis, presented in Figures 2(a)–2(e), clearly verifies the two dusty days (Figures 2(b) and 2(e)), where the trajectories at both 4000 m and 1500 m showa Sahara origin. Particularly, they originated from areas in Northwestern Africa (Algeria and Morocco) under the influence of intense surface winds. In their trip over the Sahara desert they were both within the boundary layer as was also established via the HYSPLIT model. It should be noted that this direction is the main pathway for the dust plumes influencing both the Central [31, 32] and Eastern Mediterranean [33]. On the other three days the air masses influencing Athens came at all altitudes from the northern sector traversing Central Europe and the Balkan countries. It was established that these air masses usually carry anthropogenic or biomass-smoke aerosols over Greece [34]. From MODIS fire-mapping website http://maps.geog.umd.edu/firms/ it was found (not shown) that on 12–15 August a large number of fire events occurred in the Balkan counties probably influencing theair mass on 15/8/2003; therefore, an increase in α values was derived from MERIS (see Section 5.4).
5.3. DREAM Model Applications
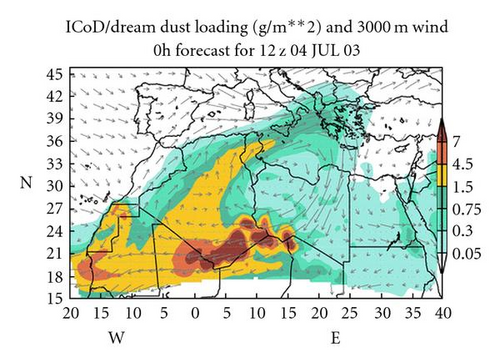
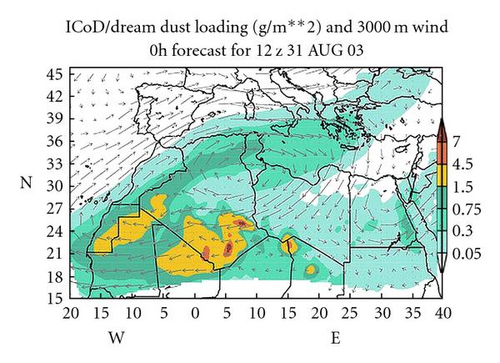
The dusty days (4/7/2003 and 31/8/2003) were also successfully forecasted by the Dust Regional Atmospheric Modelling (DREAM) model [35], which has been extensively used for the identification of dust events in the Mediterranean [33, 36, 37]. The 0-hr forecast presented in both figures is the safest prediction and represents the real situation. Typical output results for 12 UTC (0-h forecast) are given in Figures 3(a) and 3(b) indicating the dust loading affecting the whole Greek territory on these days. In these figures the wind speed and direction at 3000 m are also shown, and they are consistent with air-mass trajectories reaching Athens (Figures 2(b) and 2(e)). From the wind pattern at 3000 m it can be revealed that an anticyclone was established in North Libya (Figure 3(a)) and North Algeria (Figure 3(b)) carrying dust particles over Greece. These anticyclones were also observed (not shown) on the preceding days to those selected. An important finding using the DREAM model is the dry deposition of dust particles occurring over Greece on both dusty days (not presented), thus leading to significant enhancement of PM10 concentrations on the surface. This is very important to be mentioned since, in numerous cases, the air masses transport dust over Greece in the free troposphere without any signal in PM10 measurements [38]. On the other three days, no dust load was found over Greece and for this reason the respective figures are not presented.
5.4. Comparison between Satellite and Ground-Based Measurements
MERIS AOD values retrieved with the proposed method (DTA) precisely over the locations of the MINENV stations were compared to PM10 measurements at the respective stations. The data sets for all days were correlated through linear regression and the correlation coefficients for each one of the 14 MERIS spectral bands are presented in Table 2. The correlations between satellite-based AODs and ground-based PM10 concentrations are higher than 70% (R2 > 0.50) when using any of the spectral bands in the visibleregion. The highest correlation (R2 = 0.83) was found when using the MERIS AOD at 560 nm for all days combined. On the other hand, the correlation coefficients drop significantly in the NIR band (R2 < 0.3). The correlations between AOD and PM10 for individual days varied from R2 = 0.63 to R2 = 0.88; they are strong enough, especially in the visible spectrum but not in the infrared (>770 nm), to justify the above error levels. The slope values in Table 2 are small since the X axis corresponds to AOD(×103). From all MERIS channels, channel 5 (560 nm) is considered the best correlated, where the slope is the highest and the intercept the lowest. In this channel the strong correlation justifies the dependency of PM10 on AOD and, in general, the above correlation is statistically significant at the 95% confidence level for the visible spectrum. The revealed linearity and the low scatter at 560 nm allow a first-order prediction of the PM10 levels near the surface based on the AOD values. The strong positive correlation between the AOD-derived from satellites and ground-based PM10 concentrations suggests that the majority of the aerosol particles are within the boundary layer; their influence on the aerosol load increases with the slope of their correlation. Papayannis et al. [33] also proved via lidar signals that even during the dust events, the majority of the aerosols are within the boundary layer, below 1500 m. The relation between PM10 and AOD also indicates to what extent and in which cases and columnar data reflect surface characteristics.
| Bands | Band center (nm) | R2 | Y |
|---|---|---|---|
| 1 | 412.5 | 0.56 | 0.12 x + 28.31 |
| 2 | 442.5 | 0.54 | 0.12 x + 30.48 |
| 3 | 490 | 0.53 | 0.12 x + 32.43 |
| 4 | 510 | 0.53 | 0.12 x + 33.57 |
| 5 | 560 | 0.83 | 0.19 x + 14.51 |
| 6 | 620 | 0.48 | 0.11 x + 39.39 |
| 7 | 665 | 0.48 | 0.10 x + 40.78 |
| 8 | 681.25 | 0.48 | 0.10 x + 41.02 |
| 9 | 708.75 | 0.46 | 0.10 x + 43.42 |
| 10 | 753.75 | 0.32 | 0.11 x + 46.19 |
| 12 | 778.75 | 0.22 | 0.09 x + 52.31 |
| 13 | 865 | 0.19 | 0.09 x + 51.74 |
| 14 | 885 | 0.19 | 0.09 x + 51.75 |
Figure 4 presents mean AOD, PM10 and Aerosol Index (AI) values, averaged over GAA for each individual day. In the same figure AOD values from MERIS correspond to 560 nm and constitute the average values for all available AODs above all MINENV stations, retrieved at a spatial grid of 260 m by 290 m; while the vertical bars express one standard deviation from the mean value. The AOD550 from both Terra-MODIS and Aqua-MODIS have been retrieved from the pixel centered above Athens city center (37.5°N 23.4°E) with a spatial resolution of 10 km × 10 km. AI data using version “8” algorithm were obtained from the TOMS sensor onboard Earth-Probe platform. AI is available on a daily basis, at a 1° × 1.25° resolution. Finally, PM10 concentrations constitute the mean values in the time interval between 11 : 00 and 12 : 00 a.m. (local time) thus best corresponding to MERIS (11 : 30 a.m.) and to Terra-MODIS (10 : 30 a.m.) passes. Such a comparison between “MERIS retrievals” and “MODIS products” may include some arbitrariness, mainly due to the different AOD-retrieval codes and different spatial resolutions. It is, however, noteworthy that all satellite sensors and ground-based measurements were in agreement regarding the aerosol-load variation over GAA between the different days examined. It was found that the spatially-averaged AOD values from MERIS are highly correlated with the respective AOD product from Terra-MODIS (R2 = 0.85) or Aqua-MODIS (R2 = 0.83). Furthermore, the MERIS spatially-averaged AOD at 560 nm was correlated with ground-based PM10 concentration measurements with R2 to be as high as 0.82. The strong correlations between PM10 and columnar AOD are mainly affected by dust events on two of the days, which significantly enhanced dust deposition on the surface and PM10. Similar strong correlation between PM10, sun-photometer based AOD and TOMS AI was found in Crete during Sahara dust events [38].
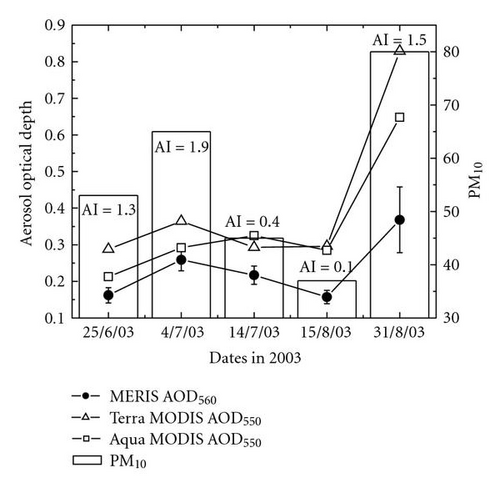
From Figure 4, the 25th of June and the 14th of July can be characterized as days with moderate air pollution levels; the 15th of August as day with low pollution levels, and the 4th of July and particularly the 31st of August as days with high or severe air pollution. Mean MERIS AOD at 560 nm was found to range from 0.13 to 0.33 when days are examined individually (Figure 4). The lower MERIS-AOD values, compared to those obtained by MODIS, are attributed to the “relative” method used to derive AOD including the use of a “reference” day, which was assumed to be pollution-free. The examination of this “reference” day in view to PM10 showed low but not negligible pollution in the Athens atmosphere (Table 1), while Terra and Aqua MODIS AOD550 was 0.195 and 0.175, respectively. As previously shown from back trajectories and DREAM applications, on two days (4 July 2003 and 31 August 2003), a Sahara dust plume affected GAA. These dust events further degraded air quality in the Athens urban environment, thus affecting mainly PM10 concentrations. Furthermore, on these days the TOMS AI values were high, thus indicating the presence of dust. In Mediterranean coastal urban areas, such as Athens, which are close to North African arid regions, the effects of dust outbreaks play a key role in PM10 concentrations and further contribute to the urban air quality and human health. Many studies [36, 39–41] have established that dramatic PM10 enhancements in Southern Europe are with Sahara dust outbreaks. A PM10 concentration enhancement with simultaneous increase in columnar AOD is characteristic of convective dust transport over Greece [38]. Back trajectories at 4000 m and 1500 m on 4 July 2003 and 31 August 2003 verified this type of transport; so did DREAM simulations, which showed dry deposition of dust particles over Athens on these days.
Using the least-squares method the Ångström exponent α was derived from MERIS-AOD values covering the spectral range 412.5–885 nm on each individual day. These values, associated with their standard deviations caused by averaging them over GAA, are presented in Figure 5. In the same figure the FM values from both Terra- and Aqua-MODIS sensors are also plotted. Despite the limited number of days and difficulties encountered (i.e., different spatial resolution, significant typical error in α computation) the analysis gave similar results with respect to α and FM values. The only discrepancy was revealed on 15 August 2003 where the computed large mean α value was not in accordance with respective FM values. On the other days, high α values were associated with high FM values. The two dusty days (i.e., 4 July 2003, 31 August 2003) were characterized by low values in both α and FM. The linear correlations between α and FM values were significantly strong; their variance was 93% and 70% in the case of Terra- and Aqua-MODIS, respectively. This result clearly establishes the agreement between the two satellite sensors despite their different spatial resolution and the differences in product definition (i.e., α and FM). Terra-MODIS correlates better than Aqua-MODIS with MERIS retrievals due to proximity between their passes (approximately one hour lag). Unfortunately, there are no systematic measurements of fine particles (e.g., PM2.5 or PM1.0) in GAA in order to compare with α and FM values.
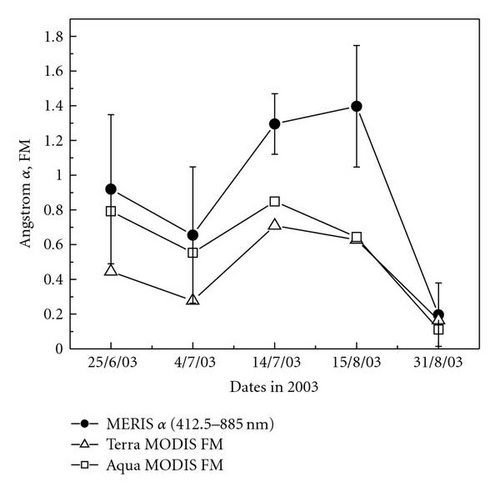
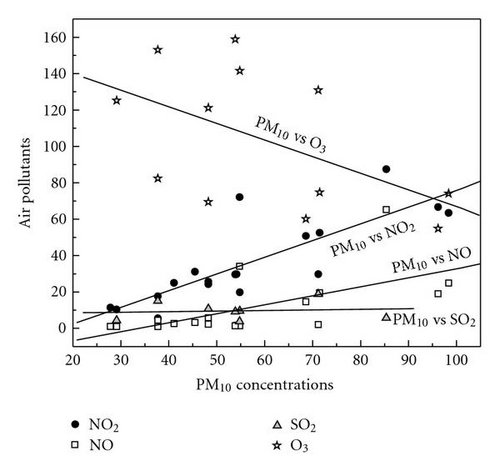
Figure 6 shows the correlations between daily mean PM10 and air-pollutant concentrations for all the available data presented in Table 1. Particularly, the correlation between PM10 and NO2 (R2 = 0.67) is statistically significant (P < .001) indicating that most of the aerosols that contribute to PM10 have originated from vehicle exhausts, which are the main source for NO2 production. NO2 is a highly variable atmospheric constituent, which plays a key role in the complex ozone cycle, both in the stratosphere where it is naturally present, and the troposphere, where its concentration may be high due to pollution. The respective correlation (PM10 versus NO) is positive but not statistically significant (R2 = 0.39), while no correlation between PM10 and SO2 seems to exist. Strong associations between particle-mass concentrations and primary gaseous pollutants have been previously reported in Birmingham, suggesting the importance of traffic-related emissions [42]. Gaseous pollutants (except ozone) are mostly associated with local sources, including exhaust emissions, domestic heating and industrial activities. These strong associations suggest that a large fraction of particles are emitted locally. On the other hand, the tropospheric ozone, which is a photochemical pollutant, exhibits a decreasing trend when PM10 concentration increases. Within the Athens Basin, primary air pollutants (such as NO) are mainly produced in downtown Athens (“Aristotelous” station), while the highest tropospheric O3 concentrations take place at stations far from the city center, and mainly in the northern areas of the Basin (“Likovrisi” and “Agia Paraskevi” stations). This is attributed to the fact that tropospheric O3 is a very reactive pollutant and, therefore, the highest concentrations of other pollutants in the center (like NO2, NO, SO2) contribute to its destruction.
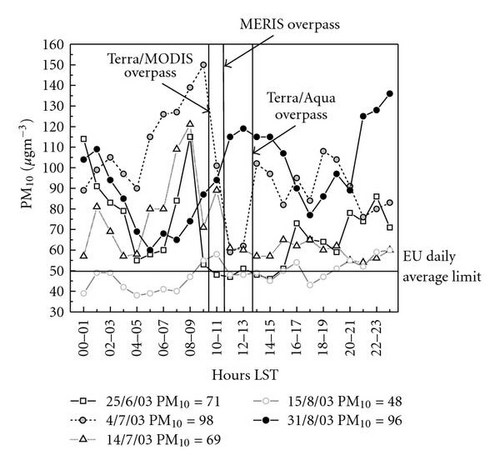
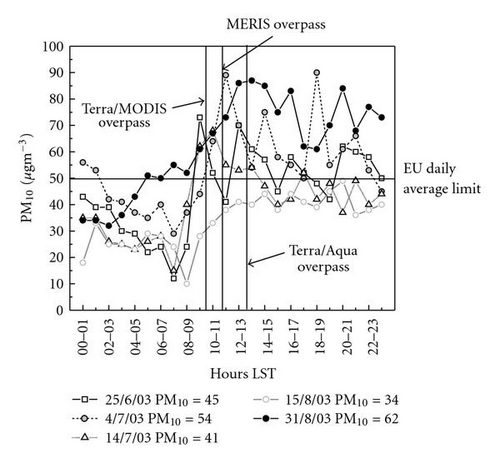
In Figures 7(a) and 7(b) the diurnal variation of PM10 at two stations within GAA is presented for the five days considered. The PM10 values are the hourly average in the time intervals presented. The two stations selected are the urban “Aristotelous” (Figure 7(a)) and the suburban “Zografou” (Figure 7(b)), in order to establish the differences in PM10 concentrations caused by local emissions. It should be noted that similar values at these stations have already been published by Chaloulakou et al. [3]. The main remarks from both figures is the inexistence of a clear diurnal pattern especially at “Aristotelous” station, while at “Zografou” the PM10 concentrations exhibit an increasing trend from early morning to midday, remaining nearly constant in the rest of the day. It is also obvious that except of the local sources the dust deposition on the two dusty days significantly affected the PM10 concentrations (see daily mean values in both figures). In both figures, the daily threshold value of 50 μgm−3 suggested by EU is also shown in order to reveal the considerably higher PM10 values over the Athens center. A full year monitoring of PM10 concentrations in Athens [3] gave a daily average of 75 μgm−3 during the sampling period (1 June 1999 to 31 May 2000) at “Aristotelous” station. This annual mean is considerably higher than the EU annual PM10 standard of 40 μgm−3.
6. Conclusions
In this study, Envisat MERIS observations were used to retrieve urban aerosol concentrations in terms of AOD over Athens with the possibility of producing maps showing AOD′s spatial distribution with approximately 300-m resolution. The extracted AOD values were relative to reference (i.e., pollution-free) satellite data. Additionally to MERIS data, AOD from Terra- and Aqua-MODIS sensors at 550 nm were also obtained over Athens with a 10-km spatial resolution.
Despite the different spatial resolutions and method inherent uncertainties compared to ground-based instruments, the satellite-based retrieval leads to satisfactory results in the majority of the cases; AOD derived by MERIS is in close agreement with AOD derived by MODIS even under different atmospheric conditions, such as dust or pollution. A high correlation was also found between MERIS AOD values, particularly those retrieved at 560 nm, and PM10 concentrations. These findings suggest that, at least for the Athens urban area, the application of the DTA code on MERIS imagery, whenever available and cloud-free, can be used to provide AOD values with air-quality associated information. Back-trajectory analysis and dust forecasts from the DREAM model completely verified these satellite outputs. The strong correlation of PM10 with AOD and NO2 indicates that (i) the majority of the aerosols are within the boundary layer and (ii) the most of the aerosol mass at ground level has originated from local emissions.
A more extended validation of the robustness of the method used in this study is foreseen in terms of further testing in other polluted urban areas and over a wider range of atmospheric conditions. The final objective is AOD mapping on an operational basis, which may be of interest to all metropolitan areas disposing ground-based pollution monitoring networks (including PM or gaseous concentration measurements), but which are few in number or spatially scarce.
Acknowledgments
The authors acknowledge the NOAA Air Resources Laboratory (ARL) for the provision of HYSPLIT transport and dispersion model and READY website used in this publication. The scientific team for providing the DREAM model via http://www.bsc.es/projects/earthscience/DREAM/ is also acknowledged.


